Get E-PDF Sample Report on Zero Liquid Discharge Systems Market - Request Sample Report
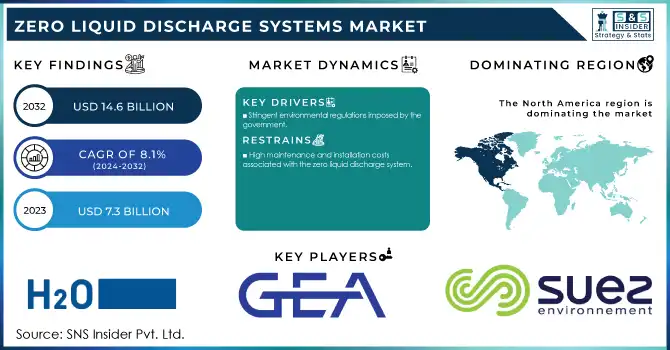
The Zero Liquid Discharge Systems Market Size was valued at USD 7.25 Billion in 2023 and is expected to reach USD 14.54 Billion by 2032, growing at a CAGR of 8.04% over the forecast period of 2024-2032.
The Zero Liquid Discharge System Market is growing rapidly due to strict environmental regulations and industrial sustainability goals. Our report presents a cost analysis and price trends, detailing installation, operational expenses, and pricing shifts. The impact of government regulations and compliance data is examined, alongside grants and incentives for Zero Liquid Discharge systems, easing financial constraints. A thorough economic and environmental impact analysis showcases cost savings and resource efficiency. The role of digitalization and smart technologies is explored, highlighting automation, IoT, and AI-driven advancements. Lastly, a benchmarking analysis against competing technologies assesses the cost, performance, and scalability of Zero Liquid Discharge systems compared to alternative wastewater treatment solutions.
Drivers
Growing Water Scarcity and Depleting Freshwater Resources Drive Zero Liquid Discharge System Market Expansion
Rising water scarcity due to climate change, rapid urbanization, and industrialization is a major factor driving the adoption of Zero Liquid Discharge Systems. Industries dependent on large water volumes for operations, such as power generation, oil and gas, and chemical manufacturing, face mounting pressure to optimize water consumption and reduce wastewater discharge. Zero Liquid Discharge Systems help industries recycle and reuse wastewater, ensuring sustainable water management amid growing freshwater shortages. Many countries are implementing stringent water conservation policies, encouraging industries to adopt advanced Zero Liquid Discharge System technologies to minimize water wastage. Furthermore, growing investments in desalination and water reuse projects are fueling market demand. Companies are leveraging Zero Liquid Discharge System solutions to address water-intensive processes, enhance operational efficiency, and reduce dependency on external freshwater sources. As global water stress continues to rise, industries are increasingly adopting Zero Liquid Discharge Systems to meet regulatory standards, maintain production continuity, and achieve long-term water sustainability.
Restraints
Complexity in System Design and Integration Limits the Zero Liquid Discharge System Market Growth
Zero Liquid Discharge Systems involve a combination of multiple water treatment technologies, making their design, installation, and operation highly complex. Industries require customized solutions based on wastewater composition, production scale, and regulatory requirements, leading to prolonged implementation timelines and increased engineering challenges. The integration of various treatment processes, such as membrane filtration, reverse osmosis, thermal evaporation, and crystallization, necessitates advanced technical expertise. Additionally, system malfunctions, inefficiencies in water recovery rates, and scaling issues in heat exchangers pose operational risks. The complexity of Zero Liquid Discharge Systems often discourages industries from adopting them, especially when alternative wastewater treatment options offer simpler implementation. The lack of skilled professionals and insufficient technical knowledge further hinder market growth, making it difficult for companies to achieve seamless system integration and optimize performance.
Opportunities
Government Incentives and Public-Private Partnerships Foster Zero Liquid Discharge System Market Growth
Governments worldwide are offering financial incentives, subsidies, and funding programs to encourage industries to implement Zero Liquid Discharge Systems. Public-private partnerships are playing a crucial role in supporting the adoption of advanced wastewater treatment technologies, particularly in water-stressed regions. Incentives such as tax credits, low-interest loans, and grants are reducing the financial burden on industries, making Zero Liquid Discharge Systems more accessible. Additionally, international organizations and environmental agencies are collaborating with industries to develop cost-effective and scalable Zero Liquid Discharge System solutions. The expansion of government-led water conservation initiatives and wastewater treatment infrastructure is further driving market growth. With increasing support from regulatory bodies, industries are expected to accelerate the adoption of Zero Liquid Discharge System technologies, creating lucrative opportunities for market players.
Challenge
Energy-Intensive Operations and Sustainability Concerns Pose Challenges for the Zero Liquid Discharge System Market
Zero Liquid Discharge Systems require high energy consumption for processes such as evaporation, crystallization, and membrane filtration, leading to concerns regarding sustainability and operational efficiency. Industries with limited energy resources find it challenging to integrate Zero Liquid Discharge Systems without significantly increasing their carbon footprint. The dependency on thermal-based technologies further escalates electricity costs, making Zero Liquid Discharge System solutions less viable for cost-sensitive industries. Companies are actively seeking energy-efficient alternatives and renewable energy integration to mitigate high power consumption. However, technological advancements are still needed to develop Zero Liquid Discharge Systems with reduced energy dependence. Until sustainable energy solutions become mainstream, high energy requirements will continue to challenge the market’s growth trajectory.
By System
Conventional Zero Liquid Discharge Systems dominated the market in 2023 with a 60% share. Their dominance is attributed to their proven efficiency, cost-effectiveness, and widespread adoption in industries with high wastewater discharge. Many regulatory bodies, such as the Environmental Protection Agency (EPA) in the United States and the European Environment Agency, have imposed strict wastewater discharge norms, compelling industries to implement these systems. Conventional systems, which utilize thermal evaporation and crystallization, are preferred in power plants and chemical manufacturing units due to their ability to handle high-salinity wastewater. For instance, in India, the National Green Tribunal (NGT) has mandated Zero Liquid Discharge Systems for textile and dyeing industries in states like Tamil Nadu, boosting the adoption of conventional systems over hybrid solutions.
By Process
Crystallization/Evaporation dominated the Zero Liquid Discharge Systems Market in 2023, holding a 36.5% market share. This dominance is driven by the process's ability to recover maximum reusable water while converting wastewater into solid waste for safe disposal. Industries such as power generation and chemicals rely on evaporation and crystallization to achieve stringent Zero Liquid Discharge mandates. The increasing adoption of thermal evaporation systems in water-scarce regions, such as the Middle East, is further accelerating demand. Additionally, organizations like the United Nations Industrial Development Organization (UNIDO) promote energy-efficient crystallization technologies to enhance sustainability in industrial wastewater treatment. The U.S. Department of Energy has also funded research into advanced evaporation methods to improve energy efficiency in Zero Liquid Discharge applications.
By Technology
Membrane-based dominated the Zero Liquid Discharge Systems market in 2023, accounting for 53.4% market share. Their dominance is fueled by their lower energy consumption compared to thermal-based systems and increasing advancements in membrane filtration technology. Reverse osmosis (RO) and nanofiltration (NF) are widely adopted in industries such as pharmaceuticals, textiles, and food and beverages to achieve high water recovery rates before the final evaporation stage. Government initiatives promoting sustainable water treatment, such as the European Union’s Water Framework Directive, have encouraged industries to integrate membrane-based systems. Moreover, companies like Veolia Water Technologies and Suez are investing in advanced membrane separation techniques, further driving the adoption of this technology in Zero Liquid Discharge applications.
By End-use Industry
The Energy & Power segment dominated the Zero Liquid Discharge Systems Market in 2023 with a 21.5% share. This leadership is driven by the sector's high-water consumption and stringent regulations for wastewater discharge. Thermal power plants and coal-fired stations require Zero Liquid Discharge Systems to comply with wastewater disposal mandates set by regulatory authorities like the U.S. Environmental Protection Agency (EPA) and India’s Central Pollution Control Board (CPCB). For example, China’s Ministry of Ecology and Environment has enforced strict Zero Liquid Discharge policies for coal-based power plants to mitigate water pollution. Furthermore, growing investments in renewable energy projects and sustainable water management practices have further accelerated the adoption of Zero Liquid Discharge Systems in the energy sector.
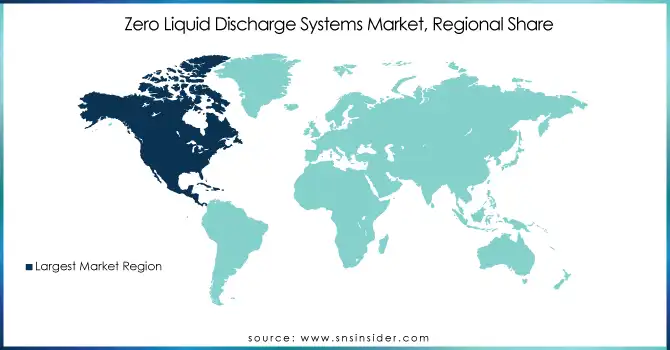
Asia Pacific dominated the Zero Liquid Discharge Systems Market in 2023, holding a market share of 38.7%. The region's dominance is driven by rapid industrialization, stringent environmental regulations, and severe water scarcity issues in key countries. China, the largest contributor, has implemented strict wastewater management policies, such as the Water Pollution Prevention and Control Action Plan, enforcing Zero Liquid Discharge in industries like power generation, textiles, and chemicals. The Ministry of Ecology and Environment in China has mandated Zero Liquid Discharge Systems for new coal-fired power plants, boosting adoption. India is another major player, with the National Green Tribunal enforcing Zero Liquid Discharge in industries like pharmaceuticals and textiles, particularly in Tamil Nadu and Gujarat. According to the Central Pollution Control Board (CPCB), over 75% of industrial wastewater in India is now treated using advanced systems. Southeast Asian nations, including Indonesia and Thailand, are also implementing stricter wastewater discharge laws, further propelling the demand for Zero Liquid Discharge Systems.
Looking ahead, North America emerged as the fastest-growing region in the Zero Liquid Discharge Systems Market, projected to register a significant CAGR during the forecast period. This growth is driven by increasing regulatory pressures, rising water reuse initiatives, and growing investments in sustainable wastewater treatment technologies. The United States is the dominant country in the region, with the Environmental Protection Agency (EPA) enforcing stringent wastewater discharge standards under the Clean Water Act. Power plants, oil refineries, and chemical manufacturers in the U.S. are mandated to implement Zero Liquid Discharge Systems to meet compliance requirements. The U.S. Department of Energy has invested significantly in research on advanced membrane-based and thermal-based Zero Liquid Discharge technologies to enhance efficiency. Canada is also seeing growing adoption, particularly in the oil sands industry, where the Alberta Energy Regulator has imposed strict water reuse guidelines. Increasing investments in industrial water recycling and sustainable water management solutions are expected to drive further growth in North America.
Get Customized Report as Per Your Business Requirement - Request For Customized Report
Alfa Laval (AlfaFlash Evaporator, Spiral Heat Exchangers)
Aqua Filsep Inc. (Zero Liquid Discharge Evaporators, Multi-Effect Evaporation Systems)
Aquarion AG (Zero Liquid Discharge Reverse Osmosis Systems, High Recovery Evaporation Systems)
Aquatech International LLC (Aquavap Evaporators, High-Efficiency Evaporation Systems)
Arvind Envisol–Samco Technologies, Inc. (Multiple Effect Evaporators, Membrane-Based Zero Liquid Discharge Systems)
Condorchem Envitech (Vacuum Evaporators, Crystallization Systems)
Evoqua Water Technologies (Brine Concentrators, Reverse Osmosis Zero Liquid Discharge Systems)
Fluence Corporation Limited (Nirobox Membrane Systems, Self-Contained Zero Liquid Discharge Units)
GEA Group AG (Mechanical Vapor Recompression Evaporators, Falling Film Evaporators)
GE Water & Process Technologies (now SUEZ) (Vaprox Evaporators, Brine Concentrators)
Goldfinch Evaporators (Thermal Evaporators, Forced Circulation Evaporators)
H2O GmbH (Vacudest Vacuum Evaporators, Clearcat Technology)
Hydro Air Research (High Recovery Reverse Osmosis Systems, Zero Liquid Discharge Filtration Units)
Lenntech (Advanced Membrane Systems, High Recovery Desalination Units)
Praj Industries (Hybrid Zero Liquid Discharge Systems, Membrane Distillation Systems)
SafBon Water Technology (Integrated Zero Liquid Discharge Solutions, Membrane Bioreactor Reverse Osmosis Based Zero Liquid Discharge Systems)
Shiva Global Environmental Private Limited (Thermal Evaporation Systems, Effluent Recycling Systems)
Thermax Limited (Thermal Desalination Systems, Multiple Effect Evaporation)
Toshiba Infrastructure Systems & Solutions Corporation (Brine Management Systems, Wastewater Recovery Units)
Veolia Water Technologies (HPD Evaporation Systems, Opus Zero Liquid Discharge Technology)
July 2024: UCC Environmental and Vacom Systems formed a strategic partnership to improve Zero Liquid Discharge technology in power generation. The collaboration aims to enhance wastewater management solutions, aligning with environmental regulations and sustainability goals.
March 2024: The Energy and Resources Institute (TERI) introduced new technology for achieving Zero Liquid Discharge in industrial wastewater. The innovation aims to help industries meet Central Pollution Control Board standards, particularly for textile and effluent treatment plants.
| Report Attributes | Details |
|---|---|
| Market Size in 2023 | USD 7.25 Billion |
| Market Size by 2032 | USD 14.54 Billion |
| CAGR | CAGR of 8.04% From 2024 to 2032 |
| Base Year | 2023 |
| Forecast Period | 2024-2032 |
| Historical Data | 2020-2022 |
| Report Scope & Coverage | Market Size, Segments Analysis, Competitive Landscape, Regional Analysis, DROC & SWOT Analysis, Forecast Outlook |
| Key Segments | •By System (Hybrid, Conventional) •By Process (Pre-treatment, Filtration, Crystallization/Evaporation) •By Technology (Membrane Based, Thermal Based) •By End-use Industry (Energy & Power, Food & Beverages, Chemicals & Petrochemicals, Pharmaceutical, Textiles, Oil and Gas, Metallurgy & Mining, Others) |
| Regional Analysis/Coverage | North America (US, Canada, Mexico), Europe (Eastern Europe [Poland, Romania, Hungary, Turkey, Rest of Eastern Europe] Western Europe] Germany, France, UK, Italy, Spain, Netherlands, Switzerland, Austria, Rest of Western Europe]), Asia Pacific (China, India, Japan, South Korea, Vietnam, Singapore, Australia, Rest of Asia Pacific), Middle East & Africa (Middle East [UAE, Egypt, Saudi Arabia, Qatar, Rest of Middle East], Africa [Nigeria, South Africa, Rest of Africa], Latin America (Brazil, Argentina, Colombia, Rest of Latin America) |
| Company Profiles | Aquatech International LLC, Alfa Laval, Praj Industries, H2O GmbH, Evoqua Water Technologies, GEA Group AG, Veolia Water Technologies, Thermax Limited, GE Water & Process Technologies (now SUEZ), Aqua Filsep Inc. and other key players |
Ans: The Zero Liquid Discharge Systems Market was valued at USD 7.25 Billion in 2023 and is expected to reach USD 14.54 Billion by 2032.
Ans: The Zero Liquid Discharge Systems Market is expected to grow at a CAGR of 8.04% during 2024 to 2032.
Ans: The energy and power sector dominated the market in 2023, accounting for 21.5% of the market share.
Ans: Government incentives and public-private partnerships are driving market growth.
Ans: Asia Pacific dominated the market in 2023, holding a 38.7% share.
Table of Contents
1. Introduction
1.1 Market Definition
1.2 Scope (Inclusion and Exclusions)
1.3 Research Assumptions
2. Executive Summary
2.1 Market Overview
2.2 Regional Synopsis
2.3 Competitive Summary
3. Research Methodology
3.1 Top-Down Approach
3.2 Bottom-up Approach
3.3. Data Validation
3.4 Primary Interviews
4. Market Dynamics Impact Analysis
4.1 Market Driving Factors Analysis
4.1.1 Drivers
4.1.2 Restraints
4.1.3 Opportunities
4.1.4 Challenges
4.2 PESTLE Analysis
4.3 Porter’s Five Forces Model
5. Statistical Insights and Trends Reporting
5.1 Cost Analysis & Price Trends
5.2 Government Regulations & Compliance Data
5.3 Grants & Incentives for Zero Liquid Discharge (ZLD) Systems
5.4 Economic & Environmental Impact Analysis
5.5 Digitalization & Smart Technologies
5.6 Benchmarking Against Competing Technologies
6. Competitive Landscape
6.1 List of Major Companies, By Region
6.2 Market Share Analysis, By Region
6.3 Product Benchmarking
6.3.1 Product specifications and features
6.3.2 Pricing
6.4 Strategic Initiatives
6.4.1 Marketing and promotional activities
6.4.2 Distribution and supply chain strategies
6.4.3 Expansion plans and new product launches
6.4.4 Strategic partnerships and collaborations
6.5 Technological Advancements
6.6 Market Positioning and Branding
7. Zero Liquid Discharge Systems Market Segmentation, by System
7.1 Chapter Overview
7.2 Hybrid
7.2.1 Hybrid Market Trends Analysis (2020-2032)
7.2.2 Hybrid Market Size Estimates and Forecasts to 2032 (USD Billion)
7.3 Conventional
7.3.1 Conventional Market Trends Analysis (2020-2032)
7.3.2 Conventional Market Size Estimates and Forecasts to 2032 (USD Billion)
8. Zero Liquid Discharge Systems Market Segmentation, by Process
8.1 Chapter Overview
8.2 Pre-treatment
8.2.1 Pre-treatment Market Trends Analysis (2020-2032)
8.2.2 Pre-treatment Market Size Estimates and Forecasts to 2032 (USD Billion)
8.3 Filtration
8.3.1 Filtration Market Trends Analysis (2020-2032)
8.3.2 Filtration Market Size Estimates and Forecasts to 2032 (USD Billion)
8.4 Crystallization/Evaporation
8.4.1 Crystallization/Evaporation Market Trends Analysis (2020-2032)
8.4.2 Crystallization/Evaporation Market Size Estimates and Forecasts to 2032 (USD Billion)
9. Zero Liquid Discharge Systems Market Segmentation, by Technology
9.1 Chapter Overview
9.2 Membrane Based
9.2.1 Membrane Based Market Trends Analysis (2020-2032)
9.2.2 Membrane Based Market Size Estimates and Forecasts to 2032 (USD Billion)
9.3 Thermal Based
9.3.1 Thermal Based Market Trends Analysis (2020-2032)
9.3.2 Thermal Based Market Size Estimates and Forecasts to 2032 (USD Billion)
10. Zero Liquid Discharge Systems Market Segmentation, by End-use Industry
10.1 Chapter Overview
10.2 Energy & Power
10.2.1 Energy & Power Market Trends Analysis (2020-2032)
10.2.2 Energy & Power Market Size Estimates and Forecasts to 2032 (USD Billion)
10.3 Food & Beverages
10.3.1 Food & Beverages Market Trends Analysis (2020-2032)
10.3.2 Food & Beverages Market Size Estimates and Forecasts to 2032 (USD Billion)
10.4 Chemicals & Petrochemicals
10.4.1 Chemicals & Petrochemicals Market Trends Analysis (2020-2032)
10.4.2 Chemicals & Petrochemicals Market Size Estimates and Forecasts to 2032 (USD Billion)
10.5 Pharmaceutical
10.5.1 Pharmaceutical Market Trends Analysis (2020-2032)
10.5.2 Pharmaceutical Market Size Estimates and Forecasts to 2032 (USD Billion)
10.6 Textiles
10.6.1 Textiles Market Trends Analysis (2020-2032)
10.6.2 Textiles Market Size Estimates and Forecasts to 2032 (USD Billion)
10.7 Oil and Gas
10.7.1 Oil and Gas Market Trends Analysis (2020-2032)
10.7.2 Oil and Gas Market Size Estimates and Forecasts to 2032 (USD Billion)
10.8 Metallurgy & Mining
10.8.1 Metallurgy & Mining Market Trends Analysis (2020-2032)
10.8.2 Metallurgy & Mining Market Size Estimates and Forecasts to 2032 (USD Billion)
10.9 Others
10.9.1 Others Market Trends Analysis (2020-2032)
10.9.2 Others Market Size Estimates and Forecasts to 2032 (USD Billion)
11. Regional Analysis
11.1 Chapter Overview
11.2 North America
11.2.1 Trends Analysis
11.2.2 North America Zero Liquid Discharge Systems Market Estimates and Forecasts, by Country (2020-2032) (USD Billion)
11.2.3 North America Zero Liquid Discharge Systems Market Estimates and Forecasts, by System (2020-2032) (USD Billion)
11.2.4 North America Zero Liquid Discharge Systems Market Estimates and Forecasts, by Process (2020-2032) (USD Billion)
11.2.5 North America Zero Liquid Discharge Systems Market Estimates and Forecasts, by Technology (2020-2032) (USD Billion)
11.2.6 North America Zero Liquid Discharge Systems Market Estimates and Forecasts, by End-use Industry (2020-2032) (USD Billion)
11.2.7 USA
11.2.7.1 USA Zero Liquid Discharge Systems Market Estimates and Forecasts, by System (2020-2032) (USD Billion)
11.2.7.2 USA Zero Liquid Discharge Systems Market Estimates and Forecasts, by Process (2020-2032) (USD Billion)
11.2.7.3 USA Zero Liquid Discharge Systems Market Estimates and Forecasts, by Technology (2020-2032) (USD Billion)
11.2.7.4 USA Zero Liquid Discharge Systems Market Estimates and Forecasts, by End-use Industry (2020-2032) (USD Billion)
11.2.8 Canada
11.2.8.1 Canada Zero Liquid Discharge Systems Market Estimates and Forecasts, by System (2020-2032) (USD Billion)
11.2.8.2 Canada Zero Liquid Discharge Systems Market Estimates and Forecasts, by Process (2020-2032) (USD Billion)
11.2.8.3 Canada Zero Liquid Discharge Systems Market Estimates and Forecasts, by Technology (2020-2032) (USD Billion)
11.2.8.4 Canada Zero Liquid Discharge Systems Market Estimates and Forecasts, by End-use Industry (2020-2032) (USD Billion)
11.2.9 Mexico
11.2.9.1 Mexico Zero Liquid Discharge Systems Market Estimates and Forecasts, by System (2020-2032) (USD Billion)
11.2.9.2 Mexico Zero Liquid Discharge Systems Market Estimates and Forecasts, by Process (2020-2032) (USD Billion)
11.2.9.3 Mexico Zero Liquid Discharge Systems Market Estimates and Forecasts, by Technology (2020-2032) (USD Billion)
11.2.9.4 Mexico Zero Liquid Discharge Systems Market Estimates and Forecasts, by End-use Industry (2020-2032) (USD Billion)
11.3 Europe
11.3.1 Eastern Europe
11.3.1.1 Trends Analysis
11.3.1.2 Eastern Europe Zero Liquid Discharge Systems Market Estimates and Forecasts, by Country (2020-2032) (USD Billion)
11.3.1.3 Eastern Europe Zero Liquid Discharge Systems Market Estimates and Forecasts, by System (2020-2032) (USD Billion)
11.3.1.4 Eastern Europe Zero Liquid Discharge Systems Market Estimates and Forecasts, by Process (2020-2032) (USD Billion)
11.3.1.5 Eastern Europe Zero Liquid Discharge Systems Market Estimates and Forecasts, by Technology (2020-2032) (USD Billion)
11.3.1.6 Eastern Europe Zero Liquid Discharge Systems Market Estimates and Forecasts, by End-use Industry (2020-2032) (USD Billion)
11.3.1.7 Poland
11.3.1.7.1 Poland Zero Liquid Discharge Systems Market Estimates and Forecasts, by System (2020-2032) (USD Billion)
11.3.1.7.2 Poland Zero Liquid Discharge Systems Market Estimates and Forecasts, by Process (2020-2032) (USD Billion)
11.3.1.7.3 Poland Zero Liquid Discharge Systems Market Estimates and Forecasts, by Technology (2020-2032) (USD Billion)
11.3.1.7.4 Poland Zero Liquid Discharge Systems Market Estimates and Forecasts, by End-use Industry (2020-2032) (USD Billion)
11.3.1.8 Romania
11.3.1.8.1 Romania Zero Liquid Discharge Systems Market Estimates and Forecasts, by System (2020-2032) (USD Billion)
11.3.1.8.2 Romania Zero Liquid Discharge Systems Market Estimates and Forecasts, by Process (2020-2032) (USD Billion)
11.3.1.8.3 Romania Zero Liquid Discharge Systems Market Estimates and Forecasts, by Technology (2020-2032) (USD Billion)
11.3.1.8.4 Romania Zero Liquid Discharge Systems Market Estimates and Forecasts, by End-use Industry (2020-2032) (USD Billion)
11.3.1.9 Hungary
11.3.1.9.1 Hungary Zero Liquid Discharge Systems Market Estimates and Forecasts, by System (2020-2032) (USD Billion)
11.3.1.9.2 Hungary Zero Liquid Discharge Systems Market Estimates and Forecasts, by Process (2020-2032) (USD Billion)
11.3.1.9.3 Hungary Zero Liquid Discharge Systems Market Estimates and Forecasts, by Technology (2020-2032) (USD Billion)
11.3.1.9.4 Hungary Zero Liquid Discharge Systems Market Estimates and Forecasts, by End-use Industry (2020-2032) (USD Billion)
11.3.1.10 Turkey
11.3.1.10.1 Turkey Zero Liquid Discharge Systems Market Estimates and Forecasts, by System (2020-2032) (USD Billion)
11.3.1.10.2 Turkey Zero Liquid Discharge Systems Market Estimates and Forecasts, by Process (2020-2032) (USD Billion)
11.3.1.10.3 Turkey Zero Liquid Discharge Systems Market Estimates and Forecasts, by Technology (2020-2032) (USD Billion)
11.3.1.10.4 Turkey Zero Liquid Discharge Systems Market Estimates and Forecasts, by End-use Industry (2020-2032) (USD Billion)
11.3.1.11 Rest of Eastern Europe
11.3.1.11.1 Rest of Eastern Europe Zero Liquid Discharge Systems Market Estimates and Forecasts, by System (2020-2032) (USD Billion)
11.3.1.11.2 Rest of Eastern Europe Zero Liquid Discharge Systems Market Estimates and Forecasts, by Process (2020-2032) (USD Billion)
11.3.1.11.3 Rest of Eastern Europe Zero Liquid Discharge Systems Market Estimates and Forecasts, by Technology (2020-2032) (USD Billion)
11.3.1.11.4 Rest of Eastern Europe Zero Liquid Discharge Systems Market Estimates and Forecasts, by End-use Industry (2020-2032) (USD Billion)
11.3.2 Western Europe
11.3.2.1 Trends Analysis
11.3.2.2 Western Europe Zero Liquid Discharge Systems Market Estimates and Forecasts, by Country (2020-2032) (USD Billion)
11.3.2.3 Western Europe Zero Liquid Discharge Systems Market Estimates and Forecasts, by System (2020-2032) (USD Billion)
11.3.2.4 Western Europe Zero Liquid Discharge Systems Market Estimates and Forecasts, by Process (2020-2032) (USD Billion)
11.3.2.5 Western Europe Zero Liquid Discharge Systems Market Estimates and Forecasts, by Technology (2020-2032) (USD Billion)
11.3.2.6 Western Europe Zero Liquid Discharge Systems Market Estimates and Forecasts, by End-use Industry (2020-2032) (USD Billion)
11.3.2.7 Germany
11.3.2.7.1 Germany Zero Liquid Discharge Systems Market Estimates and Forecasts, by System (2020-2032) (USD Billion)
11.3.2.7.2 Germany Zero Liquid Discharge Systems Market Estimates and Forecasts, by Process (2020-2032) (USD Billion)
11.3.2.7.3 Germany Zero Liquid Discharge Systems Market Estimates and Forecasts, by Technology (2020-2032) (USD Billion)
11.3.2.7.4 Germany Zero Liquid Discharge Systems Market Estimates and Forecasts, by End-use Industry (2020-2032) (USD Billion)
11.3.2.8 France
11.3.2.8.1 France Zero Liquid Discharge Systems Market Estimates and Forecasts, by System (2020-2032) (USD Billion)
11.3.2.8.2 France Zero Liquid Discharge Systems Market Estimates and Forecasts, by Process (2020-2032) (USD Billion)
11.3.2.8.3 France Zero Liquid Discharge Systems Market Estimates and Forecasts, by Technology (2020-2032) (USD Billion)
11.3.2.8.4 France Zero Liquid Discharge Systems Market Estimates and Forecasts, by End-use Industry (2020-2032) (USD Billion)
11.3.2.9 UK
11.3.2.9.1 UK Zero Liquid Discharge Systems Market Estimates and Forecasts, by System (2020-2032) (USD Billion)
11.3.2.9.2 UK Zero Liquid Discharge Systems Market Estimates and Forecasts, by Process (2020-2032) (USD Billion)
11.3.2.9.3 UK Zero Liquid Discharge Systems Market Estimates and Forecasts, by Technology (2020-2032) (USD Billion)
11.3.2.9.4 UK Zero Liquid Discharge Systems Market Estimates and Forecasts, by End-use Industry (2020-2032) (USD Billion)
11.3.2.10 Italy
11.3.2.10.1 Italy Zero Liquid Discharge Systems Market Estimates and Forecasts, by System (2020-2032) (USD Billion)
11.3.2.10.2 Italy Zero Liquid Discharge Systems Market Estimates and Forecasts, by Process (2020-2032) (USD Billion)
11.3.2.10.3 Italy Zero Liquid Discharge Systems Market Estimates and Forecasts, by Technology (2020-2032) (USD Billion)
11.3.2.10.4 Italy Zero Liquid Discharge Systems Market Estimates and Forecasts, by End-use Industry (2020-2032) (USD Billion)
11.3.2.11 Spain
11.3.2.11.1 Spain Zero Liquid Discharge Systems Market Estimates and Forecasts, by System (2020-2032) (USD Billion)
11.3.2.11.2 Spain Zero Liquid Discharge Systems Market Estimates and Forecasts, by Process (2020-2032) (USD Billion)
11.3.2.11.3 Spain Zero Liquid Discharge Systems Market Estimates and Forecasts, by Technology (2020-2032) (USD Billion)
11.3.2.11.4 Spain Zero Liquid Discharge Systems Market Estimates and Forecasts, by End-use Industry (2020-2032) (USD Billion)
11.3.2.12 Netherlands
11.3.2.12.1 Netherlands Zero Liquid Discharge Systems Market Estimates and Forecasts, by System (2020-2032) (USD Billion)
11.3.2.12.2 Netherlands Zero Liquid Discharge Systems Market Estimates and Forecasts, by Process (2020-2032) (USD Billion)
11.3.2.12.3 Netherlands Zero Liquid Discharge Systems Market Estimates and Forecasts, by Technology (2020-2032) (USD Billion)
11.3.2.12.4 Netherlands Zero Liquid Discharge Systems Market Estimates and Forecasts, by End-use Industry (2020-2032) (USD Billion)
11.3.2.13 Switzerland
11.3.2.13.1 Switzerland Zero Liquid Discharge Systems Market Estimates and Forecasts, by System (2020-2032) (USD Billion)
11.3.2.13.2 Switzerland Zero Liquid Discharge Systems Market Estimates and Forecasts, by Process (2020-2032) (USD Billion)
11.3.2.13.3 Switzerland Zero Liquid Discharge Systems Market Estimates and Forecasts, by Technology (2020-2032) (USD Billion)
11.3.2.13.4 Switzerland Zero Liquid Discharge Systems Market Estimates and Forecasts, by End-use Industry (2020-2032) (USD Billion)
11.3.2.14 Austria
11.3.2.14.1 Austria Zero Liquid Discharge Systems Market Estimates and Forecasts, by System (2020-2032) (USD Billion)
11.3.2.14.2 Austria Zero Liquid Discharge Systems Market Estimates and Forecasts, by Process (2020-2032) (USD Billion)
11.3.2.14.3 Austria Zero Liquid Discharge Systems Market Estimates and Forecasts, by Technology (2020-2032) (USD Billion)
11.3.2.14.4 Austria Zero Liquid Discharge Systems Market Estimates and Forecasts, by End-use Industry (2020-2032) (USD Billion)
11.3.2.15 Rest of Western Europe
11.3.2.15.1 Rest of Western Europe Zero Liquid Discharge Systems Market Estimates and Forecasts, by System (2020-2032) (USD Billion)
11.3.2.15.2 Rest of Western Europe Zero Liquid Discharge Systems Market Estimates and Forecasts, by Process (2020-2032) (USD Billion)
11.3.2.15.3 Rest of Western Europe Zero Liquid Discharge Systems Market Estimates and Forecasts, by Technology (2020-2032) (USD Billion)
11.3.2.15.4 Rest of Western Europe Zero Liquid Discharge Systems Market Estimates and Forecasts, by End-use Industry (2020-2032) (USD Billion)
11.4 Asia Pacific
11.4.1 Trends Analysis
11.4.2 Asia Pacific Zero Liquid Discharge Systems Market Estimates and Forecasts, by Country (2020-2032) (USD Billion)
11.4.3 Asia Pacific Zero Liquid Discharge Systems Market Estimates and Forecasts, by System (2020-2032) (USD Billion)
11.4.4 Asia Pacific Zero Liquid Discharge Systems Market Estimates and Forecasts, by Process (2020-2032) (USD Billion)
11.4.5 Asia Pacific Zero Liquid Discharge Systems Market Estimates and Forecasts, by Technology (2020-2032) (USD Billion)
11.4.6 Asia Pacific Zero Liquid Discharge Systems Market Estimates and Forecasts, by End-use Industry (2020-2032) (USD Billion)
11.4.7 China
11.4.7.1 China Zero Liquid Discharge Systems Market Estimates and Forecasts, by System (2020-2032) (USD Billion)
11.4.7.2 China Zero Liquid Discharge Systems Market Estimates and Forecasts, by Process (2020-2032) (USD Billion)
11.4.7.3 China Zero Liquid Discharge Systems Market Estimates and Forecasts, by Technology (2020-2032) (USD Billion)
11.4.7.4 China Zero Liquid Discharge Systems Market Estimates and Forecasts, by End-use Industry (2020-2032) (USD Billion)
11.4.8 India
11.4.8.1 India Zero Liquid Discharge Systems Market Estimates and Forecasts, by System (2020-2032) (USD Billion)
11.4.8.2 India Zero Liquid Discharge Systems Market Estimates and Forecasts, by Process (2020-2032) (USD Billion)
11.4.8.3 India Zero Liquid Discharge Systems Market Estimates and Forecasts, by Technology (2020-2032) (USD Billion)
11.4.8.4 India Zero Liquid Discharge Systems Market Estimates and Forecasts, by End-use Industry (2020-2032) (USD Billion)
11.4.9 Japan
11.4.9.1 Japan Zero Liquid Discharge Systems Market Estimates and Forecasts, by System (2020-2032) (USD Billion)
11.4.9.2 Japan Zero Liquid Discharge Systems Market Estimates and Forecasts, by Process (2020-2032) (USD Billion)
11.4.9.3 Japan Zero Liquid Discharge Systems Market Estimates and Forecasts, by Technology (2020-2032) (USD Billion)
11.4.9.4 Japan Zero Liquid Discharge Systems Market Estimates and Forecasts, by End-use Industry (2020-2032) (USD Billion)
11.4.10 South Korea
11.4.10.1 South Korea Zero Liquid Discharge Systems Market Estimates and Forecasts, by System (2020-2032) (USD Billion)
11.4.10.2 South Korea Zero Liquid Discharge Systems Market Estimates and Forecasts, by Process (2020-2032) (USD Billion)
11.4.10.3 South Korea Zero Liquid Discharge Systems Market Estimates and Forecasts, by Technology (2020-2032) (USD Billion)
11.4.10.4 South Korea Zero Liquid Discharge Systems Market Estimates and Forecasts, by End-use Industry (2020-2032) (USD Billion)
11.4.11 Vietnam
11.4.11.1 Vietnam Zero Liquid Discharge Systems Market Estimates and Forecasts, by System (2020-2032) (USD Billion)
11.4.11.2 Vietnam Zero Liquid Discharge Systems Market Estimates and Forecasts, by Process (2020-2032) (USD Billion)
11.4.11.3 Vietnam Zero Liquid Discharge Systems Market Estimates and Forecasts, by Technology (2020-2032) (USD Billion)
11.4.11.4 Vietnam Zero Liquid Discharge Systems Market Estimates and Forecasts, by End-use Industry (2020-2032) (USD Billion)
11.4.12 Singapore
11.4.12.1 Singapore Zero Liquid Discharge Systems Market Estimates and Forecasts, by System (2020-2032) (USD Billion)
11.4.12.2 Singapore Zero Liquid Discharge Systems Market Estimates and Forecasts, by Process (2020-2032) (USD Billion)
11.4.12.3 Singapore Zero Liquid Discharge Systems Market Estimates and Forecasts, by Technology (2020-2032) (USD Billion)
11.4.12.4 Singapore Zero Liquid Discharge Systems Market Estimates and Forecasts, by End-use Industry (2020-2032) (USD Billion)
11.4.13 Australia
11.4.13.1 Australia Zero Liquid Discharge Systems Market Estimates and Forecasts, by System (2020-2032) (USD Billion)
11.4.13.2 Australia Zero Liquid Discharge Systems Market Estimates and Forecasts, by Process (2020-2032) (USD Billion)
11.4.13.3 Australia Zero Liquid Discharge Systems Market Estimates and Forecasts, by Technology (2020-2032) (USD Billion)
11.4.13.4 Australia Zero Liquid Discharge Systems Market Estimates and Forecasts, by End-use Industry (2020-2032) (USD Billion)
11.4.14 Rest of Asia Pacific
11.4.14.1 Rest of Asia Pacific Zero Liquid Discharge Systems Market Estimates and Forecasts, by System (2020-2032) (USD Billion)
11.4.14.2 Rest of Asia Pacific Zero Liquid Discharge Systems Market Estimates and Forecasts, by Process (2020-2032) (USD Billion)
11.4.14.3 Rest of Asia Pacific Zero Liquid Discharge Systems Market Estimates and Forecasts, by Technology (2020-2032) (USD Billion)
11.4.14.4 Rest of Asia Pacific Zero Liquid Discharge Systems Market Estimates and Forecasts, by End-use Industry (2020-2032) (USD Billion)
11.5 Middle East and Africa
11.5.1 Middle East
11.5.1.1 Trends Analysis
11.5.1.2 Middle East Zero Liquid Discharge Systems Market Estimates and Forecasts, by Country (2020-2032) (USD Billion)
11.5.1.3 Middle East Zero Liquid Discharge Systems Market Estimates and Forecasts, by System (2020-2032) (USD Billion)
11.5.1.4 Middle East Zero Liquid Discharge Systems Market Estimates and Forecasts, by Process (2020-2032) (USD Billion)
11.5.1.5 Middle East Zero Liquid Discharge Systems Market Estimates and Forecasts, by Technology (2020-2032) (USD Billion)
11.5.1.6 Middle East Zero Liquid Discharge Systems Market Estimates and Forecasts, by End-use Industry (2020-2032) (USD Billion)
11.5.1.7 UAE
11.5.1.7.1 UAE Zero Liquid Discharge Systems Market Estimates and Forecasts, by System (2020-2032) (USD Billion)
11.5.1.7.2 UAE Zero Liquid Discharge Systems Market Estimates and Forecasts, by Process (2020-2032) (USD Billion)
11.5.1.7.3 UAE Zero Liquid Discharge Systems Market Estimates and Forecasts, by Technology (2020-2032) (USD Billion)
11.5.1.7.4 UAE Zero Liquid Discharge Systems Market Estimates and Forecasts, by End-use Industry (2020-2032) (USD Billion)
11.5.1.8 Egypt
11.5.1.8.1 Egypt Zero Liquid Discharge Systems Market Estimates and Forecasts, by System (2020-2032) (USD Billion)
11.5.1.8.2 Egypt Zero Liquid Discharge Systems Market Estimates and Forecasts, by Process (2020-2032) (USD Billion)
11.5.1.8.3 Egypt Zero Liquid Discharge Systems Market Estimates and Forecasts, by Technology (2020-2032) (USD Billion)
11.5.1.8.4 Egypt Zero Liquid Discharge Systems Market Estimates and Forecasts, by End-use Industry (2020-2032) (USD Billion)
11.5.1.9 Saudi Arabia
11.5.1.9.1 Saudi Arabia Zero Liquid Discharge Systems Market Estimates and Forecasts, by System (2020-2032) (USD Billion)
11.5.1.9.2 Saudi Arabia Zero Liquid Discharge Systems Market Estimates and Forecasts, by Process (2020-2032) (USD Billion)
11.5.1.9.3 Saudi Arabia Zero Liquid Discharge Systems Market Estimates and Forecasts, by Technology (2020-2032) (USD Billion)
11.5.1.9.4 Saudi Arabia Zero Liquid Discharge Systems Market Estimates and Forecasts, by End-use Industry (2020-2032) (USD Billion)
11.5.1.10 Qatar
11.5.1.10.1 Qatar Zero Liquid Discharge Systems Market Estimates and Forecasts, by System (2020-2032) (USD Billion)
11.5.1.10.2 Qatar Zero Liquid Discharge Systems Market Estimates and Forecasts, by Process (2020-2032) (USD Billion)
11.5.1.10.3 Qatar Zero Liquid Discharge Systems Market Estimates and Forecasts, by Technology (2020-2032) (USD Billion)
11.5.1.10.4 Qatar Zero Liquid Discharge Systems Market Estimates and Forecasts, by End-use Industry (2020-2032) (USD Billion)
11.5.1.11 Rest of Middle East
11.5.1.11.1 Rest of Middle East Zero Liquid Discharge Systems Market Estimates and Forecasts, by System (2020-2032) (USD Billion)
11.5.1.11.2 Rest of Middle East Zero Liquid Discharge Systems Market Estimates and Forecasts, by Process (2020-2032) (USD Billion)
11.5.1.11.3 Rest of Middle East Zero Liquid Discharge Systems Market Estimates and Forecasts, by Technology (2020-2032) (USD Billion)
11.5.1.11.4 Rest of Middle East Zero Liquid Discharge Systems Market Estimates and Forecasts, by End-use Industry (2020-2032) (USD Billion)
11.5.2 Africa
11.5.2.1 Trends Analysis
11.5.2.2 Africa Zero Liquid Discharge Systems Market Estimates and Forecasts, by Country (2020-2032) (USD Billion)
11.5.2.3 Africa Zero Liquid Discharge Systems Market Estimates and Forecasts, by System (2020-2032) (USD Billion)
11.5.2.4 Africa Zero Liquid Discharge Systems Market Estimates and Forecasts, by Process (2020-2032) (USD Billion)
11.5.2.5 Africa Zero Liquid Discharge Systems Market Estimates and Forecasts, by Technology (2020-2032) (USD Billion)
11.5.2.6 Africa Zero Liquid Discharge Systems Market Estimates and Forecasts, by End-use Industry (2020-2032) (USD Billion)
11.5.2.7 South Africa
11.5.2.7.1 South Africa Zero Liquid Discharge Systems Market Estimates and Forecasts, by System (2020-2032) (USD Billion)
11.5.2.7.2 South Africa Zero Liquid Discharge Systems Market Estimates and Forecasts, by Process (2020-2032) (USD Billion)
11.5.2.7.3 South Africa Zero Liquid Discharge Systems Market Estimates and Forecasts, by Technology (2020-2032) (USD Billion)
11.5.2.7.4 South Africa Zero Liquid Discharge Systems Market Estimates and Forecasts, by End-use Industry (2020-2032) (USD Billion)
11.5.2.8 Nigeria
11.5.2.8.1 Nigeria Zero Liquid Discharge Systems Market Estimates and Forecasts, by System (2020-2032) (USD Billion)
11.5.2.8.2 Nigeria Zero Liquid Discharge Systems Market Estimates and Forecasts, by Process (2020-2032) (USD Billion)
11.5.2.8.3 Nigeria Zero Liquid Discharge Systems Market Estimates and Forecasts, by Technology (2020-2032) (USD Billion)
11.5.2.8.4 Nigeria Zero Liquid Discharge Systems Market Estimates and Forecasts, by End-use Industry (2020-2032) (USD Billion)
11.5.2.9 Rest of Africa
11.5.2.9.1 Rest of Africa Zero Liquid Discharge Systems Market Estimates and Forecasts, by System (2020-2032) (USD Billion)
11.5.2.9.2 Rest of Africa Zero Liquid Discharge Systems Market Estimates and Forecasts, by Process (2020-2032) (USD Billion)
11.5.2.9.3 Rest of Africa Zero Liquid Discharge Systems Market Estimates and Forecasts, by Technology (2020-2032) (USD Billion)
11.5.2.9.4 Rest of Africa Zero Liquid Discharge Systems Market Estimates and Forecasts, by End-use Industry (2020-2032) (USD Billion)
11.6 Latin America
11.6.1 Trends Analysis
11.6.2 Latin America Zero Liquid Discharge Systems Market Estimates and Forecasts, by Country (2020-2032) (USD Billion)
11.6.3 Latin America Zero Liquid Discharge Systems Market Estimates and Forecasts, by System (2020-2032) (USD Billion)
11.6.4 Latin America Zero Liquid Discharge Systems Market Estimates and Forecasts, by Process (2020-2032) (USD Billion)
11.6.5 Latin America Zero Liquid Discharge Systems Market Estimates and Forecasts, by Technology (2020-2032) (USD Billion)
11.6.6 Latin America Zero Liquid Discharge Systems Market Estimates and Forecasts, by End-use Industry (2020-2032) (USD Billion)
11.6.7 Brazil
11.6.7.1 Brazil Zero Liquid Discharge Systems Market Estimates and Forecasts, by System (2020-2032) (USD Billion)
11.6.7.2 Brazil Zero Liquid Discharge Systems Market Estimates and Forecasts, by Process (2020-2032) (USD Billion)
11.6.7.3 Brazil Zero Liquid Discharge Systems Market Estimates and Forecasts, by Technology (2020-2032) (USD Billion)
11.6.7.4 Brazil Zero Liquid Discharge Systems Market Estimates and Forecasts, by End-use Industry (2020-2032) (USD Billion)
11.6.8 Argentina
11.6.8.1 Argentina Zero Liquid Discharge Systems Market Estimates and Forecasts, by System (2020-2032) (USD Billion)
11.6.8.2 Argentina Zero Liquid Discharge Systems Market Estimates and Forecasts, by Process (2020-2032) (USD Billion)
11.6.8.3 Argentina Zero Liquid Discharge Systems Market Estimates and Forecasts, by Technology (2020-2032) (USD Billion)
11.6.8.4 Argentina Zero Liquid Discharge Systems Market Estimates and Forecasts, by End-use Industry (2020-2032) (USD Billion)
11.6.9 Colombia
11.6.9.1 Colombia Zero Liquid Discharge Systems Market Estimates and Forecasts, by System (2020-2032) (USD Billion)
11.6.9.2 Colombia Zero Liquid Discharge Systems Market Estimates and Forecasts, by Process (2020-2032) (USD Billion)
11.6.9.3 Colombia Zero Liquid Discharge Systems Market Estimates and Forecasts, by Technology (2020-2032) (USD Billion)
11.6.9.4 Colombia Zero Liquid Discharge Systems Market Estimates and Forecasts, by End-use Industry (2020-2032) (USD Billion)
11.6.10 Rest of Latin America
11.6.10.1 Rest of Latin America Zero Liquid Discharge Systems Market Estimates and Forecasts, by System (2020-2032) (USD Billion)
11.6.10.2 Rest of Latin America Zero Liquid Discharge Systems Market Estimates and Forecasts, by Process (2020-2032) (USD Billion)
11.6.10.3 Rest of Latin America Zero Liquid Discharge Systems Market Estimates and Forecasts, by Technology (2020-2032) (USD Billion)
11.6.10.4 Rest of Latin America Zero Liquid Discharge Systems Market Estimates and Forecasts, by End-use Industry (2020-2032) (USD Billion)
12. Company Profiles
12.1 Aquatech International LLC
12.1.1 Company Overview
12.1.2 Financial
12.1.3 Products/ Services Offered
12.1.4 SWOT Analysis
12.2 Alfa Laval
12.2.1 Company Overview
12.2.2 Financial
12.2.3 Products/ Services Offered
12.2.4 SWOT Analysis
12.3 Praj Industries
12.3.1 Company Overview
12.3.2 Financial
12.3.3 Products/ Services Offered
12.3.4 SWOT Analysis
12.4 H2O GmbH
12.4.1 Company Overview
12.4.2 Financial
12.4.3 Products/ Services Offered
12.4.4 SWOT Analysis
12.5 Evoqua Water Technologies
12.5.1 Company Overview
12.5.2 Financial
12.5.3 Products/ Services Offered
12.5.4 SWOT Analysis
12.6 GEA Group AG
12.6.1 Company Overview
12.6.2 Financial
12.6.3 Products/ Services Offered
12.6.4 SWOT Analysis
12.7 Veolia Water Technologies
12.7.1 Company Overview
12.7.2 Financial
12.7.3 Products/ Services Offered
12.7.4 SWOT Analysis
12.8 Thermax Limited
12.8.1 Company Overview
12.8.2 Financial
12.8.3 Products/ Services Offered
12.8.4 SWOT Analysis
12.9 GE Water & Process Technologies (now SUEZ)
12.9.1 Company Overview
12.9.2 Financial
12.9.3 Products/ Services Offered
12.9.4 SWOT Analysis
12.10 Aqua Filsep Inc.
12.10.1 Company Overview
12.10.2 Financial
12.10.3 Products/ Services Offered
12.10.4 SWOT Analysis
13. Use Cases and Best Practices
14. Conclusion
An accurate research report requires proper strategizing as well as implementation. There are multiple factors involved in the completion of good and accurate research report and selecting the best methodology to compete the research is the toughest part. Since the research reports we provide play a crucial role in any company’s decision-making process, therefore we at SNS Insider always believe that we should choose the best method which gives us results closer to reality. This allows us to reach at a stage wherein we can provide our clients best and accurate investment to output ratio.
Each report that we prepare takes a timeframe of 350-400 business hours for production. Starting from the selection of titles through a couple of in-depth brain storming session to the final QC process before uploading our titles on our website we dedicate around 350 working hours. The titles are selected based on their current market cap and the foreseen CAGR and growth.
The 5 steps process:
Step 1: Secondary Research:
Secondary Research or Desk Research is as the name suggests is a research process wherein, we collect data through the readily available information. In this process we use various paid and unpaid databases which our team has access to and gather data through the same. This includes examining of listed companies’ annual reports, Journals, SEC filling etc. Apart from this our team has access to various associations across the globe across different industries. Lastly, we have exchange relationships with various university as well as individual libraries.

Step 2: Primary Research
When we talk about primary research, it is a type of study in which the researchers collect relevant data samples directly, rather than relying on previously collected data. This type of research is focused on gaining content specific facts that can be sued to solve specific problems. Since the collected data is fresh and first hand therefore it makes the study more accurate and genuine.
We at SNS Insider have divided Primary Research into 2 parts.
Part 1 wherein we interview the KOLs of major players as well as the upcoming ones across various geographic regions. This allows us to have their view over the market scenario and acts as an important tool to come closer to the accurate market numbers. As many as 45 paid and unpaid primary interviews are taken from both the demand and supply side of the industry to make sure we land at an accurate judgement and analysis of the market.
This step involves the triangulation of data wherein our team analyses the interview transcripts, online survey responses and observation of on filed participants. The below mentioned chart should give a better understanding of the part 1 of the primary interview.

Part 2: In this part of primary research the data collected via secondary research and the part 1 of the primary research is validated with the interviews from individual consultants and subject matter experts.
Consultants are those set of people who have at least 12 years of experience and expertise within the industry whereas Subject Matter Experts are those with at least 15 years of experience behind their back within the same space. The data with the help of two main processes i.e., FGDs (Focused Group Discussions) and IDs (Individual Discussions). This gives us a 3rd party nonbiased primary view of the market scenario making it a more dependable one while collation of the data pointers.
Step 3: Data Bank Validation
Once all the information is collected via primary and secondary sources, we run that information for data validation. At our intelligence centre our research heads track a lot of information related to the market which includes the quarterly reports, the daily stock prices, and other relevant information. Our data bank server gets updated every fortnight and that is how the information which we collected using our primary and secondary information is revalidated in real time.

Step 4: QA/QC Process
After all the data collection and validation our team does a final level of quality check and quality assurance to get rid of any unwanted or undesired mistakes. This might include but not limited to getting rid of the any typos, duplication of numbers or missing of any important information. The people involved in this process include technical content writers, research heads and graphics people. Once this process is completed the title gets uploader on our platform for our clients to read it.
Step 5: Final QC/QA Process:
This is the last process and comes when the client has ordered the study. In this process a final QA/QC is done before the study is emailed to the client. Since we believe in giving our clients a good experience of our research studies, therefore, to make sure that we do not lack at our end in any way humanly possible we do a final round of quality check and then dispatch the study to the client.
Key Segments:
By System
Hybrid
Conventional
By Process
Pre-treatment
Filtration
Crystallization/Evaporation
By Technology
Membrane Based
Thermal Based
By End-use Industry
Energy & Power
Food & Beverages
Chemicals & Petrochemicals
Pharmaceutical
Textiles
Oil and Gas
Metallurgy & Mining
Others
Request for Segment Customization as per your Business Requirement: Segment Customization Request
Regional Coverage:
North America
US
Canada
Mexico
Europe
Eastern Europe
Poland
Romania
Hungary
Turkey
Rest of Eastern Europe
Western Europe
Germany
France
UK
Italy
Spain
Netherlands
Switzerland
Austria
Rest of Western Europe
Asia Pacific
China
India
Japan
South Korea
Vietnam
Singapore
Australia
Rest of Asia Pacific
Middle East & Africa
Middle East
UAE
Egypt
Saudi Arabia
Qatar
Rest of Middle East
Africa
Nigeria
South Africa
Rest of Africa
Latin America
Brazil
Argentina
Colombia
Rest of Latin America
Request for Country Level Research Report: Country Level Customization Request
Available Customization
With the given market data, SNS Insider offers customization as per the company’s specific needs. The following customization options are available for the report:
Detailed Volume Analysis
Criss-Cross segment analysis (e.g. Product X Application)
Competitive Product Benchmarking
Geographic Analysis
Additional countries in any of the regions
Customized Data Representation
Detailed analysis and profiling of additional market players
Ammonia Market size was USD 79.1 billion in 2023 and is expected to reach USD 121.5 billion by 2032 and grow at a CAGR of 4.9% from 2024 to 2032.
Bio-Based Chemicals Market was valued at USD 70.5 Billion in 2023 and is anticipated to touch USD 167.6 Billion by 2032, at a CAGR of 10.1% from 2024 to 2032.
Biaxially Oriented Polyethylene Terephthalate (BOPET) Films Market was at USD 16.7 Bn in 2023 and is expected to reach USD 28.4 Bn by 2032 at a CAGR of 6.1%.
The Polyurethane Sealants Market size was USD 3.22 Billion in 2023 and is expected to reach USD 4.68 Billion by 2032, at a CAGR of 4.23 % from 2024-2032.
Nitrogenous Fertilizer Market size was USD 63.55 Billion in 2023 and is expected to reach USD 105.36 Billion by 2032, growing at a CAGR of 5.78% from 2024-2032.
Collagen Peptides Market size was USD 683.9 Million in 2023 and is expected to reach USD 1118.20 Million by 2032, growing at a CAGR of 5.6% from 2024-2032.

Hi! Click one of our member below to chat on Phone
© 2025 All Rights Reserved by SNS Insider Pvt Ltd


