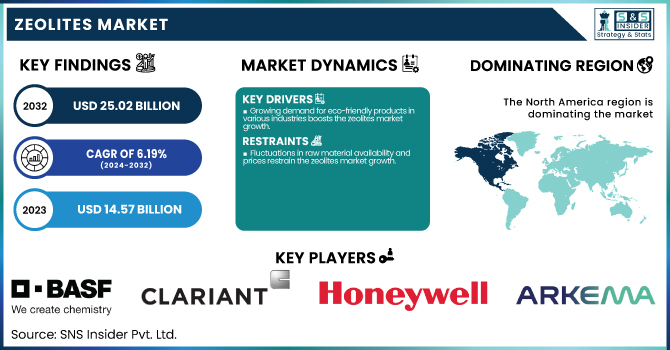
The Zeolites Market size was USD 14.57 billion in 2023 and is expected to reach USD 25.02 billion by 2032 and grow at a CAGR of 6.19% over the forecast period of 2024-2032. The report offers a comprehensive view of key industry dynamics through quantifiable metrics and regional analysis. This includes production capacity and utilization rates of natural and synthetic zeolites by country as of 2023, along with feedstock pricing trends such as alumina and silica. The report evaluates regulatory impacts on manufacturing and exports across major economies, highlighting shifts driven by environmental mandates. Emissions data and waste management practices are covered to assess sustainability initiatives by region. Additionally, it explores innovation and R&D investments focusing on catalyst applications and green chemistry. Adoption trends in zeolite-based software solutions and digital integration in quality control processes are also analyzed for operational efficiency.
The United States held the largest share in the Zeolites Market in 2023, with a market size of USD 3.88 billion, projected to reach USD 6.88 billion by 2032, growing at a CAGR of 6.59% during 2024–2032. This is because of its established industrial base, demand from end-use sectors, and leading manufacturer presence. Synthetic zeolites are widely used as catalysts and adsorbents in on-purpose fluid catalytic cracking (FCC) and gas separation processes in the country, which is well-known for its oil refining and petrochemical industry. Besides, the increasing focus on water treatment and environmental protection has driven zeolite demand in municipal and industrial wastewater applications. Incentives for the use of green & low emission products from regulatory bodies, including the U.S. Environmental Protection Agency (EPA) promoting eco-friendly products & materials, and respective approvals of zeolites have significantly urged their usage in the detergent industry. Strong investments in research and development (R&D), as well as aggressive technology advancements, are key direct benefits the U.S. can expect from zeolite commercialization, yielding non-particulate zeolite structures that are highly tailored for performance.
Drivers
Growing demand for eco-friendly products in various industries boosts the zeolites market growth.
The rising emphasis on environmental sustainability across key industries is significantly driving the demand for zeolites, particularly synthetic types. As eco-friendly alternatives to phosphates in detergents and environmentally responsible catalysts in petrochemical refining, zeolites are increasingly being adopted due to their non-toxic, recyclable, and biodegradable nature. Governments and environmental bodies, especially in North America and Europe, are tightening regulations on chemical emissions and phosphate use, further supporting the shift toward sustainable materials. In addition, industries such as water treatment, agriculture, and animal feed are utilizing natural zeolites for their ability to adsorb heavy metals, remove ammonia, and improve nutrient absorption. With growing awareness among manufacturers and consumers about environmental impacts, the zeolites market is poised to benefit from the shift toward greener, safer chemical solutions across a broad spectrum of industrial applications.
Restrain
Fluctuations in raw material availability and prices restrain the zeolites market growth.
The zeolites market is significantly affected by the volatile availability and pricing of essential raw materials, particularly alumina, silica, and kaolin. These materials are heavily influenced by mining activities, global trade dynamics, and environmental regulations, making their supply chain vulnerable to disruptions. Any restrictions in mining output or shifts in environmental compliance requirements, especially in major producing countries like China and India can lead to inconsistent raw material availability, affecting production capacity and operational efficiency. Additionally, fluctuations in energy prices, which directly impact synthetic zeolite manufacturing processes, further contribute to cost uncertainties. Smaller manufacturers often face challenges maintaining stable profit margins due to these variable input costs. Such fluctuations hinder strategic planning and long-term investments, especially in price-sensitive applications like detergent manufacturing or agriculture, thereby restraining the overall growth potential of the zeolites market.
Opportunity
Rising use of zeolites in emerging economies offers significant growth opportunities.
Emerging economies in Asia Pacific, Latin America, and the Middle East are witnessing a surge in infrastructure development, industrial expansion, and environmental awareness, all of which open new avenues for zeolites market growth. These regions are increasingly investing in wastewater treatment, refining operations, and sustainable agriculture, where both natural and synthetic zeolites play critical roles. The affordability and multi-functionality of zeolites make them particularly appealing in developing countries where cost-effective and environmentally friendly solutions are in high demand. Moreover, as governments in these regions implement stricter environmental norms and incentivize green technologies, the adoption of zeolites is expected to rise. Growing urbanization and population growth also contribute to increased detergent and animal feed consumption, further expanding the application base. As global players focus on expanding their manufacturing footprints and distribution networks in these markets, the growth potential becomes even more pronounced.
Challenge
Complex manufacturing processes and technical limitations pose challenges to market expansion.
The production of synthetic zeolites involves complex manufacturing processes, including hydrothermal synthesis under high-pressure and high-temperature conditions, requiring advanced technical know-how and significant capital investment. These processes must be precisely controlled to produce zeolites with uniform pore structures and desired ion-exchange capacities, which is crucial for high-performance applications such as petrochemical refining and gas separation. Additionally, scale-up from lab to industrial production can be difficult due to sensitivity to impurities and reaction conditions. Not all regions possess the technical infrastructure or expertise to manufacture high-quality zeolites consistently, leading to regional disparities in production quality and supply. Moreover, natural zeolites vary significantly in mineral composition depending on the source, which limits their uniform application across industries. These challenges increase dependency on a few specialized producers and constrain market expansion, especially in technologically underdeveloped or cost-sensitive regions.
By Product
The synthetic segment held the largest market share, around 75%, in 2023. It is due to several personal care formulations, including shampoos, body wash, facial cleansers, toothpaste, etc. Due to their primary role as cleansing agents, emulsifiers, and foaming agents, they are requirements in rinse-off and leave-on products. Surfactants are indispensable components that help change the surface properties of products; surfactants are extensively used in various daily-use products, owing to their high usage volume. Surfactant ingredients improve the texture of the product, ease and spread the ability of application, and overall benefit, thus contributing significantly to its overall market dominance. In addition, continuous developments in milder and bio-based surfactants due to increasing preference for skin-friendly and environmentally friendly products have additionally aided their extensive accessibility.
By Application
Catalysts held the largest market share, around 38%, in 2023. It can be attributed to their significant usage in the refining and petrochemical industries. The conversion of heavy crude oil, such as heavy fractions that yield little value, into interpretable lighter fractions (gasoline, diesel, and other petrochemical products) is traditionally carried out in fluid catalytic cracking (FCC) processes, in which zeolites are widely used as catalytic agents. Due to their unique porous structure, high surface area, and excellent ion-exchange capabilities, they provide an efficient and selective medium for chemical reactions. Rising consumption of clean fuel across the globe, especially in developed countries such as North America and Europe, has boosted the uptake of zeolite-based catalysts at the refinery level of production to comply with strict environmental regulations regarding the emissions of fuels.
Regional Analysis
North America held the largest market share, around 35%, in 2023. It is due to having a basic refining and petrochemical infrastructure, coupled with abundant demand for advanced catalytic materials, North America accounted for the largest market share in zeolites market. Some of the largest oil refineries and chemical manufacturing facilities in the world are located in the region, which depend significantly on zeolite-based catalysts for fluid catalytic cracking (FCC) and hydrocracking operations. Countries like the U.S. have even stricter environmental regulations, with agencies like the Environmental Protection Agency (EPA), increasing demand for cleaner fuel and the need to efficiently control emissions – applications that zeolites are used for. The presence of major market players like Albemarle Corporation and Honeywell UOP in the region also adds to the regional innovation, manufacturing capabilities, and supply chain for the same reason. Strong consumption of zeolites from residential and industrial sectors in North America is further driven by the increase in demand for water treatment solutions, detergents, and sustainable construction materials.
Asia Pacific held a significant market share. It is owing to rapid urbanization and flourishing infrastructure and industrialization in the region. The demand is driven by countries such as China and India and is coming from significant growth in sectors including petrochemicals, agriculture, water treatment, and construction. Zeolite-based catalysts are crucial because of zeolite requirements in catalytic processes, especially fluid catalytic cracking (FCC) and hydrocracking, which form a part of the region-specific large-scale industrial activities, such as refining and chemical production. On top of that, environmental regulations are on the rise in the Asia Pacific region, thus creating a demand for eco-friendly and efficient technologies, including zeolite-based materials for emission control, water purification, and sustainable agricultural practices. Higher disposable incomes and an expanding middle class in the region are also driving the increased use of zeolites in such applications as detergents and animal feed. Additionally, the presence of major zeolite producers, including Nippon Chemical Industrial Co.
BASF SE (Zeolite A, Sorbead)
Clariant (Zeoclear, Tonsil)
Honeywell International Inc. (UOP ZSM-5, UOP HX)
Arkema Group (Siliporite, Altuglas)
Albemarle Corporation (Zeocat, Filtrol)
W. R. Grace & Co. (SYLOBEAD, Dried Zeolite Powder)
Zeochem AG (ZEOflair, ZEOsphere)
Tosoh Corporation (HSZ-320, HSZ-960)
KNT Group (KNT Z10, KNT S7)
PQ Corporation (Zeolite 4A, Zeolite MAP)
Zeolyst International (CBV-28014, CBV-901)
Bear River Zeolite Company (Clinoptilolite, BRZ Zeolite)
Shijiazhuang Jianda High-Tech Chemical Co., Ltd. (JDZ-13X, JDZ-5A)
Interra Global Corporation (InterZeolite, IGZ-3A)
St. Cloud Mining Company (SCM Zeolite, Natural Zeolite Granules)
Blue Pacific Minerals (ZeoFert, Optimate Zeolite)
Rota Mining Corporation (EcoZeo, ZeoAgri)
Challs International Ltd. (PowerZeo, Challs-Z10)
Ningbo Jiahe New Materials Technology Co., Ltd. (Jiahe 13X, Jiahe ZSM-5)
Canadian Zeolite Corp. (Clinopure, ZeoGreen)
In March 2023, BASF introduced a new range of sustainable cosmetic active ingredients tailored to meet the growing demand in the clean beauty segment. Later, in September 2023, the company unveiled Epispot, a sustainably sourced ingredient specifically formulated to support skin clarity and boost confidence among individuals with blemish-prone skin.
In June 2023, Croda International Plc entered into a strategic partnership with RAHN AG. The collaboration focuses on the development of innovative, naturally derived cosmetic ingredients. This move aligns with growing consumer demand for sustainable and effective personal care solutions.
Report Attributes | Details |
Market Size in 2023 | USD 14.57 Billion |
Market Size by 2032 | USD25.02 Billion |
CAGR | CAGR of6.19 % From 2024 to 2032 |
Base Year | 2023 |
Forecast Period | 2024-2032 |
Historical Data | 2020-2022 |
Report Scope & Coverage | Market Size, Segments Analysis, Competitive Landscape, Regional Analysis, DROC & SWOT Analysis, Forecast Outlook |
Key Segments | •By Product (Natural, Synthetic) •By Application (Catalysts, Adsorbents, Detergent Builders, Cement, Animal Feed, Others) |
Regional Analysis/Coverage | North America (US, Canada, Mexico), Europe (Eastern Europe [Poland, Romania, Hungary, Turkey, Rest of Eastern Europe] Western Europe] Germany, France, UK, Italy, Spain, Netherlands, Switzerland, Austria, Rest of Western Europe]), Asia Pacific (China, India, Japan, South Korea, Vietnam, Singapore, Australia, Rest of Asia Pacific), Middle East & Africa (Middle East [UAE, Egypt, Saudi Arabia, Qatar, Rest of Middle East], Africa [Nigeria, South Africa, Rest of Africa], Latin America (Brazil, Argentina, Colombia, Rest of Latin America) |
Company Profiles | BASF SE, Clariant, Honeywell International Inc., Arkema Group, Albemarle Corporation, W. R. Grace & Co., Zeochem AG, Tosoh Corporation, KNT Group, PQ Corporation, Zeolyst International, Bear River Zeolite Company, Shijiazhuang Jianda High-Tech Chemical Co., Ltd., Interra Global Corporation, St. Cloud Mining Company, Blue Pacific Minerals, Rota Mining Corporation, Challs International Ltd., Ningbo Jiahe New Materials Technology Co., Ltd., Canadian Zeolite Corp. |
Ans: The Zeolites Market was valued at USD 14.57 billion in 2023.
Ans: The expected CAGR of the global Zeolites Market during the forecast period is 6.19%
Ans: The Synthetic segment will grow rapidly in the Zeolites Market from 2024 to 2032.
Ans: The growing demand for eco-friendly products in various industries boosts the zeolites market growth.
Ans: North America led the Zeolites Market in the region with the highest revenue share in 2023.
Table of Content
1. Introduction
1.1 Market Definition
1.2 Scope (Inclusion and Exclusions)
1.3 Research Assumptions
2. Executive Summary
2.1 Market Overview
2.2 Regional Synopsis
2.3 Competitive Summary
3. Research Methodology
3.1 Top-Down Approach
3.2 Bottom-up Approach
3.3. Data Validation
3.4 Primary Interviews
4. Market Dynamics Impact Analysis
4.1 Market Driving Factors Analysis
4.1.2 Drivers
4.1.2 Restraints
4.1.3 Opportunities
4.1.4 Challenges
4.2 PESTLE Analysis
4.3 Porter’s Five Forces Model
5. Statistical Insights and Trends Reporting
5.1 Production Capacity and Utilization by Country, By Type, 2023
5.2 Feedstock Prices by Country, and Type, 2023
5.3 Regulatory Impact by Country and By Type 2023.
5.4 Environmental Metrics: Emissions Data, Waste Management Practices, and Sustainability Initiatives by Region
5.5 Innovation and R&D, Type, 2023
6. Competitive Landscape
6.1 List of Major Companies By Region
6.2 Market Share Analysis By Region
6.3 Product Benchmarking
6.3.1 Product specifications and features
6.3.2 Pricing
6.4 Strategic Initiatives
6.4.1 Marketing and promotional activities
6.4.2 Distribution and Supply Chain Strategies
6.4.3 Expansion Plans and New Product Launches
6.4.4 Strategic partnerships and collaborations
6.5 Technological Advancements
6.6 Market Positioning and Branding
7. Zeolites Market Segmentation By Product
7.1 Chapter Overview
7.2 Natural
7.2.1 Natural Trend Analysis (2020-2032)
7.2.2 Natural Market Size Estimates and Forecasts to 2032 (USD Billion)
7.3 Synthetic
7.3.1 Synthetic Market Trends Analysis (2020-2032)
7.3.2 Synthetic Market Size Estimates and Forecasts to 2032 (USD Billion)
8. Zeolites Market Segmentation By Application
8.1 Chapter Overview
8.2 Catalysts
8.2.1 Catalysts Market Trends Analysis (2020-2032)
8.2.2 Catalysts Market Size Estimates and Forecasts to 2032 (USD Billion)
8.3 Adsorbents
8.3.1 Adsorbents Market Trends Analysis (2020-2032)
8.3.2 Adsorbents Market Size Estimates and Forecasts to 2032 (USD Billion)
8.4 Detergent Builders
8.4.1 Detergent Builders Market Trends Analysis (2020-2032)
8.4.2 Detergent Builders Market Size Estimates and Forecasts to 2032 (USD Billion)
8.5 Cement
8.5.1 Cement Market Trends Analysis (2020-2032)
8.5.2 Cement Market Size Estimates and Forecasts to 2032 (USD Billion)
8.6 Animal Feed
8.6.1 Animal Feed Market Trends Analysis (2020-2032)
8.6.2 Animal Feed Market Size Estimates and Forecasts to 2032 (USD Billion)
8.7 Others
8.7.1 Others Market Trends Analysis (2020-2032)
8.7.2 Others Market Size Estimates and Forecasts to 2032 (USD Billion)
9. Regional Analysis
9.1 Chapter Overview
9.2 North America
9.2.1 Trends Analysis
9.2.2 North America Zeolites Market Estimates and Forecasts, by Country (2020-2032) (USD Billion)
9.2.3 North America Zeolites Market Estimates and Forecasts, By Product (2020-2032) (USD Billion)
9.2.4 North America Zeolites Market Estimates and Forecasts, By Application (2020-2032) (USD Billion)
9.2.5 USA
9.2.5.1 USA Zeolites Market Estimates and Forecasts, By Product (2020-2032) (USD Billion)
9.2.5.2 USA Zeolites Market Estimates and Forecasts, By Application (2020-2032) (USD Billion)
9.2.6 Canada
9.2.6.1 Canada Zeolites Market Estimates and Forecasts, By Product (2020-2032) (USD Billion)
9.2.6.2 Canada Zeolites Market Estimates and Forecasts, By Application (2020-2032) (USD Billion)
9.2.7 Mexico
9.2.7.1 Mexico Zeolites Market Estimates and Forecasts, By Product (2020-2032) (USD Billion)
9.2.7.2 Mexico Zeolites Market Estimates and Forecasts, By Application (2020-2032) (USD Billion)
9.3 Europe
9.3.1 Eastern Europe
9.3.1.1 Trends Analysis
9.3.1.2 Eastern Europe Zeolites Market Estimates and Forecasts, by Country (2020-2032) (USD Billion)
9.3.1.3 Eastern Europe Zeolites Market Estimates and Forecasts, By Product (2020-2032) (USD Billion)
9.3.1.4 Eastern Europe Zeolites Market Estimates and Forecasts, By Application (2020-2032) (USD Billion)
9.3.1.5 Poland
9.3.1.5.1 Poland Zeolites Market Estimates and Forecasts, By Product (2020-2032) (USD Billion)
9.3.1.5.2 Poland Zeolites Market Estimates and Forecasts, By Application (2020-2032) (USD Billion)
9.3.1.6 Romania
9.3.1.6.1 Romania Zeolites Market Estimates and Forecasts, By Product (2020-2032) (USD Billion)
9.3.1.6.2 Romania Zeolites Market Estimates and Forecasts, By Application (2020-2032) (USD Billion)
9.3.1.7 Hungary
9.3.1.7.1 Hungary Zeolites Market Estimates and Forecasts, By Product (2020-2032) (USD Billion)
9.3.1.7.2 Hungary Zeolites Market Estimates and Forecasts, By Application (2020-2032) (USD Billion)
9.3.1.8 Turkey
9.3.1.8.1 Turkey Zeolites Market Estimates and Forecasts, By Product (2020-2032) (USD Billion)
9.3.1.8.2 Turkey Zeolites Market Estimates and Forecasts, By Application (2020-2032) (USD Billion)
9.3.1.9 Rest of Eastern Europe
9.3.1.9.1 Rest of Eastern Europe Zeolites Market Estimates and Forecasts, By Product (2020-2032) (USD Billion)
9.3.1.9.2 Rest of Eastern Europe Zeolites Market Estimates and Forecasts, By Application (2020-2032) (USD Billion)
9.3.2 Western Europe
9.3.2.1 Trends Analysis
9.3.2.2 Western Europe Zeolites Market Estimates and Forecasts, by Country (2020-2032) (USD Billion)
9.3.2.3 Western Europe Zeolites Market Estimates and Forecasts, By Product (2020-2032) (USD Billion)
9.3.2.4 Western Europe Zeolites Market Estimates and Forecasts, By Application (2020-2032) (USD Billion)
9.3.2.5 Germany
9.3.2.5.1 Germany Zeolites Market Estimates and Forecasts, By Product (2020-2032) (USD Billion)
9.3.2.5.2 Germany Zeolites Market Estimates and Forecasts, By Application (2020-2032) (USD Billion)
9.3.2.6 France
9.3.2.6.1 France Zeolites Market Estimates and Forecasts, By Product (2020-2032) (USD Billion)
9.3.2.6.2 France Zeolites Market Estimates and Forecasts, By Application (2020-2032) (USD Billion)
9.3.2.7 UK
9.3.2.7.1 UK Zeolites Market Estimates and Forecasts, By Product (2020-2032) (USD Billion)
9.3.2.7.2 UK Zeolites Market Estimates and Forecasts, By Application (2020-2032) (USD Billion)
9.3.2.8 Italy
9.3.2.8.1 Italy Zeolites Market Estimates and Forecasts, By Product (2020-2032) (USD Billion)
9.3.2.8.2 Italy Zeolites Market Estimates and Forecasts, By Application (2020-2032) (USD Billion)
9.3.2.9 Spain
9.3.2.9.1 Spain Zeolites Market Estimates and Forecasts, By Product (2020-2032) (USD Billion)
9.3.2.9.2 Spain Zeolites Market Estimates and Forecasts, By Application (2020-2032) (USD Billion)
9.3.2.10 Netherlands
9.3.2.10.1 Netherlands Zeolites Market Estimates and Forecasts, By Product (2020-2032) (USD Billion)
9.3.2.10.2 Netherlands Zeolites Market Estimates and Forecasts, By Application (2020-2032) (USD Billion)
9.3.2.11 Switzerland
9.3.2.11.1 Switzerland Zeolites Market Estimates and Forecasts, By Product (2020-2032) (USD Billion)
9.3.2.11.2 Switzerland Zeolites Market Estimates and Forecasts, By Application (2020-2032) (USD Billion)
9.3.2.12 Austria
9.3.2.12.1 Austria Zeolites Market Estimates and Forecasts, By Product (2020-2032) (USD Billion)
9.3.2.12.2 Austria Zeolites Market Estimates and Forecasts, By Application (2020-2032) (USD Billion)
9.3.2.13 Rest of Western Europe
9.3.2.13.1 Rest of Western Europe Zeolites Market Estimates and Forecasts, By Product (2020-2032) (USD Billion)
9.3.2.13.2 Rest of Western Europe Zeolites Market Estimates and Forecasts, By Application (2020-2032) (USD Billion)
9.4 Asia Pacific
9.4.1 Trends Analysis
9.4.2 Asia Pacific Zeolites Market Estimates and Forecasts, by Country (2020-2032) (USD Billion)
9.4.3 Asia Pacific Zeolites Market Estimates and Forecasts, By Product (2020-2032) (USD Billion)
9.4.4 Asia Pacific Zeolites Market Estimates and Forecasts, By Application (2020-2032) (USD Billion)
9.4.5 China
9.4.5.1 China Zeolites Market Estimates and Forecasts, By Product (2020-2032) (USD Billion)
9.4.5.2 China Zeolites Market Estimates and Forecasts, By Application (2020-2032) (USD Billion)
9.4.6 India
9.4.5.1 India Zeolites Market Estimates and Forecasts, By Product (2020-2032) (USD Billion)
9.4.5.2 India Zeolites Market Estimates and Forecasts, By Application (2020-2032) (USD Billion)
9.4.5 Japan
9.4.5.1 Japan Zeolites Market Estimates and Forecasts, By Product (2020-2032) (USD Billion)
9.4.5.2 Japan Zeolites Market Estimates and Forecasts, By Application (2020-2032) (USD Billion)
9.4.6 South Korea
9.4.6.1 South Korea Zeolites Market Estimates and Forecasts, By Product (2020-2032) (USD Billion)
9.4.6.2 South Korea Zeolites Market Estimates and Forecasts, By Application (2020-2032) (USD Billion)
9.4.7 Vietnam
9.4.7.1 Vietnam Zeolites Market Estimates and Forecasts, By Product (2020-2032) (USD Billion)
9.2.7.2 Vietnam Zeolites Market Estimates and Forecasts, By Application (2020-2032) (USD Billion)
9.4.8 Singapore
9.4.8.1 Singapore Zeolites Market Estimates and Forecasts, By Product (2020-2032) (USD Billion)
9.4.8.2 Singapore Zeolites Market Estimates and Forecasts, By Application (2020-2032) (USD Billion)
9.4.9 Australia
9.4.9.1 Australia Zeolites Market Estimates and Forecasts, By Product (2020-2032) (USD Billion)
9.4.9.2 Australia Zeolites Market Estimates and Forecasts, By Application (2020-2032) (USD Billion)
9.4.10 Rest of Asia Pacific
9.4.10.1 Rest of Asia Pacific Zeolites Market Estimates and Forecasts, By Product (2020-2032) (USD Billion)
9.4.10.2 Rest of Asia Pacific Zeolites Market Estimates and Forecasts, By Application (2020-2032) (USD Billion)
9.5 Middle East and Africa
9.5.1 Middle East
9.5.1.1 Trends Analysis
9.5.1.2 Middle East Zeolites Market Estimates and Forecasts, by Country (2020-2032) (USD Billion)
9.5.1.3 Middle East Zeolites Market Estimates and Forecasts, By Product (2020-2032) (USD Billion)
9.5.1.4 Middle East Zeolites Market Estimates and Forecasts, By Application (2020-2032) (USD Billion)
9.5.1.5 UAE
9.5.1.5.1 UAE Zeolites Market Estimates and Forecasts, By Product (2020-2032) (USD Billion)
9.5.1.5.2 UAE Zeolites Market Estimates and Forecasts, By Application (2020-2032) (USD Billion)
9.5.1.6 Egypt
9.5.1.6.1 Egypt Zeolites Market Estimates and Forecasts, By Product (2020-2032) (USD Billion)
9.5.1.6.2 Egypt Zeolites Market Estimates and Forecasts, By Application (2020-2032) (USD Billion)
9.5.1.7 Saudi Arabia
9.5.1.7.1 Saudi Arabia Zeolites Market Estimates and Forecasts, By Product (2020-2032) (USD Billion)
9.5.1.7.2 Saudi Arabia Zeolites Market Estimates and Forecasts, By Application (2020-2032) (USD Billion)
9.5.1.8 Qatar
9.5.1.8.1 Qatar Zeolites Market Estimates and Forecasts, By Product (2020-2032) (USD Billion)
9.5.1.8.2 Qatar Zeolites Market Estimates and Forecasts, By Application (2020-2032) (USD Billion)
9.5.1.9 Rest of Middle East
9.5.1.9.1 Rest of Middle East Zeolites Market Estimates and Forecasts, By Product (2020-2032) (USD Billion)
9.5.1.9.2 Rest of Middle East Zeolites Market Estimates and Forecasts, By Application (2020-2032) (USD Billion)
9.5.2 Africa
9.5.2.1 Trends Analysis
9.5.2.2 Africa Zeolites Market Estimates and Forecasts, by Country (2020-2032) (USD Billion)
9.5.2.3 Africa Zeolites Market Estimates and Forecasts, By Product (2020-2032) (USD Billion)
9.5.2.4 Africa Zeolites Market Estimates and Forecasts, By Application (2020-2032) (USD Billion)
9.5.2.5 South Africa
9.5.2.5.1 South Africa Zeolites Market Estimates and Forecasts, By Product (2020-2032) (USD Billion)
9.5.2.5.2 South Africa Zeolites Market Estimates and Forecasts, By Application (2020-2032) (USD Billion)
9.5.2.6 Nigeria
9.5.2.6.1 Nigeria Zeolites Market Estimates and Forecasts, By Product (2020-2032) (USD Billion)
9.5.2.6.2 Nigeria Zeolites Market Estimates and Forecasts, By Application (2020-2032) (USD Billion)
9.6 Latin America
9.6.1 Trends Analysis
9.6.2 Latin America Zeolites Market Estimates and Forecasts, by Country (2020-2032) (USD Billion)
9.6.3 Latin America Zeolites Market Estimates and Forecasts, By Product (2020-2032) (USD Billion)
9.6.4 Latin America Zeolites Market Estimates and Forecasts, By Application (2020-2032) (USD Billion)
9.6.5 Brazil
9.6.5.1 Brazil Zeolites Market Estimates and Forecasts, By Product (2020-2032) (USD Billion)
9.6.5.2 Brazil Zeolites Market Estimates and Forecasts, By Application (2020-2032) (USD Billion)
9.6.6 Argentina
9.6.6.1 Argentina Zeolites Market Estimates and Forecasts, By Product (2020-2032) (USD Billion)
9.6.6.2 Argentina Zeolites Market Estimates and Forecasts, By Application (2020-2032) (USD Billion)
9.6.7 Colombia
9.6.7.1 Colombia Zeolites Market Estimates and Forecasts, By Product (2020-2032) (USD Billion)
9.6.7.2 Colombia Zeolites Market Estimates and Forecasts, By Application (2020-2032) (USD Billion)
9.6.8 Rest of Latin America
9.6.8.1 Rest of Latin America Zeolites Market Estimates and Forecasts, By Product (2020-2032) (USD Billion)
9.6.8.2 Rest of Latin America Zeolites Market Estimates and Forecasts, By Application (2020-2032) (USD Billion)
10. Company Profiles
10.1 BASF SE
10.1.1 Company Overview
10.1.2 Financial
10.1.3 Product / Services Offered
10.1.4 SWOT Analysis
10.2 Clariant
10.2.1 Company Overview
10.2.2 Financial
10.2.3 Product/ Services Offered
10.2.4 SWOT Analysis
10.3 Honeywell International Inc.
10.3.1 Company Overview
10.3.2 Financial
10.3.3 Product/ Services Offered
10.3.4 SWOT Analysis
10.4 Arkema Group
10.4.1 Company Overview
10.4.2 Financial
10.4.3 Product/ Services Offered
10.4.4 SWOT Analysis
10.5 Albemarle Corporation
10.5.1 Company Overview
10.5.2 Financial
10.5.3 Product/ Services Offered
10.5.4 SWOT Analysis
10.6 W. R. Grace & Co.
10.6.1 Company Overview
10.6.2 Financial
10.6.3 Product/ Services Offered
10.6.4 SWOT Analysis
10.7 Zeochem AG
10.7.1 Company Overview
10.7.2 Financial
10.7.3 Product/ Services Offered
10.7.4 SWOT Analysis
10.8 Tosoh Corporation
10.8.1 Company Overview
10.8.2 Financial
10.8.3 Product/ Services Offered
10.8.4 SWOT Analysis
10.9 KNT Group
10.9.1 Company Overview
10.9.2 Financial
10.9.3 Product/ Services Offered
10.9.4 SWOT Analysis
10.10 PQ Corporation
10.10.1 Company Overview
10.10.2 Financial
10.10.3 Product/ Services Offered
10.10.4 SWOT Analysis
11. Use Cases and Best Practices
12. Conclusion
An accurate research report requires proper strategizing as well as implementation. There are multiple factors involved in the completion of good and accurate research report and selecting the best methodology to compete the research is the toughest part. Since the research reports we provide play a crucial role in any company’s decision-making process, therefore we at SNS Insider always believe that we should choose the best method which gives us results closer to reality. This allows us to reach at a stage wherein we can provide our clients best and accurate investment to output ratio.
Each report that we prepare takes a timeframe of 350-400 business hours for production. Starting from the selection of titles through a couple of in-depth brain storming session to the final QC process before uploading our titles on our website we dedicate around 350 working hours. The titles are selected based on their current market cap and the foreseen CAGR and growth.
The 5 steps process:
Step 1: Secondary Research:
Secondary Research or Desk Research is as the name suggests is a research process wherein, we collect data through the readily available information. In this process we use various paid and unpaid databases which our team has access to and gather data through the same. This includes examining of listed companies’ annual reports, Journals, SEC filling etc. Apart from this our team has access to various associations across the globe across different industries. Lastly, we have exchange relationships with various university as well as individual libraries.
Step 2: Primary Research
When we talk about primary research, it is a type of study in which the researchers collect relevant data samples directly, rather than relying on previously collected data. This type of research is focused on gaining content specific facts that can be sued to solve specific problems. Since the collected data is fresh and first hand therefore it makes the study more accurate and genuine.
We at SNS Insider have divided Primary Research into 2 parts.
Part 1 wherein we interview the KOLs of major players as well as the upcoming ones across various geographic regions. This allows us to have their view over the market scenario and acts as an important tool to come closer to the accurate market numbers. As many as 45 paid and unpaid primary interviews are taken from both the demand and supply side of the industry to make sure we land at an accurate judgement and analysis of the market.
This step involves the triangulation of data wherein our team analyses the interview transcripts, online survey responses and observation of on filed participants. The below mentioned chart should give a better understanding of the part 1 of the primary interview.
Part 2: In this part of primary research the data collected via secondary research and the part 1 of the primary research is validated with the interviews from individual consultants and subject matter experts.
Consultants are those set of people who have at least 12 years of experience and expertise within the industry whereas Subject Matter Experts are those with at least 15 years of experience behind their back within the same space. The data with the help of two main processes i.e., FGDs (Focused Group Discussions) and IDs (Individual Discussions). This gives us a 3rd party nonbiased primary view of the market scenario making it a more dependable one while collation of the data pointers.
Step 3: Data Bank Validation
Once all the information is collected via primary and secondary sources, we run that information for data validation. At our intelligence centre our research heads track a lot of information related to the market which includes the quarterly reports, the daily stock prices, and other relevant information. Our data bank server gets updated every fortnight and that is how the information which we collected using our primary and secondary information is revalidated in real time.
Step 4: QA/QC Process
After all the data collection and validation our team does a final level of quality check and quality assurance to get rid of any unwanted or undesired mistakes. This might include but not limited to getting rid of the any typos, duplication of numbers or missing of any important information. The people involved in this process include technical content writers, research heads and graphics people. Once this process is completed the title gets uploader on our platform for our clients to read it.
Step 5: Final QC/QA Process:
This is the last process and comes when the client has ordered the study. In this process a final QA/QC is done before the study is emailed to the client. Since we believe in giving our clients a good experience of our research studies, therefore, to make sure that we do not lack at our end in any way humanly possible we do a final round of quality check and then dispatch the study to the client.
Key Segments
By Product
Natural
Synthetic
By Application
Catalysts
Adsorbents
Detergent Builders
Cement
Animal Feed
Others
Request for Segment Customization as per your Business Requirement: Segment Customization Request
Regional Coverage:
North America
US
Canada
Mexico
Europe
Eastern Europe
Poland
Romania
Hungary
Turkey
Rest of Eastern Europe
Western Europe
Germany
France
UK
Italy
Spain
Netherlands
Switzerland
Austria
Rest of Western Europe
Asia Pacific
China
India
Japan
South Korea
Vietnam
Singapore
Australia
Rest of Asia Pacific
Middle East & Africa
Middle East
UAE
Egypt
Saudi Arabia
Qatar
Rest of Middle East
Africa
Nigeria
South Africa
Rest of Africa
Latin America
Brazil
Argentina
Colombia
Rest of Latin America
Request for Country Level Research Report: Country Level Customization Request
Available Customization
With the given market data, SNS Insider offers customization as per the company’s specific needs. The following customization options are available for the report:
Detailed Volume Analysis
Criss-Cross segment analysis (e.g. Product X Application)
Competitive Product Benchmarking
Geographic Analysis
Additional countries in any of the regions
Customized Data Representation
Detailed analysis and profiling of additional market players
The Atmospheric water generator Market size was USD 2.58 billion in 2023 and is expected to Reach USD 7.21 billion by 2032 and grow at a CAGR of 12.09% over the forecast period of 2024-2032.
The Automotive Adhesives Market size was USD 4.8 Billion in 2023 and is expected to reach USD 7.9 Billion by 2032 and grow at a CAGR of 5.8% by 2024-2032.
The Biorationals Market size was USD 1.24 Billion in 2023 and is expected to reach USD 2.67 Billion by 2032, growing at a CAGR of 8.90 % from 2024 to 2032.
The Bromelain Market Size was valued at USD 27.6 Million in 2023. It is expected to grow to USD 50.4 Million by 2032 and grow at a CAGR of 6.9% by 2024-2032.
The Advanced Glass Market was valued at USD 64.29 Billion in 2023 and is expected to reach USD 127.10 Billion by 2032, growing at a CAGR of 7.89% by 2024-2032.
Explore the Fatty Acids Market, covering key applications in food, pharmaceuticals, and cosmetics. Learn about the growing demand for omega-3, oleic acid, and stearic acid, and how advancements in sustainable sourcing are driving the market across various
Hi! Click one of our member below to chat on Phone