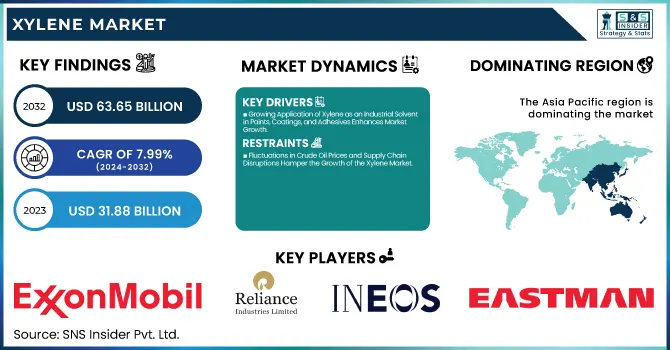
The Xylene Market Size was valued at USD 31.88 Billion in 2023 and is expected to reach USD 63.65 Billion by 2032, growing at a CAGR of 7.99% over the forecast period of 2024-2032.
The Xylene Market is evolving rapidly, driven by its demand in petrochemicals, paints & coatings, and adhesives. Our report explores key raw material availability and pricing trends, highlighting the impact of crude oil and naphtha costs on production. Leading companies are investing in expansion activities, reshaping competition. A detailed trade and export-import analysis reveal shifting global supply chains. Pricing analysis offers insights into historical trends and future projections. With sustainability concerns rising, Xylene substitutes and alternative chemicals are gaining attention. Additionally, a benchmarking study compares Xylene with other aromatic hydrocarbons, assessing its role in the broader chemical industry. Our research presents an exclusive, data-driven perspective on these crucial market dynamics.
Drivers
Growing Application of Xylene as an Industrial Solvent in Paints, Coatings, and Adhesives Enhances Market Growth
Xylene is widely used as an industrial solvent in paints, coatings, adhesives, and printing inks due to its excellent solvency properties and fast evaporation rate. The rapid expansion of the global construction industry, coupled with the rising demand for high-performance coatings and adhesives, is driving Xylene consumption. The automotive sector also heavily relies on Xylene-based coatings for enhancing vehicle durability and aesthetics. Furthermore, increasing urbanization and infrastructural developments in emerging economies have fueled the demand for paints and coatings, further propelling Xylene Market growth. The solvent’s compatibility with a broad range of polymers and resins makes it a preferred choice in multiple industries, reinforcing its market expansion.
Restraints
Fluctuations in Crude Oil Prices and Supply Chain Disruptions Hamper the Growth of the Xylene Market
Xylene production is highly dependent on crude oil-derived feedstocks, making it vulnerable to fluctuations in global crude oil prices. Volatile crude oil markets, influenced by geopolitical tensions, trade policies, and production cuts by major oil-producing nations, have a direct impact on Xylene pricing and profitability. Additionally, supply chain disruptions caused by factors such as transportation bottlenecks, port congestions, and raw material shortages further challenge market stability. These uncertainties create financial burdens on manufacturers, affecting production planning and investment decisions. Moreover, economic slowdowns and fluctuating demand from end-user industries exacerbate market volatility, posing a significant restraint to the Xylene Market’s steady growth.
Opportunities
Development of Bio-Based Xylene and Sustainable Alternatives Creates New Opportunities in the Xylene Market
With the rising emphasis on sustainability, chemical manufacturers are exploring bio-based alternatives to conventional petroleum-derived Xylene. The development of bio-Xylene, derived from renewable feedstocks such as biomass and plant-based sources, presents a promising opportunity for market growth. These sustainable alternatives align with global initiatives to reduce carbon footprints and promote green chemistry. Additionally, increasing investments in research and development for eco-friendly solvent formulations are expected to create new revenue streams. Regulatory support for bio-based chemicals and consumer preferences for sustainable products further accelerate the adoption of bio-Xylene, expanding its market potential in various industries.
Challenge
Fluctuating Demand from End-User Industries Due to Economic Uncertainties Poses a Challenge for the Xylene Market
The demand for Xylene is closely tied to industries such as petrochemicals, automotive, construction, and paints & coatings, all of which are influenced by economic cycles. During periods of economic downturns or slowdowns, reduced consumer spending and industrial activity lead to declining demand for Xylene-based products. Additionally, global trade tensions, inflationary pressures, and supply chain disruptions further impact market stability. Unpredictable economic conditions create uncertainty for manufacturers and investors, making long-term growth strategies challenging. Adapting to market fluctuations and diversifying applications remain critical for sustaining growth in the Xylene Market.
By Type
Mixed Xylene dominated the Xylene Market in 2023, accounting for 50.3% of the market share, primarily due to its extensive use in gasoline blending and as a precursor for various petrochemicals. The U.S. Energy Information Administration (EIA) and the International Energy Agency (IEA) have reported increasing gasoline consumption, particularly in Asia-Pacific, driving demand for Mixed Xylene as an octane booster. Additionally, China’s petrochemical expansion projects, including those by Sinopec and PetroChina, have significantly increased the demand for Mixed Xylene in para-Xylene production, which is further used in polyester manufacturing. Government investments in refinery expansions, such as India’s strategic petroleum refining projects, also contribute to Mixed Xylene’s dominance in the market.
By Application
The Solvents segment dominated the Xylene Market in 2023 with a 42.1% market share, driven by its extensive use in paints, coatings, adhesives, and printing inks. The growth of the construction and automotive industries, particularly in emerging economies, has fueled the demand for solvent-based coatings. Reports from the American Coatings Association (ACA) and the European Coatings Association highlight a steady increase in solvent demand due to rising infrastructure projects and industrial activities. Additionally, regulatory bodies like the U.S. Environmental Protection Agency (EPA) have permitted controlled solvent usage in key industrial applications, ensuring continued market growth.
By End-Use Industry
The Petrochemicals segment dominated the Xylene Market in 2023, holding a 35.6% market share, owing to the increasing demand for para-Xylene in polyester and plastic production. Organizations like the International Council of Chemical Associations (ICCA) and the American Chemistry Council (ACC) have reported significant investments in petrochemical expansions, particularly in Asia-Pacific and North America. China’s ambitious petrochemical capacity expansion, driven by state-owned enterprises like Sinopec, has led to a surge in Xylene consumption. Additionally, the Indian government's "Make in India" initiative has encouraged foreign investments in the petrochemical sector, further strengthening Xylene demand.
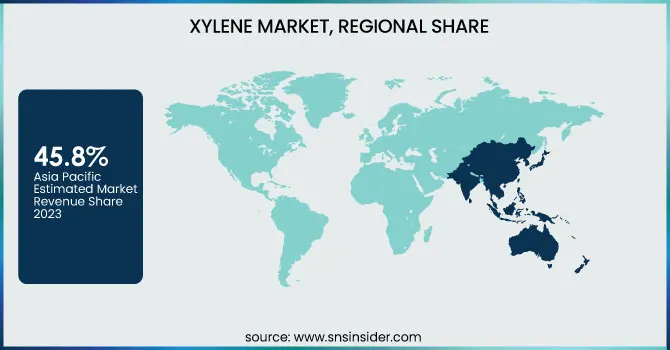
Asia Pacific dominated the Xylene Market in 2023, accounting for a 45.8% market share, primarily driven by the rapid expansion of the petrochemical and textile industries in countries like China, India, and Japan. China, as the world’s largest consumer of para-Xylene, has aggressively expanded its production capacity, with major investments from Sinopec and PetroChina. According to the China National Petroleum Corporation (CNPC), China’s para-Xylene capacity reached over 30 million metric tons in 2023 to meet the rising demand for polyester fiber and PET resin. India also significantly contributed to market growth, with Reliance Industries Limited operating one of the world’s largest para-Xylene production facilities in Jamnagar. Additionally, Japan’s well-established petrochemical sector, led by ENEOS Corporation and Mitsubishi Gas Chemical, has maintained steady Xylene demand for applications in coatings, adhesives, and high-performance plastics. Government initiatives and trade policies supporting industrial expansion and chemical production have further boosted regional production capacities and Xylene consumption, reinforcing Asia Pacific’s dominance in the market.
Moreover, North America emerged as the fastest-growing region in the Xylene Market during the forecast period, with a significant growth rate in the forecast period. The dominance is driven by increasing petrochemical investments and strong demand from the automotive and coatings industries. The United States is the key contributor, with companies like ExxonMobil and Chevron Phillips Chemical expanding their Xylene production to cater to the rising demand for gasoline blending and solvent applications. According to the American Chemistry Council (ACC), the U.S. petrochemical sector saw a surge in investments exceeding $200 billion in 2023, strengthening Xylene production and exports. Additionally, Mexico’s growing industrial sector and trade agreements such as the USMCA have accelerated Xylene demand for adhesives and paints. Canada’s chemical industry, supported by refineries like Suncor Energy and Imperial Oil, is also witnessing steady growth, enhancing the region’s market potential. The availability of cost-effective crude oil and natural gas further supports North America's Xylene market expansion.
Exxon Mobil Corporation (Mixed Xylene, Para-Xylene)
Reliance Industries Limited (Para-Xylene, Ortho-Xylene)
INEOS (Mixed Xylene, Ortho-Xylene)
Mitsubishi Gas Chemical Company, Inc. (Para-Xylene, Meta-Xylene)
CNPC (China National Petroleum Corporation) (Mixed Xylene, Para-Xylene)
Chevron Phillips Chemical Company (Mixed Xylene, Para-Xylene)
Eastman Chemical Company (Mixed Xylene, Ortho-Xylene)
Saudi Arabian Oil Co. (Saudi Aramco) (Para-Xylene, Ortho-Xylene)
China Petroleum & Chemical Corporation (Sinopec) (Para-Xylene, Ortho-Xylene)
TotalEnergies SE (Mixed Xylene, Para-Xylene)
Royal Dutch Shell plc (Mixed Xylene, Ortho-Xylene)
Indian Oil Corporation Ltd (Para-Xylene, Mixed Xylene)
ENEOS Corporation (Mixed Xylene, Para-Xylene)
SK geo centric Co., Ltd. (Para-Xylene, Ortho-Xylene)
S-Oil Corporation (Para-Xylene, Mixed Xylene)
GS Caltex Corporation (Para-Xylene, Ortho-Xylene)
Lotte Chemical Corporation (Para-Xylene, Mixed Xylene)
Marathon Petroleum Corporation (Mixed Xylene, Ortho-Xylene)
Sumitomo Chemical Company (Para-Xylene, Ortho-Xylene)
February 2024: ExxonMobil resumed paraxylene production at its Beaumont, Texas facility, contributing 12% of U.S. capacity. The decision was driven by rising fuel demand, especially in summer. Paraxylene is crucial for PET production used in packaging. Major U.S. producers include ExxonMobil, Flint Hills Resources, Indorama, and INEOS Aromatics
Report Attributes | Details |
---|---|
Market Size in 2023 | USD 31.88 Billion |
Market Size by 2032 | USD 63.65 Billion |
CAGR | CAGR of 7.99% From 2024 to 2032 |
Base Year | 2023 |
Forecast Period | 2024-2032 |
Historical Data | 2020-2022 |
Report Scope & Coverage | Market Size, Segments Analysis, Competitive Landscape, Regional Analysis, DROC & SWOT Analysis, Forecast Outlook |
Key Segments | •By Type (Ortho-Xylene, Meta-Xylene, Para-Xylene, Mixed Xylene) •By Application (Solvents, Monomers, Gasoline Blending, Others) •By End-use Industry (Petrochemicals, Paints & Coatings, Adhesives & Sealants, Automotive, Chemicals, Others) |
Regional Analysis/Coverage | North America (US, Canada, Mexico), Europe (Eastern Europe [Poland, Romania, Hungary, Turkey, Rest of Eastern Europe] Western Europe] Germany, France, UK, Italy, Spain, Netherlands, Switzerland, Austria, Rest of Western Europe]), Asia Pacific (China, India, Japan, South Korea, Vietnam, Singapore, Australia, Rest of Asia Pacific), Middle East & Africa (Middle East [UAE, Egypt, Saudi Arabia, Qatar, Rest of Middle East], Africa [Nigeria, South Africa, Rest of Africa], Latin America (Brazil, Argentina, Colombia, Rest of Latin America) |
Company Profiles | Exxon Mobil Corporation, Reliance Industries Limited, INEOS, Mitsubishi Gas Chemical Company, Inc., CNPC (China National Petroleum Corporation), Chevron Phillips Chemical Company, Eastman Chemical Company, Saudi Arabian Oil Co., China Petroleum & Chemical Corporation (Sinopec), TotalEnergies SE and other key players |
Ans: The Xylene Market was valued at USD 31.88 Billion in 2023.
Ans: The Xylene Market is projected to reach USD 63.65 Billion by 2032.
Ans: The Xylene Market is expected to grow at a CAGR of 7.99% during 2024-2032.
Ans: The Solvents segment dominated the Xylene Market in 2023 with a 42.1% share.
Ans: Asia Pacific dominated the Xylene Market in 2023 with a 45.8% share.
Table of Contents
1. Introduction
1.1 Market Definition
1.2 Scope (Inclusion and Exclusions)
1.3 Research Assumptions
2. Executive Summary
2.1 Market Overview
2.2 Regional Synopsis
2.3 Competitive Summary
3. Research Methodology
3.1 Top-Down Approach
3.2 Bottom-up Approach
3.3. Data Validation
3.4 Primary Interviews
4. Market Dynamics Impact Analysis
4.1 Market Driving Factors Analysis
4.1.1 Drivers
4.1.2 Restraints
4.1.3 Opportunities
4.1.4 Challenges
4.2 PESTLE Analysis
4.3 Porter’s Five Forces Model
5. Statistical Insights and Trends Reporting
5.1 Raw Material Availability & Pricing Trends
5.2 Investment and Expansion Activities of Market Leaders
5.3 Trade & Export-Import Analysis
5.4 Pricing Analysis
5.5 Xylene Substitutes & Alternative Chemicals
5.6 Benchmarking of Xylene in Different Chemical Markets
6. Competitive Landscape
6.1 List of Major Companies, By Region
6.2 Market Share Analysis, By Region
6.3 Product Benchmarking
6.3.1 Product specifications and features
6.3.2 Pricing
6.4 Strategic Initiatives
6.4.1 Marketing and promotional activities
6.4.2 Distribution and supply chain strategies
6.4.3 Expansion plans and new product launches
6.4.4 Strategic partnerships and collaborations
6.5 Technological Advancements
6.6 Market Positioning and Branding
7. Xylene Market Segmentation, by Type
7.1 Chapter Overview
7.2 Ortho-Xylene
7.2.1 Ortho-Xylene Market Trends Analysis (2020-2032)
7.2.2 Ortho-Xylene Market Size Estimates and Forecasts to 2032 (USD Billion)
7.3 Meta-Xylene
7.3.1 Meta-Xylene Market Trends Analysis (2020-2032)
7.3.2 Meta-Xylene Market Size Estimates and Forecasts to 2032 (USD Billion)
7.4 Para-Xylene
7.4.1 Para-Xylene Market Trends Analysis (2020-2032)
7.4.2 Para-Xylene Market Size Estimates and Forecasts to 2032 (USD Billion)
7.5 Mixed Xylene
7.5.1 Mixed Xylene Market Trends Analysis (2020-2032)
7.5.2 Mixed Xylene Market Size Estimates and Forecasts to 2032 (USD Billion)
8. Xylene Market Segmentation, by Application
8.1 Chapter Overview
8.2 Solvents
8.2.1 Solvents Market Trends Analysis (2020-2032)
8.2.2 Solvents Market Size Estimates and Forecasts to 2032 (USD Billion)
8.3 Monomers
8.3.1 Monomers Market Trends Analysis (2020-2032)
8.3.2 Monomers Market Size Estimates and Forecasts to 2032 (USD Billion)
8.4 Gasoline Blending
8.4.1 Gasoline Blending Market Trends Analysis (2020-2032)
8.4.2 Gasoline Blending Market Size Estimates and Forecasts to 2032 (USD Billion)
8.5 Others
8.5.1 Others Market Trends Analysis (2020-2032)
8.5.2 Others Market Size Estimates and Forecasts to 2032 (USD Billion)
9. Xylene Market Segmentation, by End-use Industry
9.1 Chapter Overview
9.2 Petrochemicals
9.2.1 Petrochemicals Market Trends Analysis (2020-2032)
9.2.2 Petrochemicals Market Size Estimates and Forecasts to 2032 (USD Billion)
9.3 Paints & Coatings
9.3.1 Paints & Coatings Market Trends Analysis (2020-2032)
9.3.2 Paints & Coatings Market Size Estimates and Forecasts to 2032 (USD Billion)
9.4 Adhesives & Sealants
9.4.1 Adhesives & Sealants Market Trends Analysis (2020-2032)
9.4.2 Adhesives & Sealants Market Size Estimates and Forecasts to 2032 (USD Billion)
9.5 Automotive
9.5.1 Automotive Market Trends Analysis (2020-2032)
9.5.2 Automotive Market Size Estimates and Forecasts to 2032 (USD Billion)
9.6 Chemicals
9.6.1 Chemicals Market Trends Analysis (2020-2032)
9.6.2 Chemicals Market Size Estimates and Forecasts to 2032 (USD Billion)
9.7 Others
9.7.1 Others Market Trends Analysis (2020-2032)
9.7.2 Others Market Size Estimates and Forecasts to 2032 (USD Billion)
10. Regional Analysis
10.1 Chapter Overview
10.2 North America
10.2.1 Trends Analysis
10.2.2 North America Xylene Market Estimates and Forecasts, by Country (2020-2032) (USD Billion)
10.2.3 North America Xylene Market Estimates and Forecasts, by Type (2020-2032) (USD Billion)
10.2.4 North America Xylene Market Estimates and Forecasts, by Application (2020-2032) (USD Billion)
10.2.5 North America Xylene Market Estimates and Forecasts, by End-use Industry (2020-2032) (USD Billion)
10.2.6 USA
10.2.6.1 USA Xylene Market Estimates and Forecasts, by Type (2020-2032) (USD Billion)
10.2.6.2 USA Xylene Market Estimates and Forecasts, by Application (2020-2032) (USD Billion)
10.2.6.3 USA Xylene Market Estimates and Forecasts, by End-use Industry (2020-2032) (USD Billion)
10.2.7 Canada
10.2.7.1 Canada Xylene Market Estimates and Forecasts, by Type (2020-2032) (USD Billion)
10.2.7.2 Canada Xylene Market Estimates and Forecasts, by Application (2020-2032) (USD Billion)
10.2.7.3 Canada Xylene Market Estimates and Forecasts, by End-use Industry (2020-2032) (USD Billion)
10.2.8 Mexico
10.2.8.1 Mexico Xylene Market Estimates and Forecasts, by Type (2020-2032) (USD Billion)
10.2.8.2 Mexico Xylene Market Estimates and Forecasts, by Application (2020-2032) (USD Billion)
10.2.8.3 Mexico Xylene Market Estimates and Forecasts, by End-use Industry (2020-2032) (USD Billion)
10.3 Europe
10.3.1 Eastern Europe
10.3.1.1 Trends Analysis
10.3.1.2 Eastern Europe Xylene Market Estimates and Forecasts, by Country (2020-2032) (USD Billion)
10.3.1.3 Eastern Europe Xylene Market Estimates and Forecasts, by Type (2020-2032) (USD Billion)
10.3.1.4 Eastern Europe Xylene Market Estimates and Forecasts, by Application (2020-2032) (USD Billion)
10.3.1.5 Eastern Europe Xylene Market Estimates and Forecasts, by End-use Industry (2020-2032) (USD Billion)
10.3.1.6 Poland
10.3.1.6.1 Poland Xylene Market Estimates and Forecasts, by Type (2020-2032) (USD Billion)
10.3.1.6.2 Poland Xylene Market Estimates and Forecasts, by Application (2020-2032) (USD Billion)
10.3.1.6.3 Poland Xylene Market Estimates and Forecasts, by End-use Industry (2020-2032) (USD Billion)
10.3.1.7 Romania
10.3.1.7.1 Romania Xylene Market Estimates and Forecasts, by Type (2020-2032) (USD Billion)
10.3.1.7.2 Romania Xylene Market Estimates and Forecasts, by Application (2020-2032) (USD Billion)
10.3.1.7.3 Romania Xylene Market Estimates and Forecasts, by End-use Industry (2020-2032) (USD Billion)
10.3.1.8 Hungary
10.3.1.8.1 Hungary Xylene Market Estimates and Forecasts, by Type (2020-2032) (USD Billion)
10.3.1.8.2 Hungary Xylene Market Estimates and Forecasts, by Application (2020-2032) (USD Billion)
10.3.1.8.3 Hungary Xylene Market Estimates and Forecasts, by End-use Industry (2020-2032) (USD Billion)
10.3.1.9 Turkey
10.3.1.9.1 Turkey Xylene Market Estimates and Forecasts, by Type (2020-2032) (USD Billion)
10.3.1.9.2 Turkey Xylene Market Estimates and Forecasts, by Application (2020-2032) (USD Billion)
10.3.1.9.3 Turkey Xylene Market Estimates and Forecasts, by End-use Industry (2020-2032) (USD Billion)
10.3.1.10 Rest of Eastern Europe
10.3.1.10.1 Rest of Eastern Europe Xylene Market Estimates and Forecasts, by Type (2020-2032) (USD Billion)
10.3.1.10.2 Rest of Eastern Europe Xylene Market Estimates and Forecasts, by Application (2020-2032) (USD Billion)
10.3.1.10.3 Rest of Eastern Europe Xylene Market Estimates and Forecasts, by End-use Industry (2020-2032) (USD Billion)
10.3.2 Western Europe
10.3.2.1 Trends Analysis
10.3.2.2 Western Europe Xylene Market Estimates and Forecasts, by Country (2020-2032) (USD Billion)
10.3.2.3 Western Europe Xylene Market Estimates and Forecasts, by Type (2020-2032) (USD Billion)
10.3.2.4 Western Europe Xylene Market Estimates and Forecasts, by Application (2020-2032) (USD Billion)
10.3.2.5 Western Europe Xylene Market Estimates and Forecasts, by End-use Industry (2020-2032) (USD Billion)
10.3.2.6 Germany
10.3.2.6.1 Germany Xylene Market Estimates and Forecasts, by Type (2020-2032) (USD Billion)
10.3.2.6.2 Germany Xylene Market Estimates and Forecasts, by Application (2020-2032) (USD Billion)
10.3.2.6.3 Germany Xylene Market Estimates and Forecasts, by End-use Industry (2020-2032) (USD Billion)
10.3.2.7 France
10.3.2.7.1 France Xylene Market Estimates and Forecasts, by Type (2020-2032) (USD Billion)
10.3.2.7.2 France Xylene Market Estimates and Forecasts, by Application (2020-2032) (USD Billion)
10.3.2.7.3 France Xylene Market Estimates and Forecasts, by End-use Industry (2020-2032) (USD Billion)
10.3.2.8 UK
10.3.2.8.1 UK Xylene Market Estimates and Forecasts, by Type (2020-2032) (USD Billion)
10.3.2.8.2 UK Xylene Market Estimates and Forecasts, by Application (2020-2032) (USD Billion)
10.3.2.8.3 UK Xylene Market Estimates and Forecasts, by End-use Industry (2020-2032) (USD Billion)
10.3.2.9 Italy
10.3.2.9.1 Italy Xylene Market Estimates and Forecasts, by Type (2020-2032) (USD Billion)
10.3.2.9.2 Italy Xylene Market Estimates and Forecasts, by Application (2020-2032) (USD Billion)
10.3.2.9.3 Italy Xylene Market Estimates and Forecasts, by End-use Industry (2020-2032) (USD Billion)
10.3.2.10 Spain
10.3.2.10.1 Spain Xylene Market Estimates and Forecasts, by Type (2020-2032) (USD Billion)
10.3.2.10.2 Spain Xylene Market Estimates and Forecasts, by Application (2020-2032) (USD Billion)
10.3.2.10.3 Spain Xylene Market Estimates and Forecasts, by End-use Industry (2020-2032) (USD Billion)
10.3.2.11 Netherlands
10.3.2.11.1 Netherlands Xylene Market Estimates and Forecasts, by Type (2020-2032) (USD Billion)
10.3.2.11.2 Netherlands Xylene Market Estimates and Forecasts, by Application (2020-2032) (USD Billion)
10.3.2.11.3 Netherlands Xylene Market Estimates and Forecasts, by End-use Industry (2020-2032) (USD Billion)
10.3.2.12 Switzerland
10.3.2.12.1 Switzerland Xylene Market Estimates and Forecasts, by Type (2020-2032) (USD Billion)
10.3.2.12.2 Switzerland Xylene Market Estimates and Forecasts, by Application (2020-2032) (USD Billion)
10.3.2.12.3 Switzerland Xylene Market Estimates and Forecasts, by End-use Industry (2020-2032) (USD Billion)
10.3.2.13 Austria
10.3.2.13.1 Austria Xylene Market Estimates and Forecasts, by Type (2020-2032) (USD Billion)
10.3.2.13.2 Austria Xylene Market Estimates and Forecasts, by Application (2020-2032) (USD Billion)
10.3.2.13.3 Austria Xylene Market Estimates and Forecasts, by End-use Industry (2020-2032) (USD Billion)
10.3.2.14 Rest of Western Europe
10.3.2.14.1 Rest of Western Europe Xylene Market Estimates and Forecasts, by Type (2020-2032) (USD Billion)
10.3.2.14.2 Rest of Western Europe Xylene Market Estimates and Forecasts, by Application (2020-2032) (USD Billion)
10.3.2.14.3 Rest of Western Europe Xylene Market Estimates and Forecasts, by End-use Industry (2020-2032) (USD Billion)
10.4 Asia Pacific
10.4.1 Trends Analysis
10.4.2 Asia Pacific Xylene Market Estimates and Forecasts, by Country (2020-2032) (USD Billion)
10.4.3 Asia Pacific Xylene Market Estimates and Forecasts, by Type (2020-2032) (USD Billion)
10.4.4 Asia Pacific Xylene Market Estimates and Forecasts, by Application (2020-2032) (USD Billion)
10.4.5 Asia Pacific Xylene Market Estimates and Forecasts, by End-use Industry (2020-2032) (USD Billion)
10.4.6 China
10.4.6.1 China Xylene Market Estimates and Forecasts, by Type (2020-2032) (USD Billion)
10.4.6.2 China Xylene Market Estimates and Forecasts, by Application (2020-2032) (USD Billion)
10.4.6.3 China Xylene Market Estimates and Forecasts, by End-use Industry (2020-2032) (USD Billion)
10.4.7 India
10.4.7.1 India Xylene Market Estimates and Forecasts, by Type (2020-2032) (USD Billion)
10.4.7.2 India Xylene Market Estimates and Forecasts, by Application (2020-2032) (USD Billion)
10.4.7.3 India Xylene Market Estimates and Forecasts, by End-use Industry (2020-2032) (USD Billion)
10.4.8 Japan
10.4.8.1 Japan Xylene Market Estimates and Forecasts, by Type (2020-2032) (USD Billion)
10.4.8.2 Japan Xylene Market Estimates and Forecasts, by Application (2020-2032) (USD Billion)
10.4.8.3 Japan Xylene Market Estimates and Forecasts, by End-use Industry (2020-2032) (USD Billion)
10.4.9 South Korea
10.4.9.1 South Korea Xylene Market Estimates and Forecasts, by Type (2020-2032) (USD Billion)
10.4.9.2 South Korea Xylene Market Estimates and Forecasts, by Application (2020-2032) (USD Billion)
10.4.9.3 South Korea Xylene Market Estimates and Forecasts, by End-use Industry (2020-2032) (USD Billion)
10.4.10 Vietnam
10.4.10.1 Vietnam Xylene Market Estimates and Forecasts, by Type (2020-2032) (USD Billion)
10.4.10.2 Vietnam Xylene Market Estimates and Forecasts, by Application (2020-2032) (USD Billion)
10.4.10.3 Vietnam Xylene Market Estimates and Forecasts, by End-use Industry (2020-2032) (USD Billion)
10.4.11 Singapore
10.4.11.1 Singapore Xylene Market Estimates and Forecasts, by Type (2020-2032) (USD Billion)
10.4.11.2 Singapore Xylene Market Estimates and Forecasts, by Application (2020-2032) (USD Billion)
10.4.11.3 Singapore Xylene Market Estimates and Forecasts, by End-use Industry (2020-2032) (USD Billion)
10.4.12 Australia
10.4.12.1 Australia Xylene Market Estimates and Forecasts, by Type (2020-2032) (USD Billion)
10.4.12.2 Australia Xylene Market Estimates and Forecasts, by Application (2020-2032) (USD Billion)
10.4.12.3 Australia Xylene Market Estimates and Forecasts, by End-use Industry (2020-2032) (USD Billion)
10.4.13 Rest of Asia Pacific
10.4.13.1 Rest of Asia Pacific Xylene Market Estimates and Forecasts, by Type (2020-2032) (USD Billion)
10.4.13.2 Rest of Asia Pacific Xylene Market Estimates and Forecasts, by Application (2020-2032) (USD Billion)
10.4.13.3 Rest of Asia Pacific Xylene Market Estimates and Forecasts, by End-use Industry (2020-2032) (USD Billion)
10.5 Middle East and Africa
10.5.1 Middle East
10.5.1.1 Trends Analysis
10.5.1.2 Middle East Xylene Market Estimates and Forecasts, by Country (2020-2032) (USD Billion)
10.5.1.3 Middle East Xylene Market Estimates and Forecasts, by Type (2020-2032) (USD Billion)
10.5.1.4 Middle East Xylene Market Estimates and Forecasts, by Application (2020-2032) (USD Billion)
10.5.1.5 Middle East Xylene Market Estimates and Forecasts, by End-use Industry (2020-2032) (USD Billion)
10.5.1.6 UAE
10.5.1.6.1 UAE Xylene Market Estimates and Forecasts, by Type (2020-2032) (USD Billion)
10.5.1.6.2 UAE Xylene Market Estimates and Forecasts, by Application (2020-2032) (USD Billion)
10.5.1.6.3 UAE Xylene Market Estimates and Forecasts, by End-use Industry (2020-2032) (USD Billion)
10.5.1.7 Egypt
10.5.1.7.1 Egypt Xylene Market Estimates and Forecasts, by Type (2020-2032) (USD Billion)
10.5.1.7.2 Egypt Xylene Market Estimates and Forecasts, by Application (2020-2032) (USD Billion)
10.5.1.7.3 Egypt Xylene Market Estimates and Forecasts, by End-use Industry (2020-2032) (USD Billion)
10.5.1.8 Saudi Arabia
10.5.1.8.1 Saudi Arabia Xylene Market Estimates and Forecasts, by Type (2020-2032) (USD Billion)
10.5.1.8.2 Saudi Arabia Xylene Market Estimates and Forecasts, by Application (2020-2032) (USD Billion)
10.5.1.8.3 Saudi Arabia Xylene Market Estimates and Forecasts, by End-use Industry (2020-2032) (USD Billion)
10.5.1.9 Qatar
10.5.1.9.1 Qatar Xylene Market Estimates and Forecasts, by Type (2020-2032) (USD Billion)
10.5.1.9.2 Qatar Xylene Market Estimates and Forecasts, by Application (2020-2032) (USD Billion)
10.5.1.9.3 Qatar Xylene Market Estimates and Forecasts, by End-use Industry (2020-2032) (USD Billion)
10.5.1.10 Rest of Middle East
10.5.1.10.1 Rest of Middle East Xylene Market Estimates and Forecasts, by Type (2020-2032) (USD Billion)
10.5.1.10.2 Rest of Middle East Xylene Market Estimates and Forecasts, by Application (2020-2032) (USD Billion)
10.5.1.10.3 Rest of Middle East Xylene Market Estimates and Forecasts, by End-use Industry (2020-2032) (USD Billion)
10.5.2 Africa
10.5.2.1 Trends Analysis
10.5.2.2 Africa Xylene Market Estimates and Forecasts, by Country (2020-2032) (USD Billion)
10.5.2.3 Africa Xylene Market Estimates and Forecasts, by Type (2020-2032) (USD Billion)
10.5.2.4 Africa Xylene Market Estimates and Forecasts, by Application (2020-2032) (USD Billion)
10.5.2.5 Africa Xylene Market Estimates and Forecasts, by End-use Industry (2020-2032) (USD Billion)
10.5.2.6 South Africa
10.5.2.6.1 South Africa Xylene Market Estimates and Forecasts, by Type (2020-2032) (USD Billion)
10.5.2.6.2 South Africa Xylene Market Estimates and Forecasts, by Application (2020-2032) (USD Billion)
10.5.2.6.3 South Africa Xylene Market Estimates and Forecasts, by End-use Industry (2020-2032) (USD Billion)
10.5.2.7 Nigeria
10.5.2.7.1 Nigeria Xylene Market Estimates and Forecasts, by Type (2020-2032) (USD Billion)
10.5.2.7.2 Nigeria Xylene Market Estimates and Forecasts, by Application (2020-2032) (USD Billion)
10.5.2.7.3 Nigeria Xylene Market Estimates and Forecasts, by End-use Industry (2020-2032) (USD Billion)
10.5.2.8 Rest of Africa
10.5.2.8.1 Rest of Africa Xylene Market Estimates and Forecasts, by Type (2020-2032) (USD Billion)
10.5.2.8.2 Rest of Africa Xylene Market Estimates and Forecasts, by Application (2020-2032) (USD Billion)
10.5.2.8.3 Rest of Africa Xylene Market Estimates and Forecasts, by End-use Industry (2020-2032) (USD Billion)
10.6 Latin America
10.6.1 Trends Analysis
10.6.2 Latin America Xylene Market Estimates and Forecasts, by Country (2020-2032) (USD Billion)
10.6.3 Latin America Xylene Market Estimates and Forecasts, by Type (2020-2032) (USD Billion)
10.6.4 Latin America Xylene Market Estimates and Forecasts, by Application (2020-2032) (USD Billion)
10.6.5 Latin America Xylene Market Estimates and Forecasts, by End-use Industry (2020-2032) (USD Billion)
10.6.6 Brazil
10.6.6.1 Brazil Xylene Market Estimates and Forecasts, by Type (2020-2032) (USD Billion)
10.6.6.2 Brazil Xylene Market Estimates and Forecasts, by Application (2020-2032) (USD Billion)
10.6.6.3 Brazil Xylene Market Estimates and Forecasts, by End-use Industry (2020-2032) (USD Billion)
10.6.7 Argentina
10.6.7.1 Argentina Xylene Market Estimates and Forecasts, by Type (2020-2032) (USD Billion)
10.6.7.2 Argentina Xylene Market Estimates and Forecasts, by Application (2020-2032) (USD Billion)
10.6.7.3 Argentina Xylene Market Estimates and Forecasts, by End-use Industry (2020-2032) (USD Billion)
10.6.8 Colombia
10.6.8.1 Colombia Xylene Market Estimates and Forecasts, by Type (2020-2032) (USD Billion)
10.6.8.2 Colombia Xylene Market Estimates and Forecasts, by Application (2020-2032) (USD Billion)
10.6.8.3 Colombia Xylene Market Estimates and Forecasts, by End-use Industry (2020-2032) (USD Billion)
10.6.9 Rest of Latin America
10.6.9.1 Rest of Latin America Xylene Market Estimates and Forecasts, by Type (2020-2032) (USD Billion)
10.6.9.2 Rest of Latin America Xylene Market Estimates and Forecasts, by Application (2020-2032) (USD Billion)
10.6.9.3 Rest of Latin America Xylene Market Estimates and Forecasts, by End-use Industry (2020-2032) (USD Billion)
11. Company Profiles
11.1 Exxon Mobil Corporation
11.1.1 Company Overview
11.1.2 Financial
11.1.3 Products/ Services Offered
11.1.4 SWOT Analysis
11.2 Reliance Industries Limited
11.2.1 Company Overview
11.2.2 Financial
11.2.3 Products/ Services Offered
11.2.4 SWOT Analysis
11.3 INEOS
11.3.1 Company Overview
11.3.2 Financial
11.3.3 Products/ Services Offered
11.3.4 SWOT Analysis
11.4 Mitsubishi Gas Chemical Company, Inc.
11.4.1 Company Overview
11.4.2 Financial
11.4.3 Products/ Services Offered
11.4.4 SWOT Analysis
11.5 CNPC (China National Petroleum Corporation)
11.5.1 Company Overview
11.5.2 Financial
11.5.3 Products/ Services Offered
11.5.4 SWOT Analysis
11.6 Chevron Phillips Chemical Company
11.6.1 Company Overview
11.6.2 Financial
11.6.3 Products/ Services Offered
11.6.4 SWOT Analysis
11.7 Chevron Phillips Chemical Company
11.7.1 Company Overview
11.7.2 Financial
11.7.3 Products/ Services Offered
11.7.4 SWOT Analysis
11.8 Saudi Arabian Oil Co.
11.8.1 Company Overview
11.8.2 Financial
11.8.3 Products/ Services Offered
11.8.4 SWOT Analysis
11.9 China Petroleum & Chemical Corporation (Sinopec)
11.9.1 Company Overview
11.9.2 Financial
11.9.3 Products/ Services Offered
11.9.4 SWOT Analysis
11.10 TotalEnergies SE
11.10.1 Company Overview
11.10.2 Financial
11.10.3 Products/ Services Offered
11.10.4 SWOT Analysis
12. Use Cases and Best Practices
13. Conclusion
An accurate research report requires proper strategizing as well as implementation. There are multiple factors involved in the completion of good and accurate research report and selecting the best methodology to compete the research is the toughest part. Since the research reports we provide play a crucial role in any company’s decision-making process, therefore we at SNS Insider always believe that we should choose the best method which gives us results closer to reality. This allows us to reach at a stage wherein we can provide our clients best and accurate investment to output ratio.
Each report that we prepare takes a timeframe of 350-400 business hours for production. Starting from the selection of titles through a couple of in-depth brain storming session to the final QC process before uploading our titles on our website we dedicate around 350 working hours. The titles are selected based on their current market cap and the foreseen CAGR and growth.
The 5 steps process:
Step 1: Secondary Research:
Secondary Research or Desk Research is as the name suggests is a research process wherein, we collect data through the readily available information. In this process we use various paid and unpaid databases which our team has access to and gather data through the same. This includes examining of listed companies’ annual reports, Journals, SEC filling etc. Apart from this our team has access to various associations across the globe across different industries. Lastly, we have exchange relationships with various university as well as individual libraries.
Step 2: Primary Research
When we talk about primary research, it is a type of study in which the researchers collect relevant data samples directly, rather than relying on previously collected data. This type of research is focused on gaining content specific facts that can be sued to solve specific problems. Since the collected data is fresh and first hand therefore it makes the study more accurate and genuine.
We at SNS Insider have divided Primary Research into 2 parts.
Part 1 wherein we interview the KOLs of major players as well as the upcoming ones across various geographic regions. This allows us to have their view over the market scenario and acts as an important tool to come closer to the accurate market numbers. As many as 45 paid and unpaid primary interviews are taken from both the demand and supply side of the industry to make sure we land at an accurate judgement and analysis of the market.
This step involves the triangulation of data wherein our team analyses the interview transcripts, online survey responses and observation of on filed participants. The below mentioned chart should give a better understanding of the part 1 of the primary interview.
Part 2: In this part of primary research the data collected via secondary research and the part 1 of the primary research is validated with the interviews from individual consultants and subject matter experts.
Consultants are those set of people who have at least 12 years of experience and expertise within the industry whereas Subject Matter Experts are those with at least 15 years of experience behind their back within the same space. The data with the help of two main processes i.e., FGDs (Focused Group Discussions) and IDs (Individual Discussions). This gives us a 3rd party nonbiased primary view of the market scenario making it a more dependable one while collation of the data pointers.
Step 3: Data Bank Validation
Once all the information is collected via primary and secondary sources, we run that information for data validation. At our intelligence centre our research heads track a lot of information related to the market which includes the quarterly reports, the daily stock prices, and other relevant information. Our data bank server gets updated every fortnight and that is how the information which we collected using our primary and secondary information is revalidated in real time.
Step 4: QA/QC Process
After all the data collection and validation our team does a final level of quality check and quality assurance to get rid of any unwanted or undesired mistakes. This might include but not limited to getting rid of the any typos, duplication of numbers or missing of any important information. The people involved in this process include technical content writers, research heads and graphics people. Once this process is completed the title gets uploader on our platform for our clients to read it.
Step 5: Final QC/QA Process:
This is the last process and comes when the client has ordered the study. In this process a final QA/QC is done before the study is emailed to the client. Since we believe in giving our clients a good experience of our research studies, therefore, to make sure that we do not lack at our end in any way humanly possible we do a final round of quality check and then dispatch the study to the client.
Key Segments:
By Type
Ortho-Xylene
Meta-Xylene
Para-Xylene
Mixed Xylene
By Application
Solvents
Monomers
Gasoline Blending
Others
By End-use Industry
Petrochemicals
Paints & Coatings
Adhesives & Sealants
Automotive
Chemicals
Others
Request for Segment Customization as per your Business Requirement: Segment Customization Request
Regional Coverage:
North America
US
Canada
Mexico
Europe
Eastern Europe
Poland
Romania
Hungary
Turkey
Rest of Eastern Europe
Western Europe
Germany
France
UK
Italy
Spain
Netherlands
Switzerland
Austria
Rest of Western Europe
Asia Pacific
China
India
Japan
South Korea
Vietnam
Singapore
Australia
Rest of Asia Pacific
Middle East & Africa
Middle East
UAE
Egypt
Saudi Arabia
Qatar
Rest of Middle East
Africa
Nigeria
South Africa
Rest of Africa
Latin America
Brazil
Argentina
Colombia
Rest of Latin America
Request for Country Level Research Report: Country Level Customization Request
Available Customization
With the given market data, SNS Insider offers customization as per the company’s specific needs. The following customization options are available for the report:
Detailed Volume Analysis
Criss-Cross segment analysis (e.g. Product X Application)
Competitive Product Benchmarking
Geographic Analysis
Additional countries in any of the regions
Customized Data Representation
Detailed analysis and profiling of additional market players
The Hybrid Sealants and Adhesives Market Size was valued at USD 8.10 billion in 2023 and is expected to reach USD 15.81 billion by 2032 and grow at a CAGR of 8.86% over the forecast period 2024-2032.
The Oxalic Acid Market size was valued at USD 962 million in 2023. It is estimated to hit USD 1475.97 million by 2032 and grow at a CAGR of 4.87% over the forecast period of 2024-2032.
Graphene Market Size was valued at USD 366.5 Million in 2023 and is expected to grow to USD 4997.1 Million by 2032, exhibiting a CAGR of 33.2% from 2024-2032.
Green Building Materials Market was USD 371.25 billion in 2023 and is expected to Reach USD 1020.53 billion by 2032, growing at a CAGR of 11.89% by 2024-2032.
The Paper Pigments Market Size was valued at USD 17.76 Billion in 2023 and is expected to reach USD 28.49 Billion by 2032, growing at a CAGR of 5.40% over the forecast period of 2024-2032.
The Long-chain Polyamide Market size was USD 2.1 billion in 2023 and is expected to reach USD 3.2 billion by 2032 and grow at a CAGR of 5.0% over the forecast period of 2024-2032.
Hi! Click one of our member below to chat on Phone