Get More Information on X-ray Security Screening Market - Request Sample Report
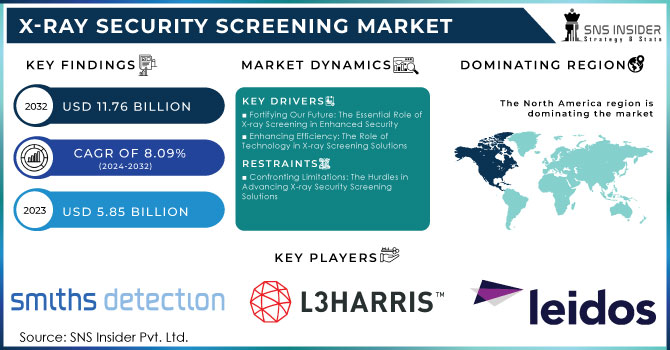
The X-ray Security Screening Market Size was valued at USD 5.85 Billion in 2023 and is expected to reach USD 11.76 Billion by 2032 and grow at a CAGR of 8.09% over the forecast period 2024-2032.
Primarily, the growth momentum of the X-ray Security Screening Market can be attributable to public concerns and the level of threat from terrorism and smuggling activities in such sectors as airport, port, and border control. The governments and private organizations are widely investing in advanced X-ray screening technologies to ensure security and comply with stringent regulatory requirements. It is further driven by the fact that X-ray security scanning helps in the detection of concealed weapons, explosives, drugs, and other contraband in transportation, government, and commercial sectors. A further boost to the market comes from increased demand from automated systems integrated with AI that detect faster and more accurately. In addition, rising passenger traffic worldwide and, importantly, at airports puts additional pressure on security systems to improve efficiency and handle screening volumes without conceding safety. Advancements in portable and mobile X-ray scanners also enhance the market.
The Transportation Security Administration of the United States is modernizing its X-ray security scanning across the country. They plan to commission 1,214 CT X-ray scanners at the country's airports across different checkpoints in a bid to spend USD 1.3 billion. That is 426 base-size units, 359 mid-size units, and 429 full-size units. Currently, there are about 634 CT scanners installed at TSA checkpoints; it is anticipated that new units would be installed up to 2024. This programme aims at the enhancement of aviation security and, by default, the effectiveness of the security process for passengers.
KEY DRIVERS:
Fortifying Our Future: The Essential Role of X-ray Screening in Enhanced Security
The X-ray security screening market is significantly influenced by the ever-rising requirement for increased security levels in various fields, such as transportation, critical infrastructure, and public events. Rising concerns about terrorist attacks and crimes require governments and organizations to spend heavy amounts on advanced security technology. The need for effective and efficient screening solutions at airports and seaports, among other high-traffic areas, makes X-ray screening systems indispensable for passenger and asset security.
Enhancing Efficiency: The Role of Technology in X-ray Screening Solutions
This is further complemented by the advancement in technology with regards to X-ray screening equipment. An example of this is high-resolution imaging, and in real time, data analysis, and automation increase the productivity and effectiveness of security-screening processes. These improvement measures are not only meant to enhance the effectiveness of detection capabilities but also clear up the processes so that people are no longer made to spend a lot of time waiting while productivity in day-to-day activities is generally undermined. As companies seek to bridge the gap between being exigent with regard to security measures and convenience, more intriguing X-ray screening solutions appeal to customers and hence drive demand for the process.
RESTRAIN:
Confronting Limitations: The Hurdles in Advancing X-ray Security Screening Solutions
Several constraints also exist in the X-ray security screening market. Advanced X-ray equipment has high investment costs, which is intimidating organizations, especially small businesses, to invest in such technologies. This may provide a structural support system to public resistance due to privacy and health risks due to radiation exposure. Regulatory compliance and periodic maintenance besides up-grades add to the problems of implementation. However, the rate of change in technology is so rapid that it demands continuous manpower training, adding to operational complexities. Unleashing the full potential for growth in the X-ray security screening market would thus call for overcoming these challenges.
BY END USE
The Government segment had the highest revenue with 46.45% of the total market share in the year 2023. Extensive adoption of security screening by government and law enforcement agencies for safety purposes propels the X-ray screening security market. Governments and private organizations are significantly investing in security solutions due to expanding terror activities.
The transit segment is expected to grow at a CAGR of 8.78% over the forecast period. The growth in this segment can be primarily associated with an increase in passengers worldwide and continuous efforts to adopt security measures to ensure complete safety for citizens and global travelers. This will contribute significantly towards increasing the demand for X-ray security screening in the transit sector over the next couple of years.
BY APPLICATION
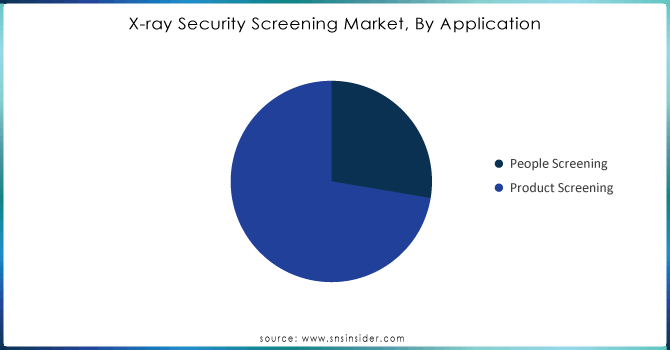
The product screening segment held the largest market share of 72.34% in 2023. With advancements in technology, integrated screening systems are readily available in the market, allowing vendors to integrate screening and emerging scanning end-use into traditional products, thus augmenting the growth of the segment.
The people screening segment is expected to hold a high growth rate of 9.76% from 2023 to 2032. Citizens and corporates are under persistent risks of cyber-attacks, natural and man-made disasters, and dangers like terrorism. Governments of various regions are concentrating on the advanced solutions that can enhance and strengthen the already existing information technology infrastructure and security systems.
Need any customization research on X-Ray Security Screening Market - Enquiry Now
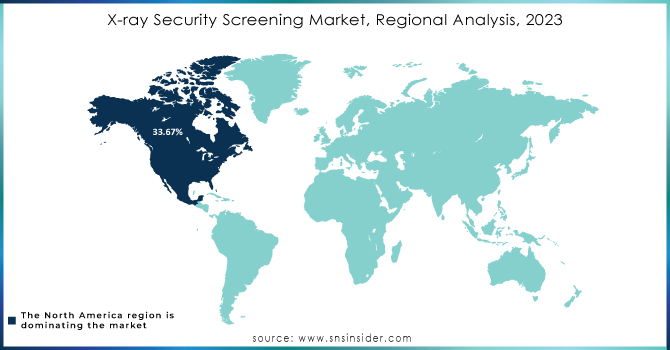
In 2023, North America dominated the market with a market share of 33.67%. Massive public investments toward making the current infrastructure for public safety and security better, coupled with obliterating threats like terrorism and illegal immigration, will work as market drivers in the considered forecast period. The U.S. Customs and Border Protection department scans all containers at the point of entry into the U.S., be it land or sea. Such scanning is done to eliminate any traces of radiation.
Asia Pacific is projected to grow at the highest CAGR of 10.11% during the forecast period. Asia Pacific is one of the emerging markets of the world in terms of the fact that the region encompasses numerous social occasions, tourism, events, and sports that cause huge crowning of people gathering and moving. Consequently, the scope for growth in the market of security screening is high in this region. India, China, Japan, and South Korea are major constituting countries of this region. Rest of Asia Pacific includes Singapore, Australia, the Philippines, and Thailand. The public events at which people throng in great numbers occur more frequently in Asia Pacific than in other regions
Some of the major players in the X-ray Security Screening Market are:
Smiths Detection (HI-SCAN 6040 CTiX, iLane A20)
L3Harris Technologies (ASCT, RSM-7)
Leidos (AXM, L-3 Dismounted Soldier System)
Nuctech Company Limited (TSA-600, T2000)
Safran (Morpho Detection, VDS-9)
Kromek Group (D5, D3)
TELEDYNE FLIR (Vega, ThermiCam)
Astrophysics Inc. (A-Series, V-Series)
Raytheon Technologies (Tactical X-ray Systems, Smart X-ray System)
General Electric (GE) (Infinia, Discovery CT750 HD)
Ametek Inc. (MCA-250, PICO-100)
Cannon Group (X-Scan, X-Check)
Hunan Yigao Group (YX-1, YX-2)
Varex Imaging Corporation (X-Ray Tubes, Flat Panel Detectors)
PerkinElmer (Pioneer, Multimodal Imaging Systems)
DHS Technologies (DHS X-ray Inspection, TSI System)
MARS Bioimaging (MARS X-ray Camera, MARS Imaging System)
Nippon Avionics Co., Ltd. (X-ray Inspection System, X-ray 3D Imaging)
Unisys Corporation (Unisys Security X-ray Solutions, Security Screening Systems)
In April 2024, Smiths Detection launched the SDX 10060 XDi - " revolutionary" X-ray scanner powered by diffraction technology, heralding a new era in security screening at airports.
Sep 2024, The Canadian Air Transport Security Authority said that it had plans of fitting airport checkpoints across the country with the technological equipment, which means a 360-degree view through computerized X-ray imaging, in the near future.
From July 2 2024, the Hong Kong International Airport introduces a new security scanning system that will allow passengers to carry their hand-carry luggage, with all their electronic devices and liquids in them, as they will no longer be asked to take out the laptop computer, mobile phone, game devices, and liquids, aerosols, and gels needed by the existing 2D scanning method.
| Report Attributes | Details |
|---|---|
| Market Size in 2023 | USD 5.85 Billion |
| Market Size by 2032 | USD 11.76 Billion |
| CAGR | CAGR of 8.09% From 2024 to 2032 |
| Base Year | 2023 |
| Forecast Period | 2024-2032 |
| Historical Data | 2020-2022 |
| Report Scope & Coverage | Market Size, Segments Analysis, Competitive Landscape, Regional Analysis, DROC & SWOT Analysis, Forecast Outlook |
| Key Segments | • By End Use (Transit, Commercial, Government) • By Application (People Screening, Product Screening) |
| Regional Analysis/Coverage | North America (US, Canada, Mexico), Europe (Eastern Europe [Poland, Romania, Hungary, Turkey, Rest of Eastern Europe] Western Europe] Germany, France, UK, Italy, Spain, Netherlands, Switzerland, Austria, Rest of Western Europe]), Asia Pacific (China, India, Japan, South Korea, Vietnam, Singapore, Australia, Rest of Asia Pacific), Middle East & Africa (Middle East [UAE, Egypt, Saudi Arabia, Qatar, Rest of Middle East], Africa [Nigeria, South Africa, Rest of Africa], Latin America (Brazil, Argentina, Colombia, Rest of Latin America) |
| Company Profiles | Smiths Detection, L3Harris Technologies, Leidos, Nuctech Company Limited, Safran, Kromek Group, TELEDYNE FLIR, Astrophysics Inc., Raytheon Technologies, General Electric (GE), Ametek Inc., Cannon Group, Zhejiang University, Hunan Yigao Group, Varex Imaging Corporation, PerkinElmer, DHS Technologies, MARS Bioimaging, Nippon Avionics Co., Ltd., Unisys Corporation. |
| Key Drivers | • Fortifying Our Future: The Essential Role of X-ray Screening in Enhanced Security • Enhancing Efficiency: The Role of Technology in X-ray Screening Solutions |
| RESTRAINTS | • Confronting Limitations: The Hurdles in Advancing X-ray Security Screening Solutions |
Ans: The X-ray Security Screening Market is expected to grow at a CAGR of 8.09% during 2024-2032.
Ans: X-ray Security Screening Market size was USD 5.58 billion in 2023 and is expected to Reach USD 11.76 billion by 2032.
Ans: The growth factor in the X-ray security screening market is the increased demand in transportation and public spaces for enhanced security measures. This has been attributed to rising fears and concerns over terrorism and crime.
Ans: The Product Screening segment dominated the X-ray Security Screening Market in 2023.
Ans: NORTH AMERICA dominated the X-ray Security Screening Market in 2023.
Table of Content
1. Introduction
1.1 Market Definition
1.2 Scope (Inclusion and Exclusions)
1.3 Research Assumptions
2. Executive Summary
2.1 Market Overview
2.2 Regional Synopsis
2.3 Competitive Summary
3. Research Methodology
3.1 Top-Down Approach
3.2 Bottom-up Approach
3.3. Data Validation
3.4 Primary Interviews
4. Market Dynamics Impact Analysis
4.1 Market Driving Factors Analysis
4.1.1 Drivers
4.1.2 Restraints
4.1.3 Opportunities
4.1.4 Challenges
4.2 PESTLE Analysis
4.3 Porter’s Five Forces Model
5. Statistical Insights and Trends Reporting
5.1 X-ray Security Screening Wafer Production Volumes, by Region (2023)
5.2 X-ray Security Screening Chip Design Trends (Historic and Future)
5.3 X-ray Security Screening Fab Capacity Utilization (2023)
5.4 Supply Chain Metrics
6. Competitive Landscape
6.1 List of Major Companies, By Region
6.2 Market Share Analysis, By Region
6.3 Product Benchmarking
6.3.1 Product specifications and features
6.3.2 Pricing
6.4 Strategic Initiatives
6.4.1 Marketing and promotional activities
6.4.2 Distribution and Supply Chain Strategies
6.4.3 Expansion plans and new product launches
6.4.4 Strategic partnerships and collaborations
6.5 Technological Advancements
6.6 Market Positioning and Branding
7. X-ray Security Screening Market Segmentation, by END USE
7.1 Chapter Overview
7.2 Transit
7.2.1 Transit Market Trends Analysis (2020-2032)
7.2.2 Transit Market Size Estimates and Forecasts to 2032 (USD Billion)
7.3 Commercial
7.3.1 Commercial Market Trends Analysis (2020-2032)
7.3.2 Commercial Market Size Estimates and Forecasts to 2032 (USD Billion)
7.4 Government
7.4.1 Government Market Trends Analysis (2020-2032)
7.4.2 Government Market Size Estimates and Forecasts to 2032 (USD Billion)
8. X-ray Security Screening Market Segmentation, by Application
8.1 Chapter Overview
8.2 People Screening
8.2.1 People Screening Market Trends Analysis (2020-2032)
8.2.2 People Screening Market Size Estimates and Forecasts to 2032 (USD Billion)
8.3 Product Screening
8.3.1 Product Screening Market Trends Analysis (2020-2032)
8.3.2 Product Screening Market Size Estimates and Forecasts to 2032 (USD Billion)
9. Regional Analysis
9.1 Chapter Overview
9.2 North America
9.2.1 Trends Analysis
9.2.2 North America X-ray Security Screening Market Estimates and Forecasts, by Country (2020-2032) (USD Billion)
9.2.3 North America X-ray Security Screening Market Estimates and Forecasts, by Application (2020-2032) (USD Billion)
9.2.4 North America X-ray Security Screening Market Estimates and Forecasts, by End User (2020-2032) (USD Billion)
9.2.5 USA
9.2.5.1 USA X-ray Security Screening Market Estimates and Forecasts, by Application (2020-2032) (USD Billion)
9.2.5.2 USA X-ray Security Screening Market Estimates and Forecasts, by End User (2020-2032) (USD Billion)
9.2.6 Canada
9.2.6.1 Canada X-ray Security Screening Market Estimates and Forecasts, by Application (2020-2032) (USD Billion)
9.2.6.2 Canada X-ray Security Screening Market Estimates and Forecasts, by End User (2020-2032) (USD Billion)
9.2.7 Mexico
9.2.7.1 Mexico X-ray Security Screening Market Estimates and Forecasts, by Application (2020-2032) (USD Billion)
9.2.7.2 Mexico X-ray Security Screening Market Estimates and Forecasts, by End User (2020-2032) (USD Billion)
9.3 Europe
9.3.1 Eastern Europe
9.3.1.1 Trends Analysis
9.3.1.2 Eastern Europe X-ray Security Screening Market Estimates and Forecasts, by Country (2020-2032) (USD Billion)
9.3.1.3 Eastern Europe X-ray Security Screening Market Estimates and Forecasts, by Application (2020-2032) (USD Billion)
9.3.1.4 Eastern Europe X-ray Security Screening Market Estimates and Forecasts, by End User (2020-2032) (USD Billion)
9.3.1.5 Poland
9.3.1.5.1 Poland X-ray Security Screening Market Estimates and Forecasts, by Application (2020-2032) (USD Billion)
9.3.1.5.2 Poland X-ray Security Screening Market Estimates and Forecasts, by End User (2020-2032) (USD Billion)
9.3.1.6 Romania
9.3.1.6.1 Romania X-ray Security Screening Market Estimates and Forecasts, by Application (2020-2032) (USD Billion)
9.3.1.6.2 Romania X-ray Security Screening Market Estimates and Forecasts, by End User (2020-2032) (USD Billion)
9.3.1.7 Hungary
9.3.1.7.1 Hungary X-ray Security Screening Market Estimates and Forecasts, by Application (2020-2032) (USD Billion)
9.3.1.7.2 Hungary X-ray Security Screening Market Estimates and Forecasts, by End User (2020-2032) (USD Billion)
9.3.1.8 Turkey
9.3.1.8.1 Turkey X-ray Security Screening Market Estimates and Forecasts, by Application (2020-2032) (USD Billion)
9.3.1.8.2 Turkey X-ray Security Screening Market Estimates and Forecasts, by End User (2020-2032) (USD Billion)
9.3.1.9 Rest of Eastern Europe
9.3.1.9.1 Rest of Eastern Europe X-ray Security Screening Market Estimates and Forecasts, by Application (2020-2032) (USD Billion)
9.3.1.9.2 Rest of Eastern Europe X-ray Security Screening Market Estimates and Forecasts, by End User (2020-2032) (USD Billion)
9.3.2 Western Europe
9.3.2.1 Trends Analysis
9.3.2.2 Western Europe X-ray Security Screening Market Estimates and Forecasts, by Country (2020-2032) (USD Billion)
9.3.2.3 Western Europe X-ray Security Screening Market Estimates and Forecasts, by Application (2020-2032) (USD Billion)
9.3.2.4 Western Europe X-ray Security Screening Market Estimates and Forecasts, by End User (2020-2032) (USD Billion)
9.3.2.5 Germany
9.3.2.5.1 Germany X-ray Security Screening Market Estimates and Forecasts, by Application (2020-2032) (USD Billion)
9.3.2.5.2 Germany X-ray Security Screening Market Estimates and Forecasts, by End User (2020-2032) (USD Billion)
9.3.2.6 France
9.3.2.6.1 France X-ray Security Screening Market Estimates and Forecasts, by Application (2020-2032) (USD Billion)
9.3.2.6.2 France X-ray Security Screening Market Estimates and Forecasts, by End User (2020-2032) (USD Billion)
9.3.2.7 UK
9.3.2.7.1 UK X-ray Security Screening Market Estimates and Forecasts, by Application (2020-2032) (USD Billion)
9.3.2.7.2 UK X-ray Security Screening Market Estimates and Forecasts, by End User (2020-2032) (USD Billion)
9.3.2.8 Italy
9.3.2.8.1 Italy X-ray Security Screening Market Estimates and Forecasts, by Application (2020-2032) (USD Billion)
9.3.2.8.2 Italy X-ray Security Screening Market Estimates and Forecasts, by End User (2020-2032) (USD Billion)
9.3.2.9 Spain
9.3.2.9.1 Spain X-ray Security Screening Market Estimates and Forecasts, by Application (2020-2032) (USD Billion)
9.3.2.9.2 Spain X-ray Security Screening Market Estimates and Forecasts, by End User (2020-2032) (USD Billion)
9.3.2.10 Netherlands
9.3.2.10.1 Netherlands X-ray Security Screening Market Estimates and Forecasts, by Application (2020-2032) (USD Billion)
9.3.2.10.2 Netherlands X-ray Security Screening Market Estimates and Forecasts, by End User (2020-2032) (USD Billion)
9.3.2.11 Switzerland
9.3.2.11.1 Switzerland X-ray Security Screening Market Estimates and Forecasts, by Application (2020-2032) (USD Billion)
9.3.2.11.2 Switzerland X-ray Security Screening Market Estimates and Forecasts, by End User (2020-2032) (USD Billion)
9.3.2.12 Austria
9.3.2.12.1 Austria X-ray Security Screening Market Estimates and Forecasts, by Application (2020-2032) (USD Billion)
9.3.2.12.2 Austria X-ray Security Screening Market Estimates and Forecasts, by End User (2020-2032) (USD Billion)
9.3.2.13 Rest of Western Europe
9.3.2.13.1 Rest of Western Europe X-ray Security Screening Market Estimates and Forecasts, by Application (2020-2032) (USD Billion)
9.3.2.13.2 Rest of Western Europe X-ray Security Screening Market Estimates and Forecasts, by End User (2020-2032) (USD Billion)
9.4 Asia Pacific
9.4.1 Trends Analysis
9.4.2 Asia Pacific X-ray Security Screening Market Estimates and Forecasts, by Country (2020-2032) (USD Billion)
9.4.3 Asia Pacific X-ray Security Screening Market Estimates and Forecasts, by Application (2020-2032) (USD Billion)
9.4.4 Asia Pacific X-ray Security Screening Market Estimates and Forecasts, by End User (2020-2032) (USD Billion)
9.4.5 China
9.4.5.1 China X-ray Security Screening Market Estimates and Forecasts, by Application (2020-2032) (USD Billion)
9.4.5.2 China X-ray Security Screening Market Estimates and Forecasts, by End User (2020-2032) (USD Billion)
9.4.6 India
9.4.5.1 India X-ray Security Screening Market Estimates and Forecasts, by Application (2020-2032) (USD Billion)
9.4.5.2 India X-ray Security Screening Market Estimates and Forecasts, by End User (2020-2032) (USD Billion)
9.4.5 Japan
9.4.5.1 Japan X-ray Security Screening Market Estimates and Forecasts, by Application (2020-2032) (USD Billion)
9.4.5.2 Japan X-ray Security Screening Market Estimates and Forecasts, by End User (2020-2032) (USD Billion)
9.4.6 South Korea
9.4.6.1 South Korea X-ray Security Screening Market Estimates and Forecasts, by Application (2020-2032) (USD Billion)
9.4.6.2 South Korea X-ray Security Screening Market Estimates and Forecasts, by End User (2020-2032) (USD Billion)
9.4.7 Vietnam
9.4.7.1 Vietnam X-ray Security Screening Market Estimates and Forecasts, by Application (2020-2032) (USD Billion)
9.2.7.2 Vietnam X-ray Security Screening Market Estimates and Forecasts, by End User (2020-2032) (USD Billion)
9.4.8 Singapore
9.4.8.1 Singapore X-ray Security Screening Market Estimates and Forecasts, by Application (2020-2032) (USD Billion)
9.4.8.2 Singapore X-ray Security Screening Market Estimates and Forecasts, by End User (2020-2032) (USD Billion)
9.4.9 Australia
9.4.9.1 Australia X-ray Security Screening Market Estimates and Forecasts, by Application (2020-2032) (USD Billion)
9.4.9.2 Australia X-ray Security Screening Market Estimates and Forecasts, by End User (2020-2032) (USD Billion)
9.4.10 Rest of Asia Pacific
9.4.10.1 Rest of Asia Pacific X-ray Security Screening Market Estimates and Forecasts, by Application (2020-2032) (USD Billion)
9.4.10.2 Rest of Asia Pacific X-ray Security Screening Market Estimates and Forecasts, by End User (2020-2032) (USD Billion)
9.5 Middle East and Africa
9.5.1 Middle East
9.5.1.1 Trends Analysis
9.5.1.2 Middle East X-ray Security Screening Market Estimates and Forecasts, by Country (2020-2032) (USD Billion)
9.5.1.3 Middle East X-ray Security Screening Market Estimates and Forecasts, by Application (2020-2032) (USD Billion)
9.5.1.4 Middle East X-ray Security Screening Market Estimates and Forecasts, by End User (2020-2032) (USD Billion)
9.5.1.5 UAE
9.5.1.5.1 UAE X-ray Security Screening Market Estimates and Forecasts, by Application (2020-2032) (USD Billion)
9.5.1.5.2 UAE X-ray Security Screening Market Estimates and Forecasts, by End User (2020-2032) (USD Billion)
9.5.1.6 Egypt
9.5.1.6.1 Egypt X-ray Security Screening Market Estimates and Forecasts, by Application (2020-2032) (USD Billion)
9.5.1.6.2 Egypt X-ray Security Screening Market Estimates and Forecasts, by End User (2020-2032) (USD Billion)
9.5.1.7 Saudi Arabia
9.5.1.7.1 Saudi Arabia X-ray Security Screening Market Estimates and Forecasts, by Application (2020-2032) (USD Billion)
9.5.1.7.2 Saudi Arabia X-ray Security Screening Market Estimates and Forecasts, by End User (2020-2032) (USD Billion)
9.5.1.8 Qatar
9.5.1.8.1 Qatar X-ray Security Screening Market Estimates and Forecasts, by Application (2020-2032) (USD Billion)
9.5.1.8.2 Qatar X-ray Security Screening Market Estimates and Forecasts, by End User (2020-2032) (USD Billion)
9.5.1.9 Rest of Middle East
9.5.1.9.1 Rest of Middle East X-ray Security Screening Market Estimates and Forecasts, by Application (2020-2032) (USD Billion)
9.5.1.9.2 Rest of Middle East X-ray Security Screening Market Estimates and Forecasts, by End User (2020-2032) (USD Billion)
9.5.2 Africa
9.5.2.1 Trends Analysis
9.5.2.2 Africa X-ray Security Screening Market Estimates and Forecasts, by Country (2020-2032) (USD Billion)
9.5.2.3 Africa X-ray Security Screening Market Estimates and Forecasts, by Application (2020-2032) (USD Billion)
9.5.2.4 Africa X-ray Security Screening Market Estimates and Forecasts, by End User (2020-2032) (USD Billion)
9.5.2.5 South Africa
9.5.2.5.1 South Africa X-ray Security Screening Market Estimates and Forecasts, by Application (2020-2032) (USD Billion)
9.5.2.5.2 South Africa X-ray Security Screening Market Estimates and Forecasts, by End User (2020-2032) (USD Billion)
9.5.2.6 Nigeria
9.5.2.6.1 Nigeria X-ray Security Screening Market Estimates and Forecasts, by Application (2020-2032) (USD Billion)
9.5.2.6.2 Nigeria X-ray Security Screening Market Estimates and Forecasts, by End User (2020-2032) (USD Billion)
9.5.2.7 Rest of Africa
9.5.2.7.1 Rest of Africa X-ray Security Screening Market Estimates and Forecasts, by Application (2020-2032) (USD Billion)
9.5.2.7.2 Rest of Africa X-ray Security Screening Market Estimates and Forecasts, by End User (2020-2032) (USD Billion)
9.6 Latin America
9.6.1 Trends Analysis
9.6.2 Latin America X-ray Security Screening Market Estimates and Forecasts, by Country (2020-2032) (USD Billion)
9.6.3 Latin America X-ray Security Screening Market Estimates and Forecasts, by Application (2020-2032) (USD Billion)
9.6.4 Latin America X-ray Security Screening Market Estimates and Forecasts, by End User (2020-2032) (USD Billion)
9.6.5 Brazil
9.6.5.1 Brazil X-ray Security Screening Market Estimates and Forecasts, by Application (2020-2032) (USD Billion)
9.6.5.2 Brazil X-ray Security Screening Market Estimates and Forecasts, by End User (2020-2032) (USD Billion)
9.6.6 Argentina
9.6.6.1 Argentina X-ray Security Screening Market Estimates and Forecasts, by Application (2020-2032) (USD Billion)
9.6.6.2 Argentina X-ray Security Screening Market Estimates and Forecasts, by End User (2020-2032) (USD Billion)
9.6.7 Colombia
9.6.7.1 Colombia X-ray Security Screening Market Estimates and Forecasts, by Application (2020-2032) (USD Billion)
9.6.7.2 Colombia X-ray Security Screening Market Estimates and Forecasts, by End User (2020-2032) (USD Billion)
9.6.8 Rest of Latin America
9.6.8.1 Rest of Latin America X-ray Security Screening Market Estimates and Forecasts, by Application (2020-2032) (USD Billion)
9.6.8.2 Rest of Latin America X-ray Security Screening Market Estimates and Forecasts, by End User (2020-2032) (USD Billion)
10. Company Profiles
10.1 Smiths Detection
10.1.1 Company Overview
10.1.2 Financial
10.1.3 Products/ Services Offered
110.1.4 SWOT Analysis
10.2 L3Harris Technologies
10.2.1 Company Overview
10.2.2 Financial
10.2.3 Products/ Services Offered
10.2.4 SWOT Analysis
10.3 Leidos
10.3.1 Company Overview
10.3.2 Financial
10.3.3 Products/ Services Offered
10.3.4 SWOT Analysis
10.4 Nuctech Company Limited
10.4.1 Company Overview
10.4.2 Financial
10.4.3 Products/ Services Offered
10.4.4 SWOT Analysis
10.5 Safran
10.5.1 Company Overview
10.5.2 Financial
10.5.3 Products/ Services Offered
10.5.4 SWOT Analysis
10.6 Kromek Group
10.6.1 Company Overview
10.6.2 Financial
10.6.3 Products/ Services Offered
10.6.4 SWOT Analysis
10.7 TELEDYNE FLIR
10.7.1 Company Overview
10.7.2 Financial
10.7.3 Products/ Services Offered
10.7.4 SWOT Analysis
10.8 Astrophysics Inc.
10.8.1 Company Overview
10.8.2 Financial
10.8.3 Products/ Services Offered
10.8.4 SWOT Analysis
10.9 Raytheon Technologies
10.9.1 Company Overview
10.9.2 Financial
10.9.3 Products/ Services Offered
10.9.4 SWOT Analysis
10.10 General Electric (GE)
10.9.1 Company Overview
10.9.2 Financial
10.9.3 Products/ Services Offered
10.9.4 SWOT Analysis
11. Use Cases and Best Practices
12. Conclusion
An accurate research report requires proper strategizing as well as implementation. There are multiple factors involved in the completion of good and accurate research report and selecting the best methodology to compete the research is the toughest part. Since the research reports we provide play a crucial role in any company’s decision-making process, therefore we at SNS Insider always believe that we should choose the best method which gives us results closer to reality. This allows us to reach at a stage wherein we can provide our clients best and accurate investment to output ratio.
Each report that we prepare takes a timeframe of 350-400 business hours for production. Starting from the selection of titles through a couple of in-depth brain storming session to the final QC process before uploading our titles on our website we dedicate around 350 working hours. The titles are selected based on their current market cap and the foreseen CAGR and growth.
The 5 steps process:
Step 1: Secondary Research:
Secondary Research or Desk Research is as the name suggests is a research process wherein, we collect data through the readily available information. In this process we use various paid and unpaid databases which our team has access to and gather data through the same. This includes examining of listed companies’ annual reports, Journals, SEC filling etc. Apart from this our team has access to various associations across the globe across different industries. Lastly, we have exchange relationships with various university as well as individual libraries.

Step 2: Primary Research
When we talk about primary research, it is a type of study in which the researchers collect relevant data samples directly, rather than relying on previously collected data. This type of research is focused on gaining content specific facts that can be sued to solve specific problems. Since the collected data is fresh and first hand therefore it makes the study more accurate and genuine.
We at SNS Insider have divided Primary Research into 2 parts.
Part 1 wherein we interview the KOLs of major players as well as the upcoming ones across various geographic regions. This allows us to have their view over the market scenario and acts as an important tool to come closer to the accurate market numbers. As many as 45 paid and unpaid primary interviews are taken from both the demand and supply side of the industry to make sure we land at an accurate judgement and analysis of the market.
This step involves the triangulation of data wherein our team analyses the interview transcripts, online survey responses and observation of on filed participants. The below mentioned chart should give a better understanding of the part 1 of the primary interview.

Part 2: In this part of primary research the data collected via secondary research and the part 1 of the primary research is validated with the interviews from individual consultants and subject matter experts.
Consultants are those set of people who have at least 12 years of experience and expertise within the industry whereas Subject Matter Experts are those with at least 15 years of experience behind their back within the same space. The data with the help of two main processes i.e., FGDs (Focused Group Discussions) and IDs (Individual Discussions). This gives us a 3rd party nonbiased primary view of the market scenario making it a more dependable one while collation of the data pointers.
Step 3: Data Bank Validation
Once all the information is collected via primary and secondary sources, we run that information for data validation. At our intelligence centre our research heads track a lot of information related to the market which includes the quarterly reports, the daily stock prices, and other relevant information. Our data bank server gets updated every fortnight and that is how the information which we collected using our primary and secondary information is revalidated in real time.

Step 4: QA/QC Process
After all the data collection and validation our team does a final level of quality check and quality assurance to get rid of any unwanted or undesired mistakes. This might include but not limited to getting rid of the any typos, duplication of numbers or missing of any important information. The people involved in this process include technical content writers, research heads and graphics people. Once this process is completed the title gets uploader on our platform for our clients to read it.
Step 5: Final QC/QA Process:
This is the last process and comes when the client has ordered the study. In this process a final QA/QC is done before the study is emailed to the client. Since we believe in giving our clients a good experience of our research studies, therefore, to make sure that we do not lack at our end in any way humanly possible we do a final round of quality check and then dispatch the study to the client.
Key Segments:
By End Use
Transit
Commercial
Government
By Application
People Screening
Product Screening
Request for Segment Customization as per your Business Requirement: Segment Customization Request
REGIONAL COVERAGE:
North America
US
Canada
Mexico
Europe
Eastern Europe
Poland
Romania
Hungary
Turkey
Rest of Eastern Europe
Western Europe
Germany
France
UK
Italy
Spain
Netherlands
Switzerland
Austria
Rest of Western Europe
Asia Pacific
China
India
Japan
South Korea
Vietnam
Singapore
Australia
Rest of Asia Pacific
Middle East & Africa
Middle East
UAE
Egypt
Saudi Arabia
Qatar
Rest of the Middle East
Africa
Nigeria
South Africa
Rest of Africa
Latin America
Brazil
Argentina
Colombia
Request for Country Level Research Report: Country Level Customization Request
Available Customization
With the given market data, SNS Insider offers customization as per the company’s specific needs. The following customization options are available for the report:
Product Analysis
Criss-Cross segment analysis (e.g. Product X Application)
Product Matrix which gives a detailed comparison of the product portfolio of each company
Geographic Analysis
Additional countries in any of the regions
Company Information
Detailed analysis and profiling of additional market players (Up to five)
The Substrates Market size was valued at USD 81.15 Million in 2023 and is expected to grow to USD 535.50 Million by 2032, at a CAGR of 26.6% During 2024-2032
The Photoelectric Sensor Market Size was valued at USD 1.97 billion in 2023 and is expected to grow at a CAGR of 7.46% to reach USD 3.74 billion by 2032.
The Laser Interferometer Market Size was valued at USD 294.5 Million in 2023 and expected to grow at a CAGR of 6.85% to reach USD 534.53 Million by 2032
The Military Communication Market size was valued at USD 28.66 billion in 2023 and is expected to grow to USD 54.04 billion by 2032 and grow at a CAGR of 7.34% over the forecast period of 2024-2032.
The Human Machine Interface Market Size was USD 5.59 Billion in 2023 and will reach USD 12.49 Billion by 2032 and grow at a CAGR of 9.54% by 2024-2032.
The Holographic Display Market Size was valued at USD 2.85 Billion in 2023 and is expected to reach USD 17.71 Billion by 2032 and grow at a CAGR of 22.55% over the forecast period 2024-2032.

Hi! Click one of our member below to chat on Phone
© 2025 All Rights Reserved by SNS Insider Pvt Ltd


