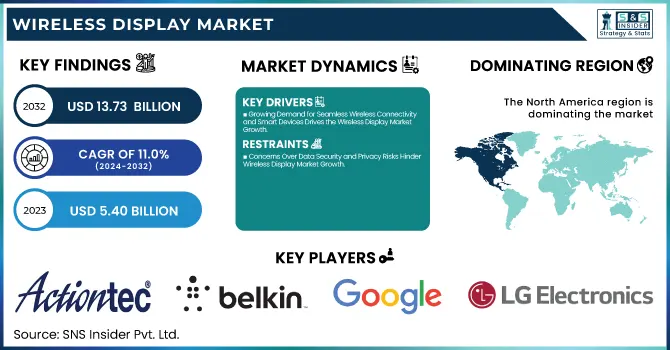
The Wireless Display Market Size was valued at USD 5.40 Billion in 2023 and is expected to reach USD 13.73 Billion by 2032 and grow at a CAGR of 11.0% over the forecast period 2024-2032.
The Market is experiencing rapid growth driven by increasing demand for seamless content streaming, advancements in display technologies, and rising adoption across residential and commercial sectors. The proliferation of smart TVs, laptops, and mobile devices, coupled with improved internet connectivity, has fueled market expansion. Key technologies like AirPlay, Miracast, and Google Cast are gaining traction, offering high-quality screen mirroring and streaming solutions. The market is further influenced by rising demand for remote work solutions, smart classrooms, and digital signage applications. Additionally, growing investments in 5G, Wi-Fi 6, and ultra-low latency streaming are expected to drive further innovation, enhancing user experience and connectivity.
Key Drivers:
Growing Demand for Seamless Wireless Connectivity and Smart Devices Drives the Wireless Display Market Growth
The increasing adoption of smart devices such as smartphones, tablets, laptops, and smart TVs is a key driver for the Wireless Display Market. Consumers and businesses seek seamless screen mirroring and content-sharing solutions for entertainment, presentations, and remote collaboration. The rise of remote work, online education, and digital signage applications has further fueled demand for wireless display technologies like Miracast, AirPlay, and Google Cast. Additionally, advancements in Wi-Fi 6, 5G, and ultra-low latency streaming are enhancing performance, enabling high-definition video transmission with minimal lag. The gaming industry is also contributing to market growth as gamers prefer wireless screen mirroring solutions for an immersive experience. Furthermore, businesses are increasingly investing in wireless conferencing solutions, eliminating the need for cables and enhancing efficiency. As technology advances, wireless display solutions are expected to become more affordable and widely adopted, further driving market expansion.
Restrain:
Concerns Over Data Security and Privacy Risks Hinder Wireless Display Market Growth
The Wireless Display Market is the rising concern over data security and privacy risks. Since wireless display solutions rely on Wi-Fi, Bluetooth, and internet-based streaming technologies, they are vulnerable to cyber threats, unauthorized access, and data breaches. Businesses, educational institutions, and individuals are increasingly cautious about sharing sensitive information over wireless networks due to risks like hacking, malware attacks, and screen hijacking. Additionally, compatibility issues between different operating systems and wireless display protocols further complicate security measures. Many corporate environments and government institutions hesitate to adopt wireless display solutions due to strict compliance and data protection regulations. To overcome this challenge, manufacturers and technology providers must invest in advanced encryption, authentication, and secure network protocols to ensure data protection. Addressing these concerns effectively will be crucial in boosting adoption rates and enhancing consumer confidence in wireless display technology.
Opportunities:
Expansion of 5G Networks and Wi-Fi 6 Adoption Creates Lucrative Opportunities for Wireless Display Market Growth
The rapid deployment of 5G networks and the adoption of Wi-Fi 6 present a significant growth opportunity for the Wireless Display Market. These advanced wireless technologies enable faster data transmission, lower latency, and improved network reliability, making wireless streaming and screen mirroring more efficient. With 5G connectivity, users can experience seamless high-definition video streaming, real-time gaming, and lag-free remote collaboration, driving demand for wireless display solutions in entertainment, education, and corporate environments. Additionally, Wi-Fi 6 technology enhances network capacity and efficiency, allowing multiple devices to connect simultaneously without compromising performance. The increasing availability of smart TVs, projectors, and wireless display adapters integrated with 5G and Wi-Fi 6 capabilities is expected to boost adoption across residential and commercial sectors. As these technologies continue to evolve, businesses and consumers will embrace wireless display solutions for enhanced user experiences, connectivity, and productivity.
Challenge;
Compatibility Issues Across Devices and Operating Systems Pose a Significant Challenge for Wireless Display Market
The Wireless Display Market is the lack of standardization and compatibility across different devices and operating systems. Various wireless display technologies, such as Miracast, AirPlay, and Google Cast, operate on different platforms, leading to interoperability issues. Users often face difficulties in seamlessly connecting devices from different manufacturers, requiring additional adapters or third-party software. Businesses and consumers demand a universal wireless display standard to ensure smooth connectivity across multiple devices, including smartphones, tablets, laptops, and smart TVs. Additionally, software updates and firmware changes can sometimes disrupt connectivity and performance, causing frustration among users. These compatibility challenges hinder mass adoption and require industry players to collaborate on standardization efforts. Addressing this issue through cross-platform compatibility solutions, firmware updates, and open-source wireless display standards will be critical to overcoming this challenge and expanding the market.
By Offering
The Hardware segment led the Wireless Display Market in 2023, accounting for 53% of total revenue, driven by the widespread adoption of wireless display adapters, streaming devices, smart TVs, and projectors. The demand for high-definition and seamless screen-sharing solutions has surged across residential and commercial applications, including smart homes, corporate boardrooms, education, and digital signage. Leading players like Google LLC, Roku, Inc., and Microsoft Corporation have played a significant role in driving hardware adoption.
For instance, Google launched Chromecast with Google TV (HD) in September 2022, offering enhanced streaming quality, Google Assistant integration, and compatibility with multiple devices. Similarly, Microsoft's Wireless Display Adapter continues to be a preferred choice for professionals seeking hassle-free screen mirroring solutions.
Additionally, NETGEAR’s Push2TV and Actiontec’s ScreenBeam adapters have further strengthened the hardware segment by enabling wireless presentations and home entertainment experiences. The increasing penetration of smart TVs integrated with Miracast, AirPlay, and Google Cast has also fueled market dominance.
The Software segment within the Wireless Display Market is expected to grow at the highest CAGR of 12.4% during the forecast period, driven by rising demand for screen-sharing applications, cloud-based collaboration tools, and AI-powered streaming solutions. The increasing adoption of wireless display software for business meetings, remote education, and entertainment applications has accelerated market expansion. Companies are investing heavily in software innovations to enhance connectivity, security, and user experience.
Additionally, Apple’s iOS 17 update in September 2023 brought enhanced AirPlay functionality, allowing seamless wireless content sharing across multiple Apple devices. The growing integration of AI-driven screen optimization, multi-device synchronization, and real-time collaboration tools is further propelling software adoption.
By Technology
In 2023, the AirPlay segment led the Wireless Display Market, accounting for the largest revenue share, driven by the widespread adoption of Apple devices and seamless integration within the Apple ecosystem. AirPlay enables high-quality wireless streaming and screen mirroring across iPhones, iPads, MacBooks, Apple TVs, and select smart TVs, making it a preferred choice for consumers and professionals. Apple has continuously enhanced AirPlay technology, improving latency, multi-room audio synchronization, and cross-device compatibility.
Additionally, LG, Samsung, and Sony have integrated AirPlay 2 into their latest smart TVs, enabling direct wireless content sharing without additional hardware. The increasing demand for wireless home entertainment, corporate presentations, and smart home connectivity has further solidified AirPlay’s dominance.
The Google Cast segment is expected to grow at the highest CAGR during the forecasted period, driven by the rising adoption of Android-powered streaming devices, smart TVs, and cross-platform compatibility. Google Cast technology, integrated into Chromecast devices, Android TVs, and third-party smart displays, allows users to wirelessly stream content from smartphones, tablets, and Chrome browsers to larger screens. The demand for affordable, user-friendly wireless display solutions has accelerated the adoption of Google Cast in both residential and commercial applications.
Additionally, brands like Sony, TCL, and Hisense continue to embed Google Cast in their smart TVs, expanding its reach. The growing use of Google Cast in conference rooms, remote learning, and gaming applications further drives market growth. As Google enhances Cast technology with AI-powered recommendations, 5G connectivity, and ultra-low latency streaming, the segment is poised for significant expansion.
By End-use
The Residential segment led the Wireless Display Market in 2023, capturing the largest revenue share, driven by the increasing adoption of smart TVs, streaming devices, and wireless entertainment solutions. Consumers are increasingly relying on wireless display technology for seamless content streaming, gaming, and home theater experiences, fueling demand for devices like Apple TV, Chromecast, Roku, and Miracast-enabled smart TVs.
Additionally, Roku introduced its Roku Ultra 2023 model, featuring Dolby Vision, faster performance, and expanded wireless range, further enhancing the home streaming experience. Apple’s iOS 17 update in 2023 also improved AirPlay capabilities, making wireless screen mirroring across Apple devices smoother than ever. The rise of 4K and 8K streaming, gaming consoles, and AI-enhanced home entertainment has further driven segment growth.
The Commercial segment is projected to grow at the highest CAGR during the forecast period, driven by increasing adoption in corporate offices, educational institutions, healthcare facilities, and digital signage applications. Businesses are transitioning to wireless display solutions for seamless presentations, video conferencing, and collaborative workspaces, eliminating the need for complex cable setups. In January 2023, Microsoft introduced enhanced wireless display features in Windows 11, improving screen mirroring capabilities for corporate users.
Additionally, LG launched its latest series of Miracast-enabled smart projectors, enabling wireless business presentations with high-resolution streaming. The demand for wireless digital signage solutions in retail, hospitality, and healthcare sectors is also accelerating growth.
In 2023, North America led the Wireless Display Market, holding the largest market share, driven by high consumer demand for smart home entertainment, corporate adoption of wireless conferencing solutions, and strong technological infrastructure. The region’s dominance is fueled by widespread adoption of wireless streaming devices like Chromecast, Apple TV, Roku, and Miracast-enabled smart TVs, along with increasing investments in 5G and Wi-Fi 6 technologies.
Additionally, businesses are rapidly integrating wireless display solutions for video conferencing, with Microsoft expanding its Wireless Display Adapter offerings for hybrid work environments. The presence of leading tech companies, including Google, Apple, Microsoft, and Roku, has further strengthened market growth.
The Asia Pacific region is experiencing the fastest growth in the Wireless Display Market, with an estimated highest CAGR, driven by rapid digital transformation, increasing smartphone penetration, and rising demand for smart home entertainment solutions. Countries like China, India, Japan, and South Korea are leading this growth, fueled by expanding internet connectivity, adoption of 5G networks, and rising disposable incomes.
Additionally, Google expanded its Chromecast product line in India and Southeast Asia, making wireless display solutions more accessible. The corporate sector is also embracing wireless conferencing solutions, with businesses and educational institutions shifting to hybrid work and e-learning models. The rapid deployment of Wi-Fi 6, AI-powered screen-sharing, and affordable wireless display devices is expected to drive continued market growth in the region.
Some of the major players in the Wireless Display Market are:
Actiontec Electronics, Inc. (ScreenBeam Wireless Display Adapter, ScreenBeam Mini 2)
Apple Inc. (Apple TV, AirPlay)
Belkin (Belkin ScreenCast, Belkin Miracast Video Adapter)
Google LLC (Chromecast, Google Cast)
IOGEAR (IOGEAR Wireless HD Transmitter, IOGEAR Share Pro)
Intel Corporation (Intel WiDi, Intel Unite)
Lattice Semiconductor (Lattice Miracast Solutions, Lattice WirelessHD)
LG Electronics (LG Smart Share, LG Miracast TV)
Marvell (Marvell AVASTAR Wireless Chipset, Marvell 88W8997 Wi-Fi)
MediaTek Inc. (MediaTek Wi-Fi Display, MediaTek SmartView)
Microsoft Corporation (Microsoft Wireless Display Adapter, Miracast on Windows)
MiraScreen (MiraScreen G-Series, MiraScreen Wireless HDMI Dongle)
NETGEAR (NETGEAR Push2TV, NETGEAR Nighthawk Pro Streaming)
Roku, Inc. (Roku Streaming Stick, Roku Screen Mirroring)
StarTech.com (StarTech Wireless Display Adapter, StarTech HDMI Over Wi-Fi)
In December 2024, Belkin introduced the Auto-Tracking Stand Pro with DockKit, a versatile accessory designed to enhance video calls and content creation on iPhones. This stand features a 360-degree rotating base and motorized 90-degree auto-tilt, automatically tracking face and body movements to maintain optimal framing. It includes a built-in battery for untethered use and a MagSafe charging pad capable of 15-watt wireless charging.
In April 2023, Google announced it would discontinue software updates for several third-party smart displays, including Lenovo, JBL, and LG models. This decision indicates a shift away from supporting Assistant-enabled products from these manufacturers. While existing functionalities on these devices continue to operate, users may experience a decline in the quality of video calls and meetings due to the lack of ongoing support and updates.
Report Attributes | Details |
---|---|
Market Size in 2023 | US$ 5.40 Billion |
Market Size by 2032 | US$ 13.73 Billion |
CAGR | CAGR of 11.0 % From 2024 to 2032 |
Base Year | 2023 |
Forecast Period | 2024-2032 |
Historical Data | 2020-2022 |
Report Scope & Coverage | Market Size, Segments Analysis, Competitive Landscape, Regional Analysis, DROC & SWOT Analysis, Forecast Outlook |
Key Segments | • By Offering (Hardware, Software, Services) • By Technology (Airplay, Miracast, Google Cast, Others) • By End-use (Residential, Commercial) |
Regional Analysis/Coverage | North America (US, Canada, Mexico), Europe (Eastern Europe [Poland, Romania, Hungary, Turkey, Rest of Eastern Europe] Western Europe] Germany, France, UK, Italy, Spain, Netherlands, Switzerland, Austria, Rest of Western Europe]), Asia Pacific (China, India, Japan, South Korea, Vietnam, Singapore, Australia, Rest of Asia Pacific), Middle East & Africa (Middle East [UAE, Egypt, Saudi Arabia, Qatar, Rest of Middle East], Africa [Nigeria, South Africa, Rest of Africa], Latin America (Brazil, Argentina, Colombia, Rest of Latin America) |
Company Profiles | Actiontec Electronics, Inc., Apple Inc., Belkin, Google LLC, IOGEAR, Intel Corporation, Lattice Semiconductor, LG Electronics, Marvell, MediaTek Inc., Microsoft Corporation, MiraScreen, NETGEAR, Roku, Inc., StarTech.com |
Ans: The Wireless Display Market is expected to grow at a CAGR of 11.0% during 2024-2032.
Ans: The Wireless Display Market size was USD 5.40 billion in 2023 and is expected to Reach USD 13.73 billion by 2032.
Ans: The major growth factor of the Wireless Display Market is the increasing adoption of smart devices, seamless screen mirroring technologies, and demand for wireless entertainment and collaboration solutions across various industries.
Ans: The Hardware segment dominated the Wireless Display Market.
Ans: North America dominated the Wireless Display Market in 2023.
Table of Contents
1. Introduction
1.1 Market Definition
1.2 Scope (Inclusion and Exclusions)
1.3 Research Assumptions
2. Executive Summary
2.1 Market Overview
2.2 Regional Synopsis
2.3 Competitive Summary
3. Research Methodology
3.1 Top-Down Approach
3.2 Bottom-up Approach
3.3. Data Validation
3.4 Primary Interviews
4. Market Dynamics Impact Analysis
4.1 Market Driving Factors Analysis
4.1.1 Drivers
4.1.2 Restraints
4.1.3 Opportunities
4.1.4 Challenges
4.2 PESTLE Analysis
4.3 Porter’s Five Forces Model
5. Statistical Insights and Trends Reporting
5.1 Device Penetration Rate (2023)
5.2 Adoption Rate of Wireless Display Solutions (2023)
5.3 Internet & Connectivity Trends (2023)
5.4 Consumer Preference Statistics (2023)
6. Competitive Landscape
6.1 List of Major Companies, By Region
6.2 Market Share Analysis, By Region
6.3 Product Benchmarking
6.3.1 Product specifications and features
6.3.2 Pricing
6.4 Strategic Initiatives
6.4.1 Marketing and promotional activities
6.4.2 Distribution and Supply Chain Strategies
6.4.3 Expansion plans and new product launches
6.4.4 Strategic partnerships and collaborations
6.5 Technological Advancements
6.6 Market Positioning and Branding
7. Wireless Display Market Segmentation, By Offering
7.1 Chapter Overview
7.2 Hardware
7.2.1 Hardware Market Trends Analysis (2020-2032)
7.2.2 Hardware Market Size Estimates and Forecasts to 2032 (USD Billion)
7.3 Software
7.3.1 Software Market Trends Analysis (2020-2032)
7.3.2 Software Market Size Estimates and Forecasts to 2032 (USD Billion)
7.4 Services
7.4.1 Services Market Trends Analysis (2020-2032)
7.4.2 Services Market Size Estimates and Forecasts to 2032 (USD Billion)
8. Wireless Display Market Segmentation, By End-Use
8.1 Chapter Overview
8.2 Residential
8.2.1 Residential Market Trends Analysis (2020-2032)
8.2.2 Residential Market Size Estimates and Forecasts to 2032 (USD Billion)
8.3 Commercial
8.3.1 Commercial Market Trends Analysis (2020-2032)
8.3.2 Commercial Market Size Estimates and Forecasts to 2032 (USD Billion)
9. Wireless Display Market Segmentation, By Technology
9.1 Chapter Overview
9.2 Airplay
9.2.1 Airplay Market Trends Analysis (2020-2032)
9.2.2 Airplay Market Size Estimates and Forecasts to 2032 (USD Billion)
9.3 Miracast
9.3.1 Miracast Market Trends Analysis (2020-2032)
9.3.2 Miracast Market Size Estimates and Forecasts to 2032 (USD Billion)
9.4 Google Cast
9.4.1 Google Cast Market Trends Analysis (2020-2032)
9.4.2 Google Cast Market Size Estimates and Forecasts to 2032 (USD Billion)
9.5 Others
9.5.1 Others Market Trends Analysis (2020-2032)
9.5.2 Others Market Size Estimates and Forecasts to 2032 (USD Billion)
10. Regional Analysis
10.1 Chapter Overview
10.2 North America
10.2.1 Trends Analysis
10.2.2 North America Wireless Display Market Estimates and Forecasts, by Country (2020-2032) (USD Billion)
10.2.3 North America Wireless Display Market Estimates and Forecasts, By Offering (2020-2032) (USD Billion)
10.2.4 North America Wireless Display Market Estimates and Forecasts, By End-Use (2020-2032) (USD Billion)
10.2.5 North America Wireless Display Market Estimates and Forecasts, By Technology (2020-2032) (USD Billion)
10.2.6 USA
10.2.6.1 USA Wireless Display Market Estimates and Forecasts, By Offering (2020-2032) (USD Billion)
10.2.6.2 USA Wireless Display Market Estimates and Forecasts, By End-Use (2020-2032) (USD Billion)
10.2.6.3 USA Wireless Display Market Estimates and Forecasts, By Technology (2020-2032) (USD Billion)
10.2.7 Canada
10.2.7.1 Canada Wireless Display Market Estimates and Forecasts, By Offering (2020-2032) (USD Billion)
10.2.7.2 Canada Wireless Display Market Estimates and Forecasts, By End-Use (2020-2032) (USD Billion)
10.2.7.3 Canada Wireless Display Market Estimates and Forecasts, By Technology (2020-2032) (USD Billion)
10.2.8 Mexico
10.2.8.1 Mexico Wireless Display Market Estimates and Forecasts, By Offering (2020-2032) (USD Billion)
10.2.8.2 Mexico Wireless Display Market Estimates and Forecasts, By End-Use (2020-2032) (USD Billion)
10.2.8.3 Mexico Wireless Display Market Estimates and Forecasts, By Technology (2020-2032) (USD Billion)
10.3 Europe
10.3.1 Eastern Europe
10.3.1.1 Trends Analysis
10.3.1.2 Eastern Europe Wireless Display Market Estimates and Forecasts, by Country (2020-2032) (USD Billion)
10.3.1.3 Eastern Europe Wireless Display Market Estimates and Forecasts, By Offering (2020-2032) (USD Billion)
10.3.1.4 Eastern Europe Wireless Display Market Estimates and Forecasts, By End-Use (2020-2032) (USD Billion)
10.3.1.5 Eastern Europe Wireless Display Market Estimates and Forecasts, By Technology (2020-2032) (USD Billion)
10.3.1.6 Poland
10.3.1.6.1 Poland Wireless Display Market Estimates and Forecasts, By Offering (2020-2032) (USD Billion)
10.3.1.6.2 Poland Wireless Display Market Estimates and Forecasts, By End-Use (2020-2032) (USD Billion)
10.3.1.6.3 Poland Wireless Display Market Estimates and Forecasts, By Technology (2020-2032) (USD Billion)
10.3.1.7 Romania
10.3.1.7.1 Romania Wireless Display Market Estimates and Forecasts, By Offering (2020-2032) (USD Billion)
10.3.1.7.2 Romania Wireless Display Market Estimates and Forecasts, By End-Use (2020-2032) (USD Billion)
10.3.1.7.3 Romania Wireless Display Market Estimates and Forecasts, By Technology (2020-2032) (USD Billion)
10.3.1.8 Hungary
10.3.1.8.1 Hungary Wireless Display Market Estimates and Forecasts, By Offering (2020-2032) (USD Billion)
10.3.1.8.2 Hungary Wireless Display Market Estimates and Forecasts, By End-Use (2020-2032) (USD Billion)
10.3.1.8.3 Hungary Wireless Display Market Estimates and Forecasts, By Technology (2020-2032) (USD Billion)
10.3.1.9 Turkey
10.3.1.9.1 Turkey Wireless Display Market Estimates and Forecasts, By Offering (2020-2032) (USD Billion)
10.3.1.9.2 Turkey Wireless Display Market Estimates and Forecasts, By End-Use (2020-2032) (USD Billion)
10.3.1.9.3 Turkey Wireless Display Market Estimates and Forecasts, By Technology (2020-2032) (USD Billion)
10.3.1.10 Rest of Eastern Europe
10.3.1.10.1 Rest of Eastern Europe Wireless Display Market Estimates and Forecasts, By Offering (2020-2032) (USD Billion)
10.3.1.10.2 Rest of Eastern Europe Wireless Display Market Estimates and Forecasts, By End-Use (2020-2032) (USD Billion)
10.3.1.10.3 Rest of Eastern Europe Wireless Display Market Estimates and Forecasts, By Technology (2020-2032) (USD Billion)
10.3.2 Western Europe
10.3.2.1 Trends Analysis
10.3.2.2 Western Europe Wireless Display Market Estimates and Forecasts, by Country (2020-2032) (USD Billion)
10.3.2.3 Western Europe Wireless Display Market Estimates and Forecasts, By Offering (2020-2032) (USD Billion)
10.3.2.4 Western Europe Wireless Display Market Estimates and Forecasts, By End-Use (2020-2032) (USD Billion)
10.3.2.5 Western Europe Wireless Display Market Estimates and Forecasts, By Technology (2020-2032) (USD Billion)
10.3.2.6 Germany
10.3.2.6.1 Germany Wireless Display Market Estimates and Forecasts, By Offering (2020-2032) (USD Billion)
10.3.2.6.2 Germany Wireless Display Market Estimates and Forecasts, By End-Use (2020-2032) (USD Billion)
10.3.2.6.3 Germany Wireless Display Market Estimates and Forecasts, By Technology (2020-2032) (USD Billion)
10.3.2.7 France
10.3.2.7.1 France Wireless Display Market Estimates and Forecasts, By Offering (2020-2032) (USD Billion)
10.3.2.7.2 France Wireless Display Market Estimates and Forecasts, By End-Use (2020-2032) (USD Billion)
10.3.2.7.3 France Wireless Display Market Estimates and Forecasts, By Technology (2020-2032) (USD Billion)
10.3.2.8 UK
10.3.2.8.1 UK Wireless Display Market Estimates and Forecasts, By Offering (2020-2032) (USD Billion)
10.3.2.8.2 UK Wireless Display Market Estimates and Forecasts, By End-Use (2020-2032) (USD Billion)
10.3.2.8.3 UK Wireless Display Market Estimates and Forecasts, By Technology (2020-2032) (USD Billion)
10.3.2.9 Italy
10.3.2.9.1 Italy Wireless Display Market Estimates and Forecasts, By Offering (2020-2032) (USD Billion)
10.3.2.9.2 Italy Wireless Display Market Estimates and Forecasts, By End-Use (2020-2032) (USD Billion)
10.3.2.9.3 Italy Wireless Display Market Estimates and Forecasts, By Technology (2020-2032) (USD Billion)
10.3.2.10 Spain
10.3.2.10.1 Spain Wireless Display Market Estimates and Forecasts, By Offering (2020-2032) (USD Billion)
10.3.2.10.2 Spain Wireless Display Market Estimates and Forecasts, By End-Use (2020-2032) (USD Billion)
10.3.2.10.3 Spain Wireless Display Market Estimates and Forecasts, By Technology (2020-2032) (USD Billion)
10.3.2.11 Netherlands
10.3.2.11.1 Netherlands Wireless Display Market Estimates and Forecasts, By Offering (2020-2032) (USD Billion)
10.3.2.11.2 Netherlands Wireless Display Market Estimates and Forecasts, By End-Use (2020-2032) (USD Billion)
10.3.2.11.3 Netherlands Wireless Display Market Estimates and Forecasts, By Technology (2020-2032) (USD Billion)
10.3.2.12 Switzerland
10.3.2.12.1 Switzerland Wireless Display Market Estimates and Forecasts, By Offering (2020-2032) (USD Billion)
10.3.2.12.2 Switzerland Wireless Display Market Estimates and Forecasts, By End-Use (2020-2032) (USD Billion)
10.3.2.12.3 Switzerland Wireless Display Market Estimates and Forecasts, By Technology (2020-2032) (USD Billion)
10.3.2.13 Austria
10.3.2.13.1 Austria Wireless Display Market Estimates and Forecasts, By Offering (2020-2032) (USD Billion)
10.3.2.13.2 Austria Wireless Display Market Estimates and Forecasts, By End-Use (2020-2032) (USD Billion)
10.3.2.13.3 Austria Wireless Display Market Estimates and Forecasts, By Technology (2020-2032) (USD Billion)
10.3.2.14 Rest of Western Europe
10.3.2.14.1 Rest of Western Europe Wireless Display Market Estimates and Forecasts, By Offering (2020-2032) (USD Billion)
10.3.2.14.2 Rest of Western Europe Wireless Display Market Estimates and Forecasts, By End-Use (2020-2032) (USD Billion)
10.3.2.14.3 Rest of Western Europe Wireless Display Market Estimates and Forecasts, By Technology (2020-2032) (USD Billion)
10.4 Asia Pacific
10.4.1 Trends Analysis
10.4.2 Asia Pacific Wireless Display Market Estimates and Forecasts, by Country (2020-2032) (USD Billion)
10.4.3 Asia Pacific Wireless Display Market Estimates and Forecasts, By Offering (2020-2032) (USD Billion)
10.4.4 Asia Pacific Wireless Display Market Estimates and Forecasts, By End-Use (2020-2032) (USD Billion)
10.4.5 Asia Pacific Wireless Display Market Estimates and Forecasts, By Technology (2020-2032) (USD Billion)
10.4.6 China
10.4.6.1 China Wireless Display Market Estimates and Forecasts, By Offering (2020-2032) (USD Billion)
10.4.6.2 China Wireless Display Market Estimates and Forecasts, By End-Use (2020-2032) (USD Billion)
10.4.6.3 China Wireless Display Market Estimates and Forecasts, By Technology (2020-2032) (USD Billion)
10.4.7 India
10.4.7.1 India Wireless Display Market Estimates and Forecasts, By Offering (2020-2032) (USD Billion)
10.4.7.2 India Wireless Display Market Estimates and Forecasts, By End-Use (2020-2032) (USD Billion)
10.4.7.3 India Wireless Display Market Estimates and Forecasts, By Technology (2020-2032) (USD Billion)
10.4.8 Japan
10.4.8.1 Japan Wireless Display Market Estimates and Forecasts, By Offering (2020-2032) (USD Billion)
10.4.8.2 Japan Wireless Display Market Estimates and Forecasts, By End-Use (2020-2032) (USD Billion)
10.4.8.3 Japan Wireless Display Market Estimates and Forecasts, By Technology (2020-2032) (USD Billion)
10.4.9 South Korea
10.4.9.1 South Korea Wireless Display Market Estimates and Forecasts, By Offering (2020-2032) (USD Billion)
10.4.9.2 South Korea Wireless Display Market Estimates and Forecasts, By End-Use (2020-2032) (USD Billion)
10.4.9.3 South Korea Wireless Display Market Estimates and Forecasts, By Technology (2020-2032) (USD Billion)
10.4.10 Vietnam
10.4.10.1 Vietnam Wireless Display Market Estimates and Forecasts, By Offering (2020-2032) (USD Billion)
10.4.10.2 Vietnam Wireless Display Market Estimates and Forecasts, By End-Use (2020-2032) (USD Billion)
10.4.10.3 Vietnam Wireless Display Market Estimates and Forecasts, By Technology (2020-2032) (USD Billion)
10.4.11 Singapore
10.4.11.1 Singapore Wireless Display Market Estimates and Forecasts, By Offering (2020-2032) (USD Billion)
10.4.11.2 Singapore Wireless Display Market Estimates and Forecasts, By End-Use (2020-2032) (USD Billion)
10.4.11.3 Singapore Wireless Display Market Estimates and Forecasts, By Technology (2020-2032) (USD Billion)
10.4.12 Australia
10.4.12.1 Australia Wireless Display Market Estimates and Forecasts, By Offering (2020-2032) (USD Billion)
10.4.12.2 Australia Wireless Display Market Estimates and Forecasts, By End-Use (2020-2032) (USD Billion)
10.4.12.3 Australia Wireless Display Market Estimates and Forecasts, By Technology (2020-2032) (USD Billion)
10.4.13 Rest of Asia Pacific
10.4.13.1 Rest of Asia Pacific Wireless Display Market Estimates and Forecasts, By Offering (2020-2032) (USD Billion)
10.4.13.2 Rest of Asia Pacific Wireless Display Market Estimates and Forecasts, By End-Use (2020-2032) (USD Billion)
10.4.13.3 Rest of Asia Pacific Wireless Display Market Estimates and Forecasts, By Technology (2020-2032) (USD Billion)
10.5 Middle East and Africa
10.5.1 Middle East
10.5.1.1 Trends Analysis
10.5.1.2 Middle East Wireless Display Market Estimates and Forecasts, by Country (2020-2032) (USD Billion)
10.5.1.3 Middle East Wireless Display Market Estimates and Forecasts, By Offering (2020-2032) (USD Billion)
10.5.1.4 Middle East Wireless Display Market Estimates and Forecasts, By End-Use (2020-2032) (USD Billion)
10.5.1.5 Middle East Wireless Display Market Estimates and Forecasts, By Technology (2020-2032) (USD Billion)
10.5.1.6 UAE
10.5.1.6.1 UAE Wireless Display Market Estimates and Forecasts, By Offering (2020-2032) (USD Billion)
10.5.1.6.2 UAE Wireless Display Market Estimates and Forecasts, By End-Use (2020-2032) (USD Billion)
10.5.1.6.3 UAE Wireless Display Market Estimates and Forecasts, By Technology (2020-2032) (USD Billion)
10.5.1.7 Egypt
10.5.1.7.1 Egypt Wireless Display Market Estimates and Forecasts, By Offering (2020-2032) (USD Billion)
10.5.1.7.2 Egypt Wireless Display Market Estimates and Forecasts, By End-Use (2020-2032) (USD Billion)
10.5.1.7.3 Egypt Wireless Display Market Estimates and Forecasts, By Technology (2020-2032) (USD Billion)
10.5.1.8 Saudi Arabia
10.5.1.8.1 Saudi Arabia Wireless Display Market Estimates and Forecasts, By Offering (2020-2032) (USD Billion)
10.5.1.8.2 Saudi Arabia Wireless Display Market Estimates and Forecasts, By End-Use (2020-2032) (USD Billion)
10.5.1.8.3 Saudi Arabia Wireless Display Market Estimates and Forecasts, By Technology (2020-2032) (USD Billion)
10.5.1.9 Qatar
10.5.1.9.1 Qatar Wireless Display Market Estimates and Forecasts, By Offering (2020-2032) (USD Billion)
10.5.1.9.2 Qatar Wireless Display Market Estimates and Forecasts, By End-Use (2020-2032) (USD Billion)
10.5.1.9.3 Qatar Wireless Display Market Estimates and Forecasts, By Technology (2020-2032) (USD Billion)
10.5.1.10 Rest of Middle East
10.5.1.10.1 Rest of Middle East Wireless Display Market Estimates and Forecasts, By Offering (2020-2032) (USD Billion)
10.5.1.10.2 Rest of Middle East Wireless Display Market Estimates and Forecasts, By End-Use (2020-2032) (USD Billion)
10.5.1.10.3 Rest of Middle East Wireless Display Market Estimates and Forecasts, By Technology (2020-2032) (USD Billion)
10.5.2 Africa
10.5.2.1 Trends Analysis
10.5.2.2 Africa Wireless Display Market Estimates and Forecasts, by Country (2020-2032) (USD Billion)
10.5.2.3 Africa Wireless Display Market Estimates and Forecasts, By Offering (2020-2032) (USD Billion)
10.5.2.4 Africa Wireless Display Market Estimates and Forecasts, By End-Use (2020-2032) (USD Billion)
10.5.2.5 Africa Wireless Display Market Estimates and Forecasts, By Technology (2020-2032) (USD Billion)
10.5.2.6 South Africa
10.5.2.6.1 South Africa Wireless Display Market Estimates and Forecasts, By Offering (2020-2032) (USD Billion)
10.5.2.6.2 South Africa Wireless Display Market Estimates and Forecasts, By End-Use (2020-2032) (USD Billion)
10.5.2.6.3 South Africa Wireless Display Market Estimates and Forecasts, By Technology (2020-2032) (USD Billion)
10.5.2.7 Nigeria
10.5.2.7.1 Nigeria Wireless Display Market Estimates and Forecasts, By Offering (2020-2032) (USD Billion)
10.5.2.7.2 Nigeria Wireless Display Market Estimates and Forecasts, By End-Use (2020-2032) (USD Billion)
10.5.2.7.3 Nigeria Wireless Display Market Estimates and Forecasts, By Technology (2020-2032) (USD Billion)
10.5.2.8 Rest of Africa
10.5.2.8.1 Rest of Africa Wireless Display Market Estimates and Forecasts, By Offering (2020-2032) (USD Billion)
10.5.2.8.2 Rest of Africa Wireless Display Market Estimates and Forecasts, By End-Use (2020-2032) (USD Billion)
10.5.2.8.3 Rest of Africa Wireless Display Market Estimates and Forecasts, By Technology (2020-2032) (USD Billion)
10.6 Latin America
10.6.1 Trends Analysis
10.6.2 Latin America Wireless Display Market Estimates and Forecasts, by Country (2020-2032) (USD Billion)
10.6.3 Latin America Wireless Display Market Estimates and Forecasts, By Offering (2020-2032) (USD Billion)
10.6.4 Latin America Wireless Display Market Estimates and Forecasts, By End-Use (2020-2032) (USD Billion)
10.6.5 Latin America Wireless Display Market Estimates and Forecasts, By Technology (2020-2032) (USD Billion)
10.6.6 Brazil
10.6.6.1 Brazil Wireless Display Market Estimates and Forecasts, By Offering (2020-2032) (USD Billion)
10.6.6.2 Brazil Wireless Display Market Estimates and Forecasts, By End-Use (2020-2032) (USD Billion)
10.6.6.3 Brazil Wireless Display Market Estimates and Forecasts, By Technology (2020-2032) (USD Billion)
10.6.7 Argentina
10.6.7.1 Argentina Wireless Display Market Estimates and Forecasts, By Offering (2020-2032) (USD Billion)
10.6.7.2 Argentina Wireless Display Market Estimates and Forecasts, By End-Use (2020-2032) (USD Billion)
10.6.7.3 Argentina Wireless Display Market Estimates and Forecasts, By Technology (2020-2032) (USD Billion)
10.6.8 Colombia
10.6.8.1 Colombia Wireless Display Market Estimates and Forecasts, By Offering (2020-2032) (USD Billion)
10.6.8.2 Colombia Wireless Display Market Estimates and Forecasts, By End-Use (2020-2032) (USD Billion)
10.6.8.3 Colombia Wireless Display Market Estimates and Forecasts, By Technology (2020-2032) (USD Billion)
10.6.9 Rest of Latin America
10.6.9.1 Rest of Latin America Wireless Display Market Estimates and Forecasts, By Offering (2020-2032) (USD Billion)
10.6.9.2 Rest of Latin America Wireless Display Market Estimates and Forecasts, By End-Use (2020-2032) (USD Billion)
10.6.9.3 Rest of Latin America Wireless Display Market Estimates and Forecasts, By Technology (2020-2032) (USD Billion)
11. Company Profiles
11.1 Actiontec Electronics, Inc.
11.1.1 Company Overview
11.1.2 Financial
11.1.3 Products/ Services Offered
11.1.4 SWOT Analysis
11.2 Apple Inc.
11.2.1 Company Overview
11.2.2 Financial
11.2.3 Products/ Services Offered
11.2.4 SWOT Analysis
11.3 Belkin
11.3.1 Company Overview
11.3.2 Financial
11.3.3 Products/ Services Offered
11.3.4 SWOT Analysis
11.4 Google LLC
11.4.1 Company Overview
11.4.2 Financial
11.4.3 Products/ Services Offered
11.4.4 SWOT Analysis
11.5 IOGEAR
11.5.1 Company Overview
11.5.2 Financial
11.5.3 Products/ Services Offered
11.5.4 SWOT Analysis
11.6 Intel Corporation
11.6.1 Company Overview
11.6.2 Financial
11.6.3 Products/ Services Offered
11.6.4 SWOT Analysis
11.7 Lattice Semiconductor
11.7.1 Company Overview
11.7.2 Financial
11.7.3 Products/ Services Offered
11.7.4 SWOT Analysis
11.8 LG Electronics
11.8.1 Company Overview
11.8.2 Financial
11.8.3 Products/ Services Offered
11.8.4 SWOT Analysis
11.9 Marvell
11.9.1 Company Overview
11.9.2 Financial
11.9.3 Products/ Services Offered
11.9.4 SWOT Analysis
11.10 MediaTek Inc.
11.10.1 Company Overview
11.10.2 Financial
11.10.3 Products/ Services Offered
11.10.4 SWOT Analysis
12. Use Cases and Best Practices
13. Conclusion
An accurate research report requires proper strategizing as well as implementation. There are multiple factors involved in the completion of good and accurate research report and selecting the best methodology to compete the research is the toughest part. Since the research reports we provide play a crucial role in any company’s decision-making process, therefore we at SNS Insider always believe that we should choose the best method which gives us results closer to reality. This allows us to reach at a stage wherein we can provide our clients best and accurate investment to output ratio.
Each report that we prepare takes a timeframe of 350-400 business hours for production. Starting from the selection of titles through a couple of in-depth brain storming session to the final QC process before uploading our titles on our website we dedicate around 350 working hours. The titles are selected based on their current market cap and the foreseen CAGR and growth.
The 5 steps process:
Step 1: Secondary Research:
Secondary Research or Desk Research is as the name suggests is a research process wherein, we collect data through the readily available information. In this process we use various paid and unpaid databases which our team has access to and gather data through the same. This includes examining of listed companies’ annual reports, Journals, SEC filling etc. Apart from this our team has access to various associations across the globe across different industries. Lastly, we have exchange relationships with various university as well as individual libraries.
Step 2: Primary Research
When we talk about primary research, it is a type of study in which the researchers collect relevant data samples directly, rather than relying on previously collected data. This type of research is focused on gaining content specific facts that can be sued to solve specific problems. Since the collected data is fresh and first hand therefore it makes the study more accurate and genuine.
We at SNS Insider have divided Primary Research into 2 parts.
Part 1 wherein we interview the KOLs of major players as well as the upcoming ones across various geographic regions. This allows us to have their view over the market scenario and acts as an important tool to come closer to the accurate market numbers. As many as 45 paid and unpaid primary interviews are taken from both the demand and supply side of the industry to make sure we land at an accurate judgement and analysis of the market.
This step involves the triangulation of data wherein our team analyses the interview transcripts, online survey responses and observation of on filed participants. The below mentioned chart should give a better understanding of the part 1 of the primary interview.
Part 2: In this part of primary research the data collected via secondary research and the part 1 of the primary research is validated with the interviews from individual consultants and subject matter experts.
Consultants are those set of people who have at least 12 years of experience and expertise within the industry whereas Subject Matter Experts are those with at least 15 years of experience behind their back within the same space. The data with the help of two main processes i.e., FGDs (Focused Group Discussions) and IDs (Individual Discussions). This gives us a 3rd party nonbiased primary view of the market scenario making it a more dependable one while collation of the data pointers.
Step 3: Data Bank Validation
Once all the information is collected via primary and secondary sources, we run that information for data validation. At our intelligence centre our research heads track a lot of information related to the market which includes the quarterly reports, the daily stock prices, and other relevant information. Our data bank server gets updated every fortnight and that is how the information which we collected using our primary and secondary information is revalidated in real time.
Step 4: QA/QC Process
After all the data collection and validation our team does a final level of quality check and quality assurance to get rid of any unwanted or undesired mistakes. This might include but not limited to getting rid of the any typos, duplication of numbers or missing of any important information. The people involved in this process include technical content writers, research heads and graphics people. Once this process is completed the title gets uploader on our platform for our clients to read it.
Step 5: Final QC/QA Process:
This is the last process and comes when the client has ordered the study. In this process a final QA/QC is done before the study is emailed to the client. Since we believe in giving our clients a good experience of our research studies, therefore, to make sure that we do not lack at our end in any way humanly possible we do a final round of quality check and then dispatch the study to the client.
Key Segments:
By Offering
Hardware
Software
Services
By Technology
Airplay
Miracast
Google Cast
Others
By End-use
Residential
Commercial
Request for Segment Customization as per your Business Requirement: Segment Customization Request
Regional Coverage:
North America
US
Canada
Mexico
Europe
Eastern Europe
Poland
Romania
Hungary
Turkey
Rest of Eastern Europe
Western Europe
Germany
France
UK
Italy
Spain
Netherlands
Switzerland
Austria
Rest of Western Europe
Asia Pacific
China
India
Japan
South Korea
Vietnam
Singapore
Australia
Rest of Asia Pacific
Middle East & Africa
Middle East
UAE
Egypt
Saudi Arabia
Qatar
Rest of Middle East
Africa
Nigeria
South Africa
Rest of Africa
Latin America
Brazil
Argentina
Colombia
Rest of Latin America
Request for Country Level Research Report: Country Level Customization Request
Available Customization
With the given market data, SNS Insider offers customization as per the company’s specific needs. The following customization options are available for the report:
Detailed Volume Analysis
Criss-Cross segment analysis (e.g. Product X Application)
Competitive Product Benchmarking
Geographic Analysis
Additional countries in any of the regions
Customized Data Representation
Detailed analysis and profiling of additional market players
The Smart Home Projector Market size was valued at USD 761.40 million in 2023. It is expected to hit USD 3250.52 million by 2032 and grow at a CAGR of 17.5% over the forecast period of 2024-2032.
The Radiation Hardened Electronics Market Size was valued at USD 1.60 billion in 2023 and is expected to grow at 4.45% CAGR to reach USD 2.35 billion by 2032.
The Shock Sensor Market Size was valued at USD 1062.16 Million in 2023 and is expected to grow at a CAGR of 22.31% to reach USD 6504.91 Million by 2032.
Data Center Interconnect Market Size was valued at USD 11.45 billion in 2023 and is expected to reach USD 37.53 billion by 2032 and grow at a CAGR of 14.1% over the forecast period 2024-2032.
The Fingerprint Sensor Market Size was valued at USD 3.9 billion in 2023 and is expected to grow at a CAGR of 6.65% to reach USD 6.96 billion by 2032.
The Industrial Metrology Market size was valued at USD 14 billion in 2023 and is expected to grow to USD 23.4 billion by 2031 and grow at a CAGR of 6.6 % over the forecast period of 2024-2031.
Hi! Click one of our member below to chat on Phone