Wireless Charging Market Size & Overview:
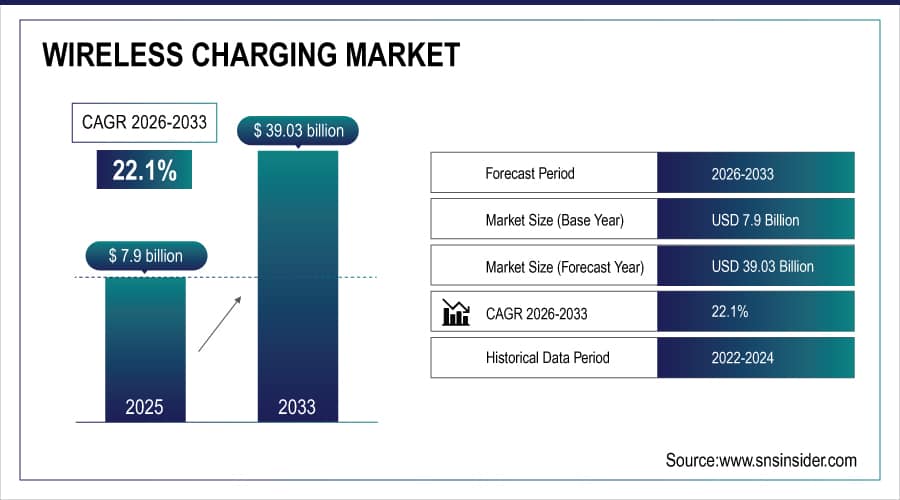
The Wireless Charging Market was valued at USD 7.9 billion in 2025E and is expected to reach USD 39.03 billion by 2033 and grow at a CAGR of 22.1% over the forecast period 2026-2033.
The growth in Wireless Charging is driven by emerging trends in wireless charging, increased integration with electric vehicles (EV), furniture and infrastructure, long-range wireless charging, and Bi-directional wireless charging. Wireless charging eliminates the need to fumble with cables and connect the charger to the car's charging port. This convenience factor and potential automation features like self-parking cars aligning with charging pads make it highly attractive. Wireless charging eliminates the need for fumbling with cables, improving user experience.
Market Size and Forecast: 2025E
-
Market Size in 2025E USD 7.9 Billion
-
Market Size by 2033 USD 39.03 Billion
-
CAGR of 22.1% From 2026 to 2033
-
Base Year 2025E
-
Forecast Period 2026-2033
-
Historical Data 2021-2024
To Get More Information On Wireless Charging Market - Request Free Sample Report
Wireless Charging Market Trends:
-
Growing adoption of fast and high-efficiency wireless charging technologies using resonant inductive coupling and radio frequency solutions.
-
Increasing smartphone compatibility with Qi wireless charging standards, making wireless charging a mainstream feature across price segments.
-
Rising demand for cable-free convenience as consumers prefer seamless and clutter-free charging solutions.
-
Expansion of wireless charging use across IoT devices, wearables, and electric vehicles, driving innovation and scalability.
-
Continuous improvement in energy transfer efficiency and charging speed to support larger batteries and power-intensive next-generation devices.
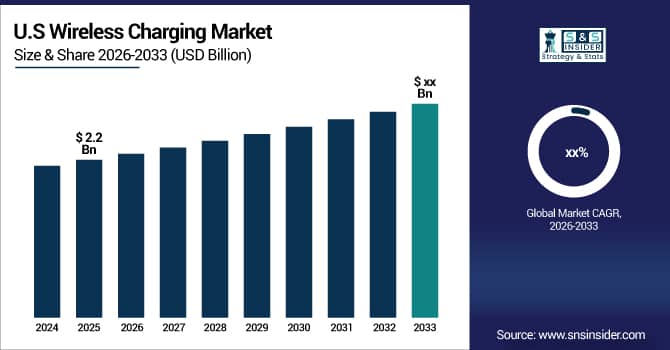
The U.S. Wireless Charging Market is valued at approximately USD 2.2 billion in 2025E, driven by high smartphone penetration and widespread adoption of Qi-enabled devices. Strong consumer preference for convenient, cable-free charging, early adoption of emerging technologies, and the presence of leading innovators such as Apple and Energous continue to support steady market growth across consumer electronics and automotive applications.
Wireless Charging Market Growth Drivers:
-
Developing faster and more efficient wireless charging technology.
The wireless charging market is experiencing a significant rise in popularity due to the rapid development of faster and more efficient wireless charging. First of all, the increasing need for convenience and mobility drives both customers and companies toward the adoption of wireless charging, as this technology is superior to traditional charging by eliminating cables. Second, the higher speed and thus greater efficiency of wireless charging solutions answer the key consumers’ need, offering to quickly replenish power for various new generation devices with much bigger and complex batteries, as productivity of smartphones, tablets, laptops, and other explorable gadgets grows. Technologies becoming more and more available to use, while the implementation of resonant inductive coupling and radio frequency delivers quicker charging times and greater efficiency of energy transfer. The rise of IoT devices, wearables, electric vehicles, and other types of devices only strengthens the positioning for more advanced versions of wireless charging.
Wireless Charging Market Restraints:
-
Limitation in the range of wireless chargers
The limited range of the wireless charging market is related to the limitation that efficient transmission of power requires the proximity of the charging platform or station and the device being charged. Unlike wired options, which offer more flexibility in positioning, wireless charging systems have a limited range, which affects ease of use and available space. Precise alignment between the device and the charging base is essential for efficient charging, and deviations can disrupt the process.
Wireless Charging Market Segment Analysis:
By Technology
Inductive technology dominated the market in 2025E with a market share of over 35%, due to its efficiency, convenience, and widespread adoption. In particular, the induction systems used in the Qi wireless charging standard ensure a tight connection between the transmitter and receiver coils, minimizing energy loss during charging. The technology is known for its alignment tolerance, which gives users some flexibility in positioning the device on the charging base.
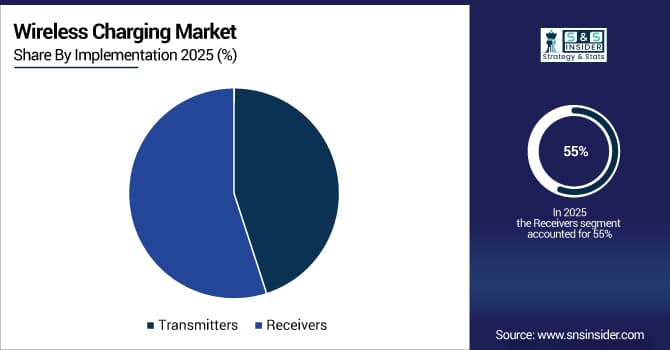
By Implementation
The receiver segment held a market share of over 55% in 2025E and dominated the market. Wireless charging receivers are the core element embedded within devices that enable them to receive wireless charging. Without receivers, wireless charging wouldn't be possible. Receivers adhere to standardized specifications like Qi, ensuring compatibility with various wireless charging transmitters. This widespread compatibility fuels market growth. also, the increasing adoption of smart and portable devices with wireless charging capabilities, such as smartphones, smartwatches, and earbuds, directly translates to a higher demand for receivers.
By Discrete Industry
The automotive application led the market in 2025E with a market share of over 40%. The increasing adoption of electric vehicles (EVs) is a major driver for wireless charging in the automotive industry. EVs eliminate tailpipe emissions, but charging can be inconvenient with cables. Wireless charging offers a more seamless and user-friendly experience.
Wireless Charging Market Regional Analysis:
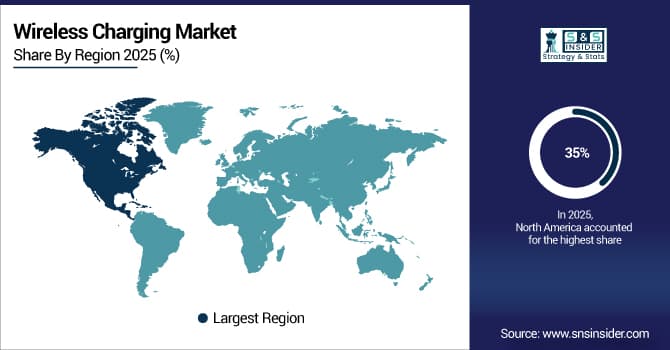
North America Wireless Charging Market Insights
North America dominated the market with a market share of around 35% in 2025E. It has a high penetration rate of smartphones, many of which are equipped with wireless charging capabilities. This creates a strong demand for wireless chargers in the region. Several major players in the wireless charging market are headquartered in North America, including Apple, Samsung, and Energous. These companies drive innovation and contribute significantly to the market's growth in the region. also, North American consumers are generally receptive to adopting new technologies, including wireless charging. This early adoption trend helps propel market growth.
Get Customized Report as Per Your Business Requirement - Enquiry Now
Asia Pacific Wireless Charging Market Insights
The Asia Pacific is going to be the fastest-growing market in the wireless charging markets during the forecast period 2026-2033. Both Japan and India stand out among the fastest-growing economies in the world. The widespread adoption of smartphones in major markets such as China, South Korea, and Japan has increased the demand for convenient charging solutions. Innovative technologies are easily adopted by technology consumers in the region, which is driving the rapid adoption of wireless charging. In addition, the presence of major players in the industry and the region's status as a manufacturing hub facilitates the production and distribution of wireless charging products. The proliferation of electric vehicles in the Asia-Pacific region will further increase the need for wireless charging infrastructure to match the broader shift to sustainable transport.
Europe Wireless Charging Market Insights
The Europe wireless charging market is growing steadily, driven by strong adoption of smartphones, wearables, and electric vehicles, along with supportive regulatory standards such as Qi. Increasing focus on convenience, sustainability, and cable-free charging solutions fuels demand. Technological advancements and integration of wireless charging in consumer electronics and automotive interiors further support market expansion across key countries.
Latin America (LATAM) and Middle East & Africa (MEA) Wireless Charging Market Insights
The LATAM and MEA wireless charging market is witnessing gradual growth, supported by rising smartphone penetration, urbanization, and improving consumer electronics adoption. Increasing awareness of wireless charging convenience, expanding retail electronics markets, and growing investments in smart infrastructure and automotive technologies are driving demand, particularly in Brazil, Mexico, the UAE, and Saudi Arabia.
Wireless Charging Market Key Players:
The major key players are Samsung Electronics Co., Qualcomm Incorporated Integrated Device Technology, Fulton Innovation LLC, WiTricity Corporation, Murata Manufacturing Co. Ltd., Sony Corporation, Texas Instruments, Energizer Holdings, Inc, Renesas Electronics Corporation, Powermat Technologies Ltd and others players.
Competitive Landscape for Wireless Charging Market:
Ossia Inc. is a U.S.– based technology company pioneering Cota® Real Wireless Power™, a patented RF-based system that delivers power over the air without cables, pads, or line-of-sight. Founded in 2008, Ossia’s smart antenna technology enables targeted wireless power delivery to multiple devices, supporting innovation in IoT, consumer electronics, and smart environments by keeping devices continuously charged and connected
-
In June 2023, Ossia Inc. announced of collaboration with Nichicon Corporation. Nichicon promotes Ossian Cota Real Wireless Power using Cota technology with Nichicon SLB batteries. This partnership produces a Nichicon-branded battery near the Cota Power Transmitter that is always powered. With Cota technology, the SLB battery can be continuously charged, which ensures greater convenience and efficiency when switching on and charging devices.
Samsung Electronics is a global leader in the wireless charging market, integrating advanced wireless charging technology across its smartphones, wearables, and accessories. The company supports Qi standards and invests heavily in fast and efficient wireless power solutions. Samsung’s strong R&D capabilities and broad consumer electronics portfolio drive widespread adoption of convenient, cable-free charging technologies worldwide.
-
In February 2023, SAMSUNG launched the SmartThings Hub, a modified version of Samsung's existing wireless charger. The SmartThings hub and wireless charger in one Cheapest Matter controller and Thread border router can be combined with smart home automation to charge your Galaxy phone.
| Report Attributes | Details |
|---|---|
| Market Size in 2025E | USD 7.9 Billion |
| Market Size by 2033 | USD 39.03 Billion |
| CAGR | CAGR of 22.1% From 2026 to 2033 |
| Base Year | 2025E |
| Forecast Period | 2026-2033 |
| Historical Data | 2021-2024 |
| Report Scope & Coverage | Market Size, Segments Analysis, Competitive Landscape, Regional Analysis, DROC & SWOT Analysis, Forecast Outlook |
| Key Segments | • By Technology (Inductive, Magnetic Resonance, Radio Frequency, Others) • By Implementation (Transmitters, Receivers) • By Discrete Industry (Automotive, Consumer Electronics, Healthcare, Other Applications (Industrial, Aerospace) |
| Regional Analysis/Coverage | North America (US, Canada), Europe (Germany, UK, France, Italy, Spain, Russia, Poland, Rest of Europe), Asia Pacific (China, India, Japan, South Korea, Australia, ASEAN Countries, Rest of Asia Pacific), Middle East & Africa (UAE, Saudi Arabia, Qatar, South Africa, Rest of Middle East & Africa), Latin America (Brazil, Argentina, Mexico, Colombia, Rest of Latin America). |
| Company Profiles | Samsung Electronics Co., Qualcomm Incorporated Integrated Device Technology, Fulton Innovation LLC, WiTricity Corporation, Murata Manufacturing Co. Ltd., Sony Corporation, Texas Instruments, Energizer Holdings, Inc, Renesas Electronics Corporation, Powermat Technologies Ltd |
