Wire-to-Board Connector Market Analysis:
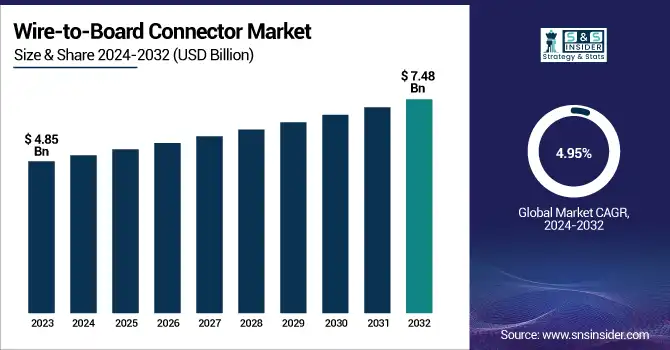
The Wire-to-Board Connector Market Size was valued at USD 4.85 billion in 2023 and is expected to reach USD 7.48 billion by 2032, growing at a CAGR of 4.95% over the forecast period 2024-2032. Growth in fab and production efficiency are causing the Wire-to-Board Connector Market to evolve, with new fab automation and a broad range of wire-to-board connector packaging options being offered by manufacturers to meet growing needs. The industry is pivoting toward connectors with higher density and miniaturization for small-footprint designs including for wearables, IoT, and next-gen electronics.
To Get more information on Wire-to-Board Connector Market - Request Free Sample Report
Moreover, the growing use of high voltage and high current connectors is growing widely in EVs, industrial automation, and power electronics applications. It observed that higher demand for smart and modular specialty connectors integrated with sensors, tool-free installation, and reconfigurable design to provide increased reliability, ease of use, and versatility across various applications is fuelling growth in the market. The U.S. wire-to-board connector market witnessed increased demand in 2024, particularly in the automotive industry, with around 1.2 million electric vehicle (EV) manufacturing units being produced. There was a need for sophisticated connectors to handle the power supply and data exchange. Moreover, new 5G infrastructure with over 100K new small cell sites deployed each required reliable wire-to-board connectors to ensure performance.
The U.S. Wire-to-Board Connector Market is estimated to be USD 0.83 Billion in 2023 and is projected to grow at a CAGR of 4.80%. The wire-to-board connector market in the U.S. is driven by the increase in production of EVs, significant expansion of 5G networks, rising industrial automation, and the demand for miniature connectors in medical and consumer electronics products.
Wire-to-Board Connector Market Dynamics
Key Drivers:
-
Rising Demand for Compact High-Performance Wire-to-Board Connectors Driven by EVs 5G and IoT Growth
The growth of the wire-to-board connector market is primarily attributed to the increasing need for compact and high-performance electronic components in various applications such as consumer electronics, automotive, industrial automation, and telecommunication sectors. An increasing demand for accurate and high-speed connectors with small dimensions is being driven by the widespread adoption of electric vehicles (EVs), 5G technology, and IoT devices. The automotive industry is experiencing an increased demand for effective power transmission and data communication solutions due to the transition to electric and hybrid cars which is also having a positive effect in market expansion. Furthermore, miniaturized and high-density connectors are increasingly preferred in medical imaging, wearable health devices, and patient monitoring systems in the medical industry.
Restrain:
-
Miniaturization Challenges Drive Demand for High-Density Reliable Wire-to-Board Connectors in Evolving Industries
Although Challenges prevail due to miniaturization and high-density integration, which in turn contributes to the miniaturization of electronic devices, in the wire-to-board connector market, as users becoming increasingly dependent on smaller electronic devices, the need for compact and high-density connectors is growing. This is a significant engineering challenge to keep signal integrity and power efficiency in smaller form factors without sacrificing reliability. With automotive, medical, and industrial applications becoming increasingly complex, the demand is for connectors with increased pin density and shielding performance for EMI shielding. Finally, the restrictive demands of safety, quality, and environmental compliance from the industry make it a tough production environment with complex production processes and testing requirements.
Opportunity:
-
High-Performance Materials Smart Connectors and Emerging Economies Drive Growth in Wire-to-Board Market
Market opportunities exist in the growing use of high-performance materials for improved durability and performance. Industrial applications are increasingly pushing for smart and robust connectors as we move towards automated manufacturing and Industry 4.0. Exploding demand across emerging economies, mainly in Asia-Pacific has emerged as a lucrative source of growth owing to increasing electronics manufacturing hubs in China, Japan, and South Korea. Other trends include the development of high-speed, high-power, and waterproof connectors, that can pave the way for innovations in the aerospace and defense domain along with harsh-environment applications.
Challenges:
-
High-Speed Data Demand Harsh Environments and Supply Chain Risks Challenge Wire-to-Board Connector Market
The fundamental challenge is, the increasing demand for high-speed data transmission that necessitates the need for connectors with higher electrical performance and mapping of high-frequency signal degradation. In many applications, the operating environment is harsh, requiring connectors to absorb external forces such as vibrations, survive extreme conditions as well, and react to moisture, which creates a big challenge for durability in industries such as aerospace, defense, and automotive. The market also faces risks from factors such as supply chain disruptions, geopolitical uncertainties, and volatility in the availability of raw materials, leading to `production cycles and delivery timelines. Here, manufacturers have to innovate in materials, improve design capabilities, and partner with end-users and technology providers.
Wire-to-Board Connector Industry Segments Analysis
By Style
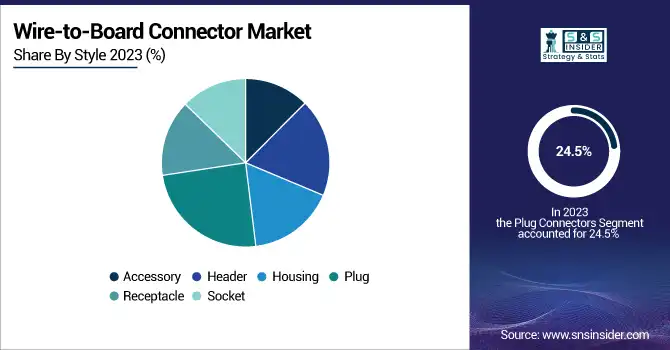
Plug connectors are the largest segment among wire-to-board connectors, which accounted for 24.5% of the total market in 2023. Due to high penetration in consumer electronics, industrial automation, automotive, and data communication systems, they have been the most dominant technology. Plug connectors sit on top when it comes to maintaining a secure and reliable connection, which is why they are ideal for applications involving frequent mating and unmating such as power supplies, circuit boards, or modular electronic systems. The increased demand for these materials in electric vehicles (EVs), telecom infrastructure, and smart devices has given them an additional foothold in the market.
The housing segment is anticipated to account for the fastest CAGR throughout the forecast period, due to the growing demand for robust and protective connector solutions in industrial, medical, and high-voltage applications. Housing connectors are key to insulating and protecting against EMI, and from the environment, making this advanced electronic system component indispensable in challenging operating conditions in multiple industry verticals.
By Pitch Size
The 2.54 mm pitch size dominated the wire-to-board connector market in 2023 with a 15.7% share. This is a very common pitch size used in consumer electronics, industrial automation, automotive, and telecom applications since it provides a good balance between compactness and reliability in power transmission. A well-known and established choice for PCB interconnects, prototyping boards, and modular electronic systems, it is a typical solution for industries demanding high repeatability and performance in their electrical connections. 2.54mm connectors are among the most popular types in the world today, due in part to their flexibility and affordability.
The 0.8mm pitch size is anticipated to have the largest CAGR from 2024-2032. This is leading to customers using more miniaturized high-density connectors to accommodate the increasing demand for wearables and IoT devices, medical equipment, and compact consumer gadgets. Thus, high-speed data transmission along with flexible PCB designs are driving the demand for 0.8mm connectors, moreover, due to ongoing technological developments.
By Application
The computer and peripherals Segment Dominated the Wire-to-Board Connector Market with a 24.3% Total Share in 2023. Their position in the market has been further solidified due to their extensive application in laptops and desktops, storage devices, and peripheral accessories like keyboards, printers, and external drives. As high-speed data transmission and power, delivery become more critical to application needs and the demand for more compact designs increases, wire-to-board connectors are essential to ensuring connectivity across a variety of consumer and enterprise computing applications. This is transformed into dominance with the increasing adoption of gaming systems, cloud-based computing, and AI-driven hardware.
The data/telecom segment is anticipated to register the highest CAGR from 2024 to 2032, owing to growth in network rollout for 5G, fiber-optic communication, and cloud data centers. In telecom infrastructure, the demand for high-bandwidth, low-latency connectivity is increasing the requirement for high-performance high-density connectors. Moreover, the evolution of edge computing and IoT networks is catalyzing the adoption of next-generation connector solutions in the telecom industry.
Wire-to-Board Connector Market Regional Overview
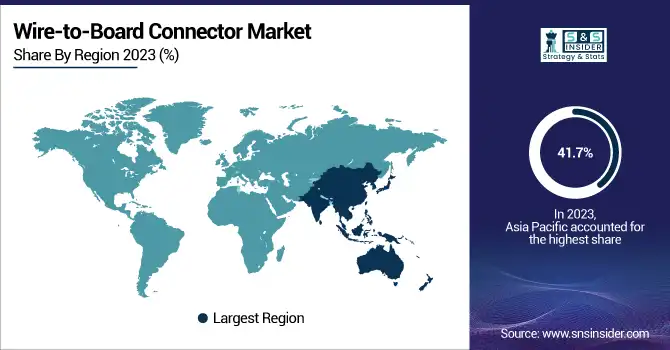
Asia Pacific accounted for the largest share of the wire-to-board connector market, 41.7% in 2023, and is anticipated to garner the highest CAGR from 2024 to 2032. This saturation stems from the region’s dominance in electronics manufacturing, automotive, and industrial automation. The demand for advanced connectors in China, Japan, South Korea, and India, major semiconductor, consumer electronics, and telecom infrastructure growth centers, has been spurring the expansion largely. Market growth in this region is being compounded by a faster deployment of 5G networks, cloud computing, and IoT ecosystems. The leading manufacturers of PCBs and semiconductors such as Foxconn, BYD Electronics, and Luxshare Precision in China are encouraging high-speed connectors. With new South Korean initiatives at Samsung and LG driving innovation in high-performance smartphones, laptops, and notebooks, the need for low-profile, high-density connectors is great. In the automotive segment, Japan's Toyota & Honda and India's Tata Motors & Mahindra are swiftly adapting EV & autonomous driving technologies which in turn are expected to strengthen the wire-to-board connectors demand in vehicles for electronics.
Key Players Listed Wire-to-Board Connector Market are:
-
TE Connectivity (Economy Power (EP) Connectors)
-
Molex (PicoBlade Connectors)
-
Amphenol (Minitek 2.00mm Wire-to-Board Connector)
-
3M (3M Wiremount Socket, 3000 Series)
-
Samtec (Tiger Eye Series)
-
J.S.T. MFG. Co. Ltd (PH Series)
-
HARTING Technology Group (har-flex Series)
-
ERNI Electronics (MiniBridge Koshiri)
-
Kyocera Corporation (5811 Series)
-
Phoenix Contact (COMBICON Connectors)
-
WAGO Corporation (WAGO 2060 Series)
-
Hirose Electric Co. Ltd (DF13 Series)
-
Würth Elektronik (WR-WTB Series)
-
E-tec Interconnect (Mini-Flex IDC Connectors)
-
I-PEX (ISH Series)
Recent Trends
-
In January 2025, Molex launched its MMCX Power over Coax (PoC) solution, featuring a full-locking mechanism for reliable RF connections and uninterrupted power delivery in compact, dynamic environments.
-
In February 2024, Kyocera launched the 5814 Series, a 0.3mm pitch board-to-board connector with a 0.6mm stacking height, designed for compact electronics like smartphones and wearables.
| Report Attributes | Details |
|---|---|
| Market Size in 2023 | USD 4.85 Billion |
| Market Size by 2032 | USD 7.48 Billion |
| CAGR | CAGR of 4.95% From 2024 to 2032 |
| Base Year | 2023 |
| Forecast Period | 2024-2032 |
| Historical Data | 2020-2022 |
| Report Scope & Coverage | Market Size, Segments Analysis, Competitive Landscape, Regional Analysis, DROC & SWOT Analysis, Forecast Outlook |
| Key Segments | • By Style (Accessory, Header, Housing, Plug, Receptacle, Socket) • By Pitch Size (0.8mm, 1.0mm, 1.25mm, 1.27mm, 2.0mm, 2.5mm, 2.54mm, 3.3mm, 3.96mm, 5.0mm, 7.92mm, 10.16mm) • By Application (Computer and Peripherals, Medical, Industrial and Instrumentation, Data/Telecom, Automotive, Aerospace and Defense, Others) |
| Regional Analysis/Coverage | North America (US, Canada, Mexico), Europe (Eastern Europe [Poland, Romania, Hungary, Turkey, Rest of Eastern Europe] Western Europe] Germany, France, UK, Italy, Spain, Netherlands, Switzerland, Austria, Rest of Western Europe]), Asia Pacific (China, India, Japan, South Korea, Vietnam, Singapore, Australia, Rest of Asia Pacific), Middle East & Africa (Middle East [UAE, Egypt, Saudi Arabia, Qatar, Rest of Middle East], Africa [Nigeria, South Africa, Rest of Africa], Latin America (Brazil, Argentina, Colombia, Rest of Latin America) |
| Company Profiles | TE Connectivity, Molex, Amphenol, 3M, Samtec, J.S.T. MFG. Co. Ltd, HARTING Technology Group, ERNI Electronics, Kyocera Corporation, Phoenix Contact, WAGO Corporation, Hirose Electric Co. Ltd, Würth Elektronik, E-tec Interconnect, I-PEX. |
