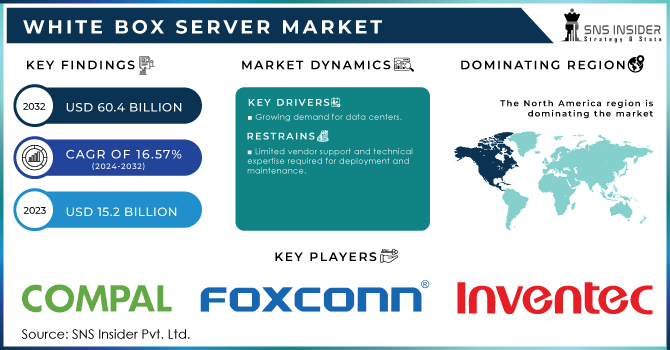
White Box Server Market Size was valued at USD 5.53 Billion in 2023 and is expected to reach USD 20.35 Billion by 2032 and grow at a CAGR of 15.58% over the forecast period 2024-2032.The research shows increasing demand due to rising data center deployments. It offers flexibility for enterprises seeking customizable server solutions. Open-source architecture adoption and increased demand for hyper-scale data centers drive the market forward. Market trends indicate higher adoption rates in cloud-based sectors, with emerging nations focusing on next-generation server technology deployments.
Get more Information on White Box Server Market - Request Free Sample Report
Drivers:
The Increasing Adoption Of Cloud Computing And Data Centers Across The World Drives The Market.
The White Box Server Market is growing because of the adoption of cloud computing and the development of data centers. Google, Amazon, and Microsoft are companies that are now looking for more efficient and cost-effective server solutions to manage cloud workloads. White box servers provide customization, scalability, and reduced costs to meet these demands. Governments also focus on developing digital infrastructure; for example, the U.S. government allocated more than $1.7 billion in recent budgets to cloud computing initiatives. China's Digital Infrastructure Plan is also strongly focused on cloud and data centers, further fueling demand for white box servers.
Restrain:
The Limited Support And Interoperability With Proprietary Hardware Ecosystems.
White box servers generally come with open-source architectures and can be very challenging to be fully incorporated into traditional IT systems. Most enterprises are afraid to embrace open-source solutions because they fear that incorporation will be incompatible in software-dependent vendor ecosystems. This becomes a problem for banking and healthcare due to the high security and reliable hardware requirements. The European Union's cybersecurity directives emphasize strict compliance, further limiting white box adoption due to perceived risks. Administrators require further special skills to manage such systems, increasing their complexity and operations.
Opportunities:
Every data center operator worldwide keeps energy efficiency at the top of their priorities.
Governments and organizations propose sustainable solutions in reaction to growing environmental concerns and stricter regulations. For example, the European Green Deal requires massive reductions in carbon content, and businesses are motivated to implement energy-friendly IT infrastructure. White box servers, with a design that allows for customization, including open source, enable organizations to build their systems optimized to consume less energy. The future of the market is bright with more data centers embracing these green strategies. Secondly, increasing electricity prices worldwide spur demand for efficient alternatives, hence white box servers.
Challenges:
White Box Server Market will face consistent quality across a number of different hardware suppliers.
White box servers are often obtained from a number of different manufacturers, which creates the potential for differences in quality and performance. This fragmentation results in higher failure rates, less efficient systems, and higher maintenance costs. The latest U.S. government reports on IT reliability have indicated that hardware inconsistencies account for more than 22% of system downtimes in data centers. Organizations relying on smooth operations, such as e-commerce sites and financial organizations, are exposed to risks if they deploy white box systems without standardized quality controls. Improved vendor certification processes and strict quality benchmarks are necessary to maintain server reliability.
By Server Type
In the year 2023, data center was in the dominant segment, accounting for 63% of the share. This supremacy is because demand for scalable server solutions and its cost-effectiveness is rising up to support extensive cloud services as well as other enterprise data management needs. The need for high-density computing and efficient IT infrastructure in hyper-scale environments also contributes to the data center segment's leadership.
On the other hand, the enterprise custom segment is projected to grow with the fastest CAGR of 4.96% from 2024 to 2032. Enterprises are increasingly adopting custom server solutions to meet specific operational demands, offering better flexibility, enhanced performance, and lower total ownership costs. These solutions are especially helpful for companies which need bespoke workloads including financial analytics, AI applications and sophisticated data storage systems. Growth in this sector is further spurred by the rise in software defined and customizable hardware.
By Business Type
The rack & tower segment dominated the market in 2023 with 45% of the market share. However, they happen to hold such a wide footprint across data centers and enterprises. This is due to scalability provided by these servers while efficiently cooling and offering cable management. These are cost-effective and ideal for general-purpose computing environments.
Meanwhile, the density-optimized segment is anticipated to grow at the fastest CAGR of 5.73% during the forecast period of 2024-2032. This type of server is designed to provide a maximum amount of compute power within a constrained space, so it serves ideal conditions for cloud service providers and hyper-scale data centers. Rising demand for solutions to achieve more efficient use of floor space with lowered operational cost while enhancing energy efficiency is triggering its growth further. As organizations are shifting towards high-performance computing environments, the density-optimized segment will provide a huge opportunity for growth.
By Processor Type
The X86 servers segment dominated the market in 2023 with a share of 64%. The processors are preferred since they are x86, thereby compatible and flexible, supporting several enterprise applications as well as cloud-based services. They are considered efficient for complicated workloads in both data centers and enterprise applications.
However, the segment of non-X86 servers is expected to register the highest growth rate at 5.20% during the forecast period between 2024 and 2032. Such servers based on ARM architecture have been becoming more popular in view of high power efficiency as well as opportunities in high-performance computing. Demand from cloud environments, next-generation IT solutions, and the like in terms of adopting ARM-based processors is promoting such a scenario. Government initiatives with a focus on sustainable IT infrastructure are also contributing to the rapid growth of non-X86 servers.
By Operating System
Linux segment dominated the market with 37% share in 2023. Linux is geared towards flexibility, open-source functionality, and robust security features, which make it ideal for enterprise applications in the cloud computing environment. Linux also supports all applications and virtualization technologies, which is another reason that dictates its adoption in data centers.
Notably, the Linux segment is expected to grow with the fastest CAGR of 4.88% from 2024 to 2032. This growth can be attributed to its increasing deployment in high-performance computing (HPC) environments, along with the rising preference for open-source solutions that reduce licensing costs. As more businesses and cloud service providers embrace software-defined solutions, Linux-based systems will continue to gain traction. The adoption of containerization technologies such as Kubernetes and Docker further supports the expansion of Linux-based server environments in the coming years.
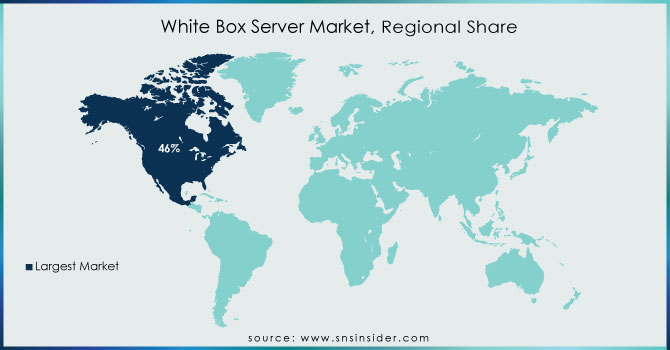
In 2023, North America dominated the White Box Server Market, capturing 37% of the total market share. The presence of major cloud service providers such as Amazon Web Services (AWS), Microsoft Azure, and Google Cloud, which require scalable, cost-effective server solutions, is attributed to the region's leadership. Widespread adoption of hyper-converged infrastructure and advancements in software-defined networking (SDN) also contribute to the region's dominance. Increasing focus on energy-efficient data centers and strong investments in AI and big data analytics further boost the North American market.
Meanwhile, the Asia-Pacific region is expected to witness growth at the highest CAGR of 5.18% during the forecast period from 2024 to 2032. Rapid industrialization, a growing IT services sector, and government-backed initiatives for digital infrastructure development are the major factors propelling this growth. Scalable servers are in big demand as most businesses switch from traditional server arrangements to cloud computing and even begin to explore latest technologies such as edge computing and IoT. Notably, governments in China are implementing their Digital Economy Plan and India's campaign for "Digital India," initiatives that have enhanced the demand for modern server infrastructures like the white box server.
Get more information on White Box Server Market - Enquire Now
Some of the Major Players in the White Box Server Market Are
Quanta Computer (Servers, Networking Solutions)
Wistron (Server Platforms, Storage Systems)
Inventec (High-Density Servers, Cloud Solutions)
Supermicro (Blade Servers, Rack Servers)
Hon Hai Precision Industry (Data Center Servers, IoT Solutions)
MiTAC Holdings (Cloud Servers, Edge Computing Platforms)
Celestica (Enterprise Servers, Data Storage Solutions)
Hyve Solutions (Custom Servers, Data Center Hardware)
ZT Systems (Rack Servers, Storage Systems)
Penguin Computing (HPC Servers, AI Solutions)
Inspur (AI Servers, Cloud Platforms)
Gigabyte Technology (Server Motherboards, Enterprise Servers)
ASRock Rack (Workstation Servers, Data Center Products)
Dell Technologies (Server Platforms, Networking Systems)
Hewlett Packard Enterprise (HPE) (Data Center Solutions, Edge Servers)
Cisco Systems (Server Infrastructure, Networking Devices)
Lenovo (Server Platforms, Cloud Solutions)
Fujitsu (Mainframe Servers, Enterprise Storage)
AMD (Processors, AI Computing Solutions)
NVIDIA (GPUs, AI Data Servers)
Major Suppliers (Components, Technologies)
Intel (Processors, Chipsets)
Broadcom (Networking Chips, Semiconductors)
Seagate Technology (HDD Storage, Data Storage Components)
Micron Technology (Memory Modules, NAND Flash)
Samsung Electronics (Memory Chips, Storage Devices)
Western Digital (HDDs, SSDs)
Marvell Technology (Network Controllers, Embedded Processors)
Texas Instruments (Power Management ICs)
Toshiba (Storage Solutions, NAND Flash Memory)
NXP Semiconductors (Embedded Processors, Connectivity Chips)
Major Clients
Amazon Web Services (AWS)
Google Cloud Platform
Microsoft Azure
Facebook (Meta)
IBM Cloud
Tencent Cloud
Baidu
Alibaba Cloud
Oracle Cloud
Huawei Technologies
September 2023: Wistron has won significant GPU substrate orders for AI servers and expects its server product shipments to rise month by month for the rest of this year, industry sources said.
October 2024: GPU-enhanced servers can usually fit up to eight of these accelerators, but Supermicro's engineered a box that somehow shoehorns 18 into an air-cooled chassis that'll consume only 3U of rack space. The delightfully named SYS-322GB-NR features 20 PCIe slots, and you're likely to populate those with GPUs.
| Report Attributes | Details |
|---|---|
| Market Size in 2023 | US$ 5.53 Billion |
| Market Size by 2032 | US$ 20.35 Billion |
| CAGR | CAGR of 15.58% From 2024 to 2032 |
| Base Year | 2023 |
| Forecast Period | 2024-2032 |
| Historical Data | 2020-2022 |
| Report Scope & Coverage | Market Size, Segments Analysis, Competitive Landscape, Regional Analysis, DROC & SWOT Analysis, Forecast Outlook |
| Key Segments | • By Server Type (Rack & Tower, Blade, Density-Optimized), • By Business Type (Data centers, Enterprise), • By Processor Type (x86 Server, Non-x86 Server) • By Operating System (Linux, Windows, Unix) |
| Regional Analysis/Coverage | North America (US, Canada, Mexico), Europe (Eastern Europe [Poland, Romania, Hungary, Turkey, Rest of Eastern Europe] Western Europe] Germany, France, UK, Italy, Spain, Netherlands, Switzerland, Austria, Rest of Western Europe]), Asia Pacific (China, India, Japan, South Korea, Vietnam, Singapore, Australia, Rest of Asia Pacific), Middle East & Africa (Middle East [UAE, Egypt, Saudi Arabia, Qatar, Rest of Middle East], Africa [Nigeria, South Africa, Rest of Africa], Latin America (Brazil, Argentina, Colombia, Rest of Latin America) |
| Company Profiles | Quanta Computer, Wistron, Inventec, Supermicro, Hon Hai Precision Industry, MiTAC Holdings, Celestica, Hyve Solutions, ZT Systems, Penguin Computing, Inspur, Gigabyte Technology, ASRock Rack, Dell Technologies, Hewlett Packard Enterprise, Cisco Systems, Lenovo, Fujitsu, AMD, NVIDIA. |
Ans: - The White Box Server Market size was valued at 15.2 Bn in 2023
Ans: The business is affected by the limited services and support capacity of ODMs and Shortage of channel partners' skills.
Ans: - The segments covered in the White Box Server Market report for study are on the Basis of Server Type, Business Type, and Processor Type.
Ans: - The major key players are COMPAL Inc., Foxconn Electronics Inc., Hyve Solutions Corporation, Inventec Corp., Jabil Inc., MiTAC Holdings Corp., Penguin Computing, Quanta Computer lnc., Servers Direct, Wistron Corporation.
Table of Content
1. Introduction
1.1 Market Definition
1.2 Scope (Inclusion and Exclusions)
1.3 Research Assumptions
2. Executive Summary
2.1 Market Overview
2.2 Regional Synopsis
2.3 Competitive Summary
3. Research Methodology
3.1 Top-Down Approach
3.2 Bottom-up Approach
3.3. Data Validation
3.4 Primary Interviews
4. Market Dynamics Impact Analysis
4.1 Market Driving Factors Analysis
4.1.1 Drivers
4.1.2 Restraints
4.1.3 Opportunities
4.1.4 Challenges
4.2 PESTLE Analysis
4.3 Porter’s Five Forces Model
5. Statistical Insights and Trends Reporting
5.1 Key Vendors and Feature Analysis, 2023
5.2 Performance Benchmarks, 2023
5.3 Integration Capabilities
5.4 Usage Statistics, 2023
6. Competitive Landscape
6.1 List of Major Companies, By Region
6.2 Market Share Analysis, By Region
6.3 Product Benchmarking
6.3.1 Product specifications and features
6.3.2 Pricing
6.4 Strategic Initiatives
6.4.1 Marketing and promotional activities
6.4.2 Distribution and supply chain strategies
6.4.3 Expansion plans and new product launches
6.4.4 Strategic partnerships and collaborations
6.5 Technological Advancements
6.6 Market Positioning and Branding
7. White Box Server Market Segmentation, By Server Type
7.1 Chapter Overview
7.2 Rack & Tower
7.2.1 Rack & Tower Market Trends Analysis (2020-2032)
7.2.2 Rack & Tower Market Size Estimates and Forecasts to 2032 (USD Billion)
7.3 Blade
7.3.1 Blade Market Trends Analysis (2020-2032)
7.3.2 Blade Market Size Estimates and Forecasts to 2032 (USD Billion)
7.4 Density-Optimized
7.4.1 Density-Optimized Market Trends Analysis (2020-2032)
7.4.2 Density-Optimized Market Size Estimates and Forecasts to 2032 (USD Billion)
8. White Box Server Market Segmentation, By Business Type
8.1 Chapter Overview
8.2 Data centers
8.2.1 Data centers Market Trends Analysis (2020-2032)
8.2.2 Data centers Market Size Estimates and Forecasts to 2032 (USD Billion)
8.3 Enterprise
8.3.1 Enterprise Market Trends Analysis (2020-2032)
8.3.2 Enterprise Market Size Estimates and Forecasts to 2032 (USD Billion)
9. White Box Server Market Segmentation, By Processor Type
9.1 Chapter Overview
9.2 x86 Server
9.2.1 x86 Server Market Trends Analysis (2020-2032)
9.2.2 x86 Server Market Size Estimates and Forecasts to 2032 (USD Billion)
9.3 Non-x86 Server
9.3.1 Non-x86 Server Market Trends Analysis (2020-2032)
9.3.2 Non-x86 Server Market Size Estimates and Forecasts to 2032 (USD Billion)
10. White Box Server Market Segmentation, By Operating System
10.1 Chapter Overview
10.2 Linux
10.2.1 Linux Market Trends Analysis (2020-2032)
10.2.2 Linux Market Size Estimates and Forecasts to 2032 (USD Billion)
10.3 Windows
10.3.1 Windows Market Trends Analysis (2020-2032)
10.3.2 Windows Market Size Estimates and Forecasts to 2032 (USD Billion)
10.4 Unix
10.4.1 Unix Market Trends Analysis (2020-2032)
10.4.2 Unix Market Size Estimates And Forecasts To 2032 (USD Billion)
11. Regional Analysis
11.1 Chapter Overview
11.2 North America
11.2.1 Trends Analysis
11.2.2 North America White Box Server Market Estimates and Forecasts, by Country (2020-2032) (USD Billion)
11.2.3 North America White Box Server Market Estimates and Forecasts, By Server Type (2020-2032) (USD Billion)
11.2.4 North America White Box Server Market Estimates and Forecasts, By Business Type (2020-2032) (USD Billion)
11.2.5 North America White Box Server Market Estimates and Forecasts, By Processor Type (2020-2032) (USD Billion)
11.2.6 North America White Box Server Market Estimates and Forecasts, By Operating System (2020-2032) (USD Billion)
11.2.7 USA
11.2.7.1 USA White Box Server Market Estimates and Forecasts, By Server Type (2020-2032) (USD Billion)
11.2.7.2 USA White Box Server Market Estimates and Forecasts, By Business Type (2020-2032) (USD Billion)
11.2.7.3 USA White Box Server Market Estimates and Forecasts, By Processor Type (2020-2032) (USD Billion)
11.2.7.4 USA White Box Server Market Estimates and Forecasts, By Operating System (2020-2032) (USD Billion)
11.2.8 Canada
11.2.8.1 Canada White Box Server Market Estimates and Forecasts, By Server Type (2020-2032) (USD Billion)
11.2.8.2 Canada White Box Server Market Estimates and Forecasts, By Business Type (2020-2032) (USD Billion)
11.2.8.3 Canada White Box Server Market Estimates and Forecasts, By Processor Type (2020-2032) (USD Billion)
11.2.8.4 Canada White Box Server Market Estimates and Forecasts, By Operating System (2020-2032) (USD Billion)
11.2.9 Mexico
11.2.9.1 Mexico White Box Server Market Estimates and Forecasts, By Server Type (2020-2032) (USD Billion)
11.2.9.2 Mexico White Box Server Market Estimates and Forecasts, By Business Type (2020-2032) (USD Billion)
11.2.9.3 Mexico White Box Server Market Estimates and Forecasts, By Processor Type (2020-2032) (USD Billion)
11.2.9.4 Mexico White Box Server Market Estimates and Forecasts, By Operating System (2020-2032) (USD Billion)
11.3 Europe
11.3.1 Eastern Europe
11.3.1.1 Trends Analysis
11.3.1.2 Eastern Europe White Box Server Market Estimates and Forecasts, by Country (2020-2032) (USD Billion)
11.3.1.3 Eastern Europe White Box Server Market Estimates and Forecasts, By Server Type (2020-2032) (USD Billion)
11.3.1.4 Eastern Europe White Box Server Market Estimates and Forecasts, By Business Type (2020-2032) (USD Billion)
11.3.1.5 Eastern Europe White Box Server Market Estimates and Forecasts, By Processor Type (2020-2032) (USD Billion)
11.3.1.6 Eastern Europe White Box Server Market Estimates and Forecasts, By Operating System (2020-2032) (USD Billion)
11.3.1.7 Poland
11.3.1.7.1 Poland White Box Server Market Estimates and Forecasts, By Server Type (2020-2032) (USD Billion)
11.3.1.7.2 Poland White Box Server Market Estimates and Forecasts, By Business Type (2020-2032) (USD Billion)
11.3.1.7.3 Poland White Box Server Market Estimates and Forecasts, By Processor Type (2020-2032) (USD Billion)
11.3.1.7.4 Poland White Box Server Market Estimates and Forecasts, By Operating System (2020-2032) (USD Billion)
11.3.1.8 Romania
11.3.1.8.1 Romania White Box Server Market Estimates and Forecasts, By Server Type (2020-2032) (USD Billion)
11.3.1.8.2 Romania White Box Server Market Estimates and Forecasts, By Business Type (2020-2032) (USD Billion)
11.3.1.8.3 Romania White Box Server Market Estimates and Forecasts, By Processor Type (2020-2032) (USD Billion)
11.3.1.8.4 Romania White Box Server Market Estimates and Forecasts, By Operating System (2020-2032) (USD Billion)
11.3.1.9 Hungary
11.3.1.9.1 Hungary White Box Server Market Estimates and Forecasts, By Server Type (2020-2032) (USD Billion)
11.3.1.9.2 Hungary White Box Server Market Estimates and Forecasts, By Business Type (2020-2032) (USD Billion)
11.3.1.9.3 Hungary White Box Server Market Estimates and Forecasts, By Processor Type (2020-2032) (USD Billion)
11.3.1.9.4 Hungary White Box Server Market Estimates and Forecasts, By Operating System (2020-2032) (USD Billion)
11.3.1.10 Turkey
11.3.1.10.1 Turkey White Box Server Market Estimates and Forecasts, By Server Type (2020-2032) (USD Billion)
11.3.1.10.2 Turkey White Box Server Market Estimates and Forecasts, By Business Type (2020-2032) (USD Billion)
11.3.1.10.3 Turkey White Box Server Market Estimates and Forecasts, By Processor Type (2020-2032) (USD Billion)
11.3.1.10.4 Turkey White Box Server Market Estimates and Forecasts, By Operating System (2020-2032) (USD Billion)
11.3.1.11 Rest of Eastern Europe
11.3.1.11.1 Rest of Eastern Europe White Box Server Market Estimates and Forecasts, By Server Type (2020-2032) (USD Billion)
11.3.1.11.2 Rest of Eastern Europe White Box Server Market Estimates and Forecasts, By Business Type (2020-2032) (USD Billion)
11.3.1.11.3 Rest of Eastern Europe White Box Server Market Estimates and Forecasts, By Processor Type (2020-2032) (USD Billion)
11.3.1.11.4 Rest of Eastern Europe White Box Server Market Estimates and Forecasts, By Operating System (2020-2032) (USD Billion)
11.3.2 Western Europe
11.3.2.1 Trends Analysis
11.3.2.2 Western Europe White Box Server Market Estimates and Forecasts, by Country (2020-2032) (USD Billion)
11.3.2.3 Western Europe White Box Server Market Estimates and Forecasts, By Server Type (2020-2032) (USD Billion)
11.3.2.4 Western Europe White Box Server Market Estimates and Forecasts, By Business Type (2020-2032) (USD Billion)
11.3.2.5 Western Europe White Box Server Market Estimates and Forecasts, By Processor Type (2020-2032) (USD Billion)
11.3.2.6 Western Europe White Box Server Market Estimates and Forecasts, By Operating System (2020-2032) (USD Billion)
11.3.2.7 Germany
11.3.2.7.1 Germany White Box Server Market Estimates and Forecasts, By Server Type (2020-2032) (USD Billion)
11.3.2.7.2 Germany White Box Server Market Estimates and Forecasts, By Business Type (2020-2032) (USD Billion)
11.3.2.7.3 Germany White Box Server Market Estimates and Forecasts, By Processor Type (2020-2032) (USD Billion)
11.3.2.7.4 Germany White Box Server Market Estimates and Forecasts, By Operating System (2020-2032) (USD Billion)
11.3.2.8 France
11.3.2.8.1 France White Box Server Market Estimates and Forecasts, By Server Type (2020-2032) (USD Billion)
11.3.2.8.2 France White Box Server Market Estimates and Forecasts, By Business Type (2020-2032) (USD Billion)
11.3.2.8.3 France White Box Server Market Estimates and Forecasts, By Processor Type (2020-2032) (USD Billion)
11.3.2.8.4 France White Box Server Market Estimates and Forecasts, By Operating System (2020-2032) (USD Billion)
11.3.2.9 UK
11.3.2.9.1 UK White Box Server Market Estimates and Forecasts, By Server Type (2020-2032) (USD Billion)
11.3.2.9.2 UK White Box Server Market Estimates and Forecasts, By Business Type (2020-2032) (USD Billion)
11.3.2.9.3 UK White Box Server Market Estimates and Forecasts, By Processor Type (2020-2032) (USD Billion)
11.3.2.9.4 UK White Box Server Market Estimates and Forecasts, By Operating System (2020-2032) (USD Billion)
11.3.2.10 Italy
11.3.2.10.1 Italy White Box Server Market Estimates and Forecasts, By Server Type (2020-2032) (USD Billion)
11.3.2.10.2 Italy White Box Server Market Estimates and Forecasts, By Business Type (2020-2032) (USD Billion)
11.3.2.10.3 Italy White Box Server Market Estimates and Forecasts, By Processor Type (2020-2032) (USD Billion)
11.3.2.10.4 Italy White Box Server Market Estimates and Forecasts, By Operating System (2020-2032) (USD Billion)
11.3.2.11 Spain
11.3.2.11.1 Spain White Box Server Market Estimates and Forecasts, By Server Type (2020-2032) (USD Billion)
11.3.2.11.2 Spain White Box Server Market Estimates and Forecasts, By Business Type (2020-2032) (USD Billion)
11.3.2.11.3 Spain White Box Server Market Estimates and Forecasts, By Processor Type (2020-2032) (USD Billion)
11.3.2.11.4 Spain White Box Server Market Estimates and Forecasts, By Operating System (2020-2032) (USD Billion)
11.3.2.12 Netherlands
11.3.2.12.1 Netherlands White Box Server Market Estimates and Forecasts, By Server Type (2020-2032) (USD Billion)
11.3.2.12.2 Netherlands White Box Server Market Estimates and Forecasts, By Business Type (2020-2032) (USD Billion)
11.3.2.12.3 Netherlands White Box Server Market Estimates and Forecasts, By Processor Type (2020-2032) (USD Billion)
11.3.2.12.4 Netherlands White Box Server Market Estimates and Forecasts, By Operating System (2020-2032) (USD Billion)
11.3.2.13 Switzerland
11.3.2.13.1 Switzerland White Box Server Market Estimates and Forecasts, By Server Type (2020-2032) (USD Billion)
11.3.2.13.2 Switzerland White Box Server Market Estimates and Forecasts, By Business Type (2020-2032) (USD Billion)
11.3.2.13.3 Switzerland White Box Server Market Estimates and Forecasts, By Processor Type (2020-2032) (USD Billion)
11.3.2.13.4 Switzerland White Box Server Market Estimates and Forecasts, By Operating System (2020-2032) (USD Billion)
11.3.2.14 Austria
11.3.2.14.1 Austria White Box Server Market Estimates and Forecasts, By Server Type (2020-2032) (USD Billion)
11.3.2.14.2 Austria White Box Server Market Estimates and Forecasts, By Business Type (2020-2032) (USD Billion)
11.3.2.14.3 Austria White Box Server Market Estimates and Forecasts, By Processor Type (2020-2032) (USD Billion)
11.3.2.14.4 Austria White Box Server Market Estimates and Forecasts, By Operating System (2020-2032) (USD Billion)
11.3.2.15 Rest of Western Europe
11.3.2.15.1 Rest of Western Europe White Box Server Market Estimates and Forecasts, By Server Type (2020-2032) (USD Billion)
11.3.2.15.2 Rest of Western Europe White Box Server Market Estimates and Forecasts, By Business Type (2020-2032) (USD Billion)
11.3.2.15.3 Rest of Western Europe White Box Server Market Estimates and Forecasts, By Processor Type (2020-2032) (USD Billion)
11.3.2.15.4 Rest of Western Europe White Box Server Market Estimates and Forecasts, By Operating System (2020-2032) (USD Billion)
11.4 Asia Pacific
11.4.1 Trends Analysis
11.4.2 Asia Pacific White Box Server Market Estimates and Forecasts, by Country (2020-2032) (USD Billion)
11.4.3 Asia Pacific White Box Server Market Estimates and Forecasts, By Server Type (2020-2032) (USD Billion)
11.4.4 Asia Pacific White Box Server Market Estimates and Forecasts, By Business Type (2020-2032) (USD Billion)
11.4.5 Asia Pacific White Box Server Market Estimates and Forecasts, By Processor Type (2020-2032) (USD Billion)
11.4.6 Asia Pacific White Box Server Market Estimates and Forecasts, By Operating System (2020-2032) (USD Billion)
11.4.7 China
11.4.7.1 China White Box Server Market Estimates and Forecasts, By Server Type (2020-2032) (USD Billion)
11.4.7.2 China White Box Server Market Estimates and Forecasts, By Business Type (2020-2032) (USD Billion)
11.4.7.3 China White Box Server Market Estimates and Forecasts, By Processor Type (2020-2032) (USD Billion)
11.4.7.4 China White Box Server Market Estimates and Forecasts, By Operating System (2020-2032) (USD Billion)
11.4.8 India
11.4.8.1 India White Box Server Market Estimates and Forecasts, By Server Type (2020-2032) (USD Billion)
11.4.8.2 India White Box Server Market Estimates and Forecasts, By Business Type (2020-2032) (USD Billion)
11.4.8.3 India White Box Server Market Estimates and Forecasts, By Processor Type (2020-2032) (USD Billion)
11.4.8.4 India White Box Server Market Estimates and Forecasts, By Operating System (2020-2032) (USD Billion)
11.4.9 Japan
11.4.9.1 Japan White Box Server Market Estimates and Forecasts, By Server Type (2020-2032) (USD Billion)
11.4.9.2 Japan White Box Server Market Estimates and Forecasts, By Business Type (2020-2032) (USD Billion)
11.4.9.3 Japan White Box Server Market Estimates and Forecasts, By Processor Type (2020-2032) (USD Billion)
11.4.9.4 Japan White Box Server Market Estimates and Forecasts, By Operating System (2020-2032) (USD Billion)
11.4.10 South Korea
11.4.10.1 South Korea White Box Server Market Estimates and Forecasts, By Server Type (2020-2032) (USD Billion)
11.4.10.2 South Korea White Box Server Market Estimates and Forecasts, By Business Type (2020-2032) (USD Billion)
11.4.10.3 South Korea White Box Server Market Estimates and Forecasts, By Processor Type (2020-2032) (USD Billion)
11.4.10.4 South Korea White Box Server Market Estimates and Forecasts, By Operating System (2020-2032) (USD Billion)
11.4.11 Vietnam
11.4.11.1 Vietnam White Box Server Market Estimates and Forecasts, By Server Type (2020-2032) (USD Billion)
11.4.11.2 Vietnam White Box Server Market Estimates and Forecasts, By Business Type (2020-2032) (USD Billion)
11.4.11.3 Vietnam White Box Server Market Estimates and Forecasts, By Processor Type (2020-2032) (USD Billion)
11.4.11.4 Vietnam White Box Server Market Estimates and Forecasts, By Operating System (2020-2032) (USD Billion)
11.4.12 Singapore
11.4.12.1 Singapore White Box Server Market Estimates and Forecasts, By Server Type (2020-2032) (USD Billion)
11.4.12.2 Singapore White Box Server Market Estimates and Forecasts, By Business Type (2020-2032) (USD Billion)
11.4.12.3 Singapore White Box Server Market Estimates and Forecasts, By Processor Type (2020-2032) (USD Billion)
11.4.12.4 Singapore White Box Server Market Estimates and Forecasts, By Operating System (2020-2032) (USD Billion)
11.4.13 Australia
11.4.13.1 Australia White Box Server Market Estimates and Forecasts, By Server Type (2020-2032) (USD Billion)
11.4.13.2 Australia White Box Server Market Estimates and Forecasts, By Business Type (2020-2032) (USD Billion)
11.4.13.3 Australia White Box Server Market Estimates and Forecasts, By Processor Type (2020-2032) (USD Billion)
11.4.13.4 Australia White Box Server Market Estimates and Forecasts, By Operating System (2020-2032) (USD Billion)
11.4.14 Rest of Asia Pacific
11.4.14.1 Rest of Asia Pacific White Box Server Market Estimates and Forecasts, By Server Type (2020-2032) (USD Billion)
11.4.14.2 Rest of Asia Pacific White Box Server Market Estimates and Forecasts, By Business Type (2020-2032) (USD Billion)
11.4.14.3 Rest of Asia Pacific White Box Server Market Estimates and Forecasts, By Processor Type (2020-2032) (USD Billion)
11.4.14.4 Rest of Asia Pacific White Box Server Market Estimates and Forecasts, By Operating System (2020-2032) (USD Billion)
11.5 Middle East and Africa
11.5.1 Middle East
11.5.1.1 Trends Analysis
11.5.1.2 Middle East White Box Server Market Estimates and Forecasts, by Country (2020-2032) (USD Billion)
11.5.1.3 Middle East White Box Server Market Estimates and Forecasts, By Server Type (2020-2032) (USD Billion)
11.5.1.4 Middle East White Box Server Market Estimates and Forecasts, By Business Type (2020-2032) (USD Billion)
11.5.1.5 Middle East White Box Server Market Estimates and Forecasts, By Processor Type (2020-2032) (USD Billion)
11.5.1.6 Middle East White Box Server Market Estimates and Forecasts, By Operating System (2020-2032) (USD Billion)
11.5.1.7 UAE
11.5.1.7.1 UAE White Box Server Market Estimates and Forecasts, By Server Type (2020-2032) (USD Billion)
11.5.1.7.2 UAE White Box Server Market Estimates and Forecasts, By Business Type (2020-2032) (USD Billion)
11.5.1.7.3 UAE White Box Server Market Estimates and Forecasts, By Processor Type (2020-2032) (USD Billion)
11.5.1.7.4 UAE White Box Server Market Estimates and Forecasts, By Operating System (2020-2032) (USD Billion)
11.5.1.8 Egypt
11.5.1.8.1 Egypt White Box Server Market Estimates and Forecasts, By Server Type (2020-2032) (USD Billion)
11.5.1.8.2 Egypt White Box Server Market Estimates and Forecasts, By Business Type (2020-2032) (USD Billion)
11.5.1.8.3 Egypt White Box Server Market Estimates and Forecasts, By Processor Type (2020-2032) (USD Billion)
11.5.1.8.4 Egypt White Box Server Market Estimates and Forecasts, By Operating System (2020-2032) (USD Billion)
11.5.1.9 Saudi Arabia
11.5.1.9.1 Saudi Arabia White Box Server Market Estimates and Forecasts, By Server Type (2020-2032) (USD Billion)
11.5.1.9.2 Saudi Arabia White Box Server Market Estimates and Forecasts, By Business Type (2020-2032) (USD Billion)
11.5.1.9.3 Saudi Arabia White Box Server Market Estimates and Forecasts, By Processor Type (2020-2032) (USD Billion)
11.5.1.9.4 Saudi Arabia White Box Server Market Estimates and Forecasts, By Operating System (2020-2032) (USD Billion)
11.5.1.10 Qatar
11.5.1.10.1 Qatar White Box Server Market Estimates and Forecasts, By Server Type (2020-2032) (USD Billion)
11.5.1.10.2 Qatar White Box Server Market Estimates and Forecasts, By Business Type (2020-2032) (USD Billion)
11.5.1.10.3 Qatar White Box Server Market Estimates and Forecasts, By Processor Type (2020-2032) (USD Billion)
11.5.1.10.4 Qatar White Box Server Market Estimates and Forecasts, By Operating System (2020-2032) (USD Billion)
11.5.1.11 Rest of Middle East
11.5.1.11.1 Rest of Middle East White Box Server Market Estimates and Forecasts, By Server Type (2020-2032) (USD Billion)
11.5.1.11.2 Rest of Middle East White Box Server Market Estimates and Forecasts, By Business Type (2020-2032) (USD Billion)
11.5.1.11.3 Rest of Middle East White Box Server Market Estimates and Forecasts, By Processor Type (2020-2032) (USD Billion)
11.5.1.11.4 Rest of Middle East White Box Server Market Estimates and Forecasts, By Operating System (2020-2032) (USD Billion)
11.5.2 Africa
11.5.2.1 Trends Analysis
11.5.2.2 Africa White Box Server Market Estimates and Forecasts, by Country (2020-2032) (USD Billion)
11.5.2.3 Africa White Box Server Market Estimates and Forecasts, By Server Type (2020-2032) (USD Billion)
11.5.2.4 Africa White Box Server Market Estimates and Forecasts, By Business Type (2020-2032) (USD Billion)
11.5.2.5 Africa White Box Server Market Estimates and Forecasts, By Processor Type (2020-2032) (USD Billion)
11.5.2.6 Africa White Box Server Market Estimates and Forecasts, By Operating System (2020-2032) (USD Billion)
11.5.2.7 South Africa
11.5.2.7.1 South Africa White Box Server Market Estimates and Forecasts, By Server Type (2020-2032) (USD Billion)
11.5.2.7.2 South Africa White Box Server Market Estimates and Forecasts, By Business Type (2020-2032) (USD Billion)
11.5.2.7.3 South Africa White Box Server Market Estimates and Forecasts, By Processor Type (2020-2032) (USD Billion)
11.5.2.7.4 South Africa White Box Server Market Estimates and Forecasts, By Operating System (2020-2032) (USD Billion)
11.5.2.8 Nigeria
11.5.2.8.1 Nigeria White Box Server Market Estimates and Forecasts, By Server Type (2020-2032) (USD Billion)
11.5.2.8.2 Nigeria White Box Server Market Estimates and Forecasts, By Business Type (2020-2032) (USD Billion)
11.5.2.8.3 Nigeria White Box Server Market Estimates and Forecasts, By Processor Type (2020-2032) (USD Billion)
11.5.2.8.4 Nigeria White Box Server Market Estimates and Forecasts, By Operating System (2020-2032) (USD Billion)
11.5.2.9 Rest of Africa
11.5.2.9.1 Rest of Africa White Box Server Market Estimates and Forecasts, By Server Type (2020-2032) (USD Billion)
11.5.2.9.2 Rest of Africa White Box Server Market Estimates and Forecasts, By Business Type (2020-2032) (USD Billion)
11.5.2.9.3 Rest of Africa White Box Server Market Estimates and Forecasts, By Processor Type (2020-2032) (USD Billion)
11.5.2.9.4 Rest of Africa White Box Server Market Estimates and Forecasts, By Operating System (2020-2032) (USD Billion)
11.6 Latin America
11.6.1 Trends Analysis
11.6.2 Latin America White Box Server Market Estimates and Forecasts, by Country (2020-2032) (USD Billion)
11.6.3 Latin America White Box Server Market Estimates and Forecasts, By Server Type (2020-2032) (USD Billion)
11.6.4 Latin America White Box Server Market Estimates and Forecasts, By Business Type (2020-2032) (USD Billion)
11.6.5 Latin America White Box Server Market Estimates and Forecasts, By Processor Type (2020-2032) (USD Billion)
11.6.6 Latin America White Box Server Market Estimates and Forecasts, By Operating System (2020-2032) (USD Billion)
11.6.7 Brazil
11.6.7.1 Brazil White Box Server Market Estimates and Forecasts, By Server Type (2020-2032) (USD Billion)
11.6.7.2 Brazil White Box Server Market Estimates and Forecasts, By Business Type (2020-2032) (USD Billion)
11.6.7.3 Brazil White Box Server Market Estimates and Forecasts, By Processor Type (2020-2032) (USD Billion)
11.6.7.4 Brazil White Box Server Market Estimates and Forecasts, By Operating System (2020-2032) (USD Billion)
11.6.8 Argentina
11.6.8.1 Argentina White Box Server Market Estimates and Forecasts, By Server Type (2020-2032) (USD Billion)
11.6.8.2 Argentina White Box Server Market Estimates and Forecasts, By Business Type (2020-2032) (USD Billion)
11.6.8.3 Argentina White Box Server Market Estimates and Forecasts, By Processor Type (2020-2032) (USD Billion)
11.6.8.4 Argentina White Box Server Market Estimates and Forecasts, By Operating System (2020-2032) (USD Billion)
11.6.9 Colombia
11.6.9.1 Colombia White Box Server Market Estimates and Forecasts, By Server Type (2020-2032) (USD Billion)
11.6.9.2 Colombia White Box Server Market Estimates and Forecasts, By Business Type (2020-2032) (USD Billion)
11.6.9.3 Colombia White Box Server Market Estimates and Forecasts, By Processor Type (2020-2032) (USD Billion)
11.6.9.4 Colombia White Box Server Market Estimates and Forecasts, By Operating System (2020-2032) (USD Billion)
11.6.10 Rest of Latin America
11.6.10.1 Rest of Latin America White Box Server Market Estimates and Forecasts, By Server Type (2020-2032) (USD Billion)
11.6.10.2 Rest of Latin America White Box Server Market Estimates and Forecasts, By Business Type (2020-2032) (USD Billion)
11.6.10.3 Rest of Latin America White Box Server Market Estimates and Forecasts, By Processor Type (2020-2032) (USD Billion)
11.6.10.4 Rest of Latin America White Box Server Market Estimates and Forecasts, By Operating System (2020-2032) (USD Billion)
12. Company Profiles
12.1 Quanta Computer
12.1.1 Company Overview
12.1.2 Financial
12.1.3 Products/ Services Offered
12.1.4 SWOT Analysis
12.2 Wistron
12.2.1 Company Overview
12.2.2 Financial
12.2.3 Products/ Services Offered
12.2.4 SWOT Analysis
12.3 Inventec
12.3.1 Company Overview
12.3.2 Financial
12.3.3 Products/ Services Offered
12.3.4 SWOT Analysis
12.4 Supermicro
12.4.1 Company Overview
12.4.2 Financial
12.4.3 Products/ Services Offered
12.4.4 SWOT Analysis
12.5 Hon Hai Precision Industry
12.5.1 Company Overview
12.5.2 Financial
12.5.3 Products/ Services Offered
12.5.4 SWOT Analysis
12.6 MiTAC Holdings
12.6.1 Company Overview
12.6.2 Financial
12.6.3 Products/ Services Offered
12.6.4 SWOT Analysis
12.7 Celestica
12.7.1 Company Overview
12.7.2 Financial
12.7.3 Products/ Services Offered
12.7.4 SWOT Analysis
12.8 Hyve Solutions
12.8.1 Company Overview
12.8.2 Financial
12.8.3 Products/ Services Offered
12.8.4 SWOT Analysis
12.9 Penguin Computing
12.9.1 Company Overview
12.9.2 Financial
12.9.3 Products/ Services Offered
12.9.4 SWOT Analysis
12.10 Inspur
12.10.1 Company Overview
12.10.2 Financial
12.10.3 Products/ Services Offered
12.10.4 SWOT Analysis
13. Use Cases and Best Practices
14. Conclusion
An accurate research report requires proper strategizing as well as implementation. There are multiple factors involved in the completion of good and accurate research report and selecting the best methodology to compete the research is the toughest part. Since the research reports we provide play a crucial role in any company’s decision-making process, therefore we at SNS Insider always believe that we should choose the best method which gives us results closer to reality. This allows us to reach at a stage wherein we can provide our clients best and accurate investment to output ratio.
Each report that we prepare takes a timeframe of 350-400 business hours for production. Starting from the selection of titles through a couple of in-depth brain storming session to the final QC process before uploading our titles on our website we dedicate around 350 working hours. The titles are selected based on their current market cap and the foreseen CAGR and growth.
The 5 steps process:
Step 1: Secondary Research:
Secondary Research or Desk Research is as the name suggests is a research process wherein, we collect data through the readily available information. In this process we use various paid and unpaid databases which our team has access to and gather data through the same. This includes examining of listed companies’ annual reports, Journals, SEC filling etc. Apart from this our team has access to various associations across the globe across different industries. Lastly, we have exchange relationships with various university as well as individual libraries.

Step 2: Primary Research
When we talk about primary research, it is a type of study in which the researchers collect relevant data samples directly, rather than relying on previously collected data. This type of research is focused on gaining content specific facts that can be sued to solve specific problems. Since the collected data is fresh and first hand therefore it makes the study more accurate and genuine.
We at SNS Insider have divided Primary Research into 2 parts.
Part 1 wherein we interview the KOLs of major players as well as the upcoming ones across various geographic regions. This allows us to have their view over the market scenario and acts as an important tool to come closer to the accurate market numbers. As many as 45 paid and unpaid primary interviews are taken from both the demand and supply side of the industry to make sure we land at an accurate judgement and analysis of the market.
This step involves the triangulation of data wherein our team analyses the interview transcripts, online survey responses and observation of on filed participants. The below mentioned chart should give a better understanding of the part 1 of the primary interview.

Part 2: In this part of primary research the data collected via secondary research and the part 1 of the primary research is validated with the interviews from individual consultants and subject matter experts.
Consultants are those set of people who have at least 12 years of experience and expertise within the industry whereas Subject Matter Experts are those with at least 15 years of experience behind their back within the same space. The data with the help of two main processes i.e., FGDs (Focused Group Discussions) and IDs (Individual Discussions). This gives us a 3rd party nonbiased primary view of the market scenario making it a more dependable one while collation of the data pointers.
Step 3: Data Bank Validation
Once all the information is collected via primary and secondary sources, we run that information for data validation. At our intelligence centre our research heads track a lot of information related to the market which includes the quarterly reports, the daily stock prices, and other relevant information. Our data bank server gets updated every fortnight and that is how the information which we collected using our primary and secondary information is revalidated in real time.

Step 4: QA/QC Process
After all the data collection and validation our team does a final level of quality check and quality assurance to get rid of any unwanted or undesired mistakes. This might include but not limited to getting rid of the any typos, duplication of numbers or missing of any important information. The people involved in this process include technical content writers, research heads and graphics people. Once this process is completed the title gets uploader on our platform for our clients to read it.
Step 5: Final QC/QA Process:
This is the last process and comes when the client has ordered the study. In this process a final QA/QC is done before the study is emailed to the client. Since we believe in giving our clients a good experience of our research studies, therefore, to make sure that we do not lack at our end in any way humanly possible we do a final round of quality check and then dispatch the study to the client.
MARKET SEGMENTATION
BY SERVER TYPE
Rack & Tower
Blade
Density-Optimized
BY BUSINESS TYPE
Data Centers
Enterprise
BY PROCESSOR TYPE
x86 Server
Non-x86 Server
BY OPERATING SYSTEM
Linux
Windows
Unix
Request for Segment Customization as per your Business Requirement: Segment Customization Request
REGIONAL COVERAGE:
North America
US
Canada
Mexico
Europe
Eastern Europe
Poland
Romania
Hungary
Turkey
Rest of Eastern Europe
Western Europe
Germany
France
UK
Italy
Spain
Netherlands
Switzerland
Austria
Rest of Western Europe
Asia Pacific
China
India
Japan
South Korea
Vietnam
Singapore
Australia
Rest of Asia Pacific
Middle East & Africa
Middle East
UAE
Egypt
Saudi Arabia
Qatar
Rest of the Middle East
Africa
Nigeria
South Africa
Rest of Africa
Latin America
Brazil
Argentina
Colombia
Rest of Latin America
Request for Country Level Research Report: Country Level Customization Request
Available Customization
With the given market data, SNS Insider offers customization as per the company’s specific needs. The following customization options are available for the report:
Product Analysis
Criss-Cross segment analysis (e.g. Product X Application)
Product Matrix which gives a detailed comparison of product portfolio of each company
Geographic Analysis
Additional countries in any of the regions
Company Information
Detailed analysis and profiling of additional market players (Up to five)
Failure Analysis Market was valued at USD 5.05 billion in 2023 and is expected to reach USD 10.32 billion by 2032, growing at a CAGR of 8.29% by 2032.
The Eye Tracking Market size was USD 1.01 Billion in 2023 and is expected to Reach USD 11.4 Billion by 2032 and grow at a CAGR of 30.6% by 2032.
The Data Center Infrastructure Management Market was valued at USD 2.8 billion in 2023 and is expected to reach USD 8.8 billion by 2032, growing at a CAGR of 13.51% from 2024-2032.
Robotic Process Automation Market size was valued at USD 2.8 Billion in 2023 and is expected to grow to USD 38.4 Billion by 2032 and grow at a CAGR of 33.8% over the forecast period of 2024-2032.
IT & Telecom Cyber Security Market was valued at USD 30.87 billion in 2023 and is expected to reach USD 102.53 billion by 2032, growing at a CAGR of 14.33% from 2024-2032.
Network Attached Storage Market was worth USD 31.71 billion in 2023 and is predicted to be worth USD 109.72 billion by 2032, growing at a CAGR of 14.82% between 2024 and 2032.

Hi! Click one of our member below to chat on Phone
© 2025 All Rights Reserved by SNS Insider Pvt Ltd


