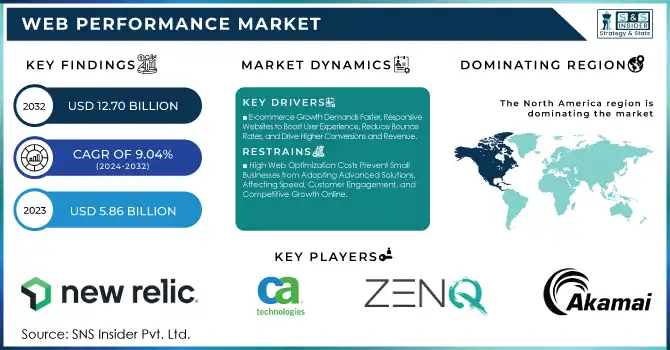
The Web Performance Market was valued at USD 5.86 billion in 2023 and is projected to reach USD 12.70 billion by 2032, growing at a CAGR of 9.04% from 2024 to 2032. This report includes an analysis of performance metrics, investment trends, customer satisfaction scores, cybersecurity impact, and traffic & usage data. The market is driven by increasing demand for faster, more reliable digital experiences, rising cybersecurity concerns, and growing adoption of cloud-based solutions. Investments in AI-driven optimization and edge computing are enhancing web performance capabilities, while user satisfaction remains a key factor influencing competitive strategies across industries.
To get more information on Web Performance Market - Request Free Sample Report
Drivers
E-commerce Growth Demands Faster, Responsive Websites to Boost User Experience, Reduce Bounce Rates, and Drive Higher Conversions and Revenue.
The rapid expansion of e-commerce has accelerated the demand for websites that provide seamless, speedy, and responsive experiences. Instant page loading, seamless navigation, and uninterrupted transactions are what customers expect, so performance optimization becomes a top priority for companies. Poorly optimized or slow websites result in increased bounce rates, cart abandonment, and lost business opportunities. Further, with mobile shopping on the rise, responsiveness across devices is critical to maintaining customer loyalty. With growing competition, companies need to spend on web performance solutions to sustain user interest and facilitate conversions. Faster website loading and uptime enhance customer satisfaction while also leading to better search engine rankings, reinforcing the brand online and in long-term growth.
Restraints
High Web Optimization Costs Prevent Small Businesses from Adopting Advanced Solutions, Affecting Speed, Customer Engagement, and Competitive Growth Online.
Installing sophisticated web performance solutions involves huge amounts of money to be spent on tools, infrastructure, and maintenance. Most small and medium enterprises cannot find room to spend the required money on premium performance optimization technologies such as content delivery networks (CDNs), load balancing, and real-time monitoring systems. The money spent on recruiting experienced professionals to maintain and optimize web performance also makes it a costly affair. As bigger companies achieve a competitive advantage by using premium solutions, small companies struggle to provide speed, responsiveness, and uptime. In the lack of proper resources, they end up sacrificing website performance at slower rates, elevated bounce rates, and lower customer interactions, eventually impacting their capability to compete in the digital market.
Opportunities
AI and Automation Enhance Web Performance by Optimizing Speed, Reducing Manual Effort, Predicting Issues, and Ensuring Seamless User Experience.
The integration of automation and artificial intelligence is transforming web performance by facilitating quicker, more effective optimization. AI-based solutions scan live user behavior, anticipate performance issues, and apply proactive fixes automatically without the need for human intervention. Automated monitoring of performance and load balancing guarantee that websites operate at their best speed, responsiveness, and uptime, even in the event of traffic surges. These smart systems decrease the reliance on IT staff, enabling organizations to use their resources more efficiently. With more complicated digital experiences, AI-based solutions optimize content delivery, increase page loading times, and deliver improved user satisfaction. The rise of AI and automation offers companies a cost-effective method to keep the web experience smooth and stay competitive in the new digital age.
Challenges
Balancing Website Security and Speed is Critical as Firewalls, Encryption, and Compliance Measures Can Impact Performance and User Experience.
With the growth of cyber threats, companies need to have strong security controls like firewalls, encryption, and DDoS protection to secure their websites. But these security controls add latency, which affects website loading times and responsiveness. Balancing security and performance is a difficult challenge because too many security layers can be costly in terms of page loading speed, making users impatient and bouncing more. Also, security patches and compliance updates require constant surveillance and adjustments, which also adds to the difficulties of optimizing the website. Companies need to embrace progressive solutions that blend security in an unobtrusive manner without compromising on speed, providing a secure but high-quality digital experience for users along with customer trust and interest.
By Component
The Solution segment led the Web Performance Market with a 69% revenue share in 2023 owing to the rising usage of performance optimization tools, content delivery networks, and automation through AI. Companies focus on solutions that accelerate website speed, provide low latency, and improve user experience, which results in large-scale deployment. Moreover, increasing dependence on cloud-based platforms and real-time monitoring solutions has also increased the demand for web performance solutions.
The Services segment will expand at the fastest CAGR of 11.25% during the forecast period 2024-2032 due to increasing demand for consulting, implementation, and managed services. As companies aim to optimize web performance, expert advice is needed to implement solutions properly. Increasing complexity in website architectures and the requirement for ongoing monitoring, security management, and performance optimization drive service-based offerings at a fast pace.
By Deployment
The Cloud segment led the Web Performance Market with a 58% revenue share in 2023 because cloud-based optimization solutions have been widely adopted. Companies like to use cloud platforms because they are scalable, economical, and can provide smooth performance at global locations. Cloud solutions provide real-time monitoring, automated updates, and AI-based analytics, which allow organizations to improve website speed, security, and reliability without making heavy infrastructure investments.
The On-premise segment will grow at the fastest CAGR of 10.47% during the period 2024-2032, led by growing data security and compliance concerns. Organizations dealing with sensitive data prefer on-premise solutions for complete control of web performance infrastructure. Moreover, sectors with stringent compliance needs like finance and healthcare are investing in on-premise deployments to maintain data privacy and optimize website performance and reliability.
By Enterprise Size
The Large Enterprises segment led the Web Performance Market with a 59% revenue share in 2023 because they heavily invested in sophisticated optimization solutions. Large businesses focus on smooth digital experiences, using AI-powered analytics, content delivery networks, and cloud-based performance tools. With high website traffic volumes and international operations, large businesses need strong web performance solutions to guarantee speed, security, and uptime, improving user engagement and competitive positioning.
The Small & Medium Enterprises segment is projected to grow at the fastest CAGR of 10.01% during the period 2024-2032, spurred by the surging use of digital platforms and cloud-based performance solutions. As SMEs move their presence online, they are looking for low-cost optimization solutions to improve website speed and user experience. Increasing affordability of web performance services and the surging demand for competitive differentiation also boost market growth in this segment.
By End Use
The Retail & E-commerce market led the Web Performance Market with a 29% share in revenue during 2023 based on the sheer necessity for rapid, lag-free, and interactive websites. Performance optimization is at the top of the priority list for e-tailers in order to decrease bounce rates, improve the user experience, and boost conversions. The surge in mobile shopping, online payments, and individualized recommendations additionally boosts the web performance solution requirement for this vertical.
The IT & Telecom segment is likely to witness the fastest CAGR of 11.29% during the forecast period from 2024 to 2032, owing to the high-growth development of digital infrastructure and cloud computing. With companies transitioning to cloud apps and remote working paradigms, IT and telecom vendors need high-performance web solutions to provide low latency and uptime. The expansion of 5G and edge computing also builds demand for enhanced web performance technologies.
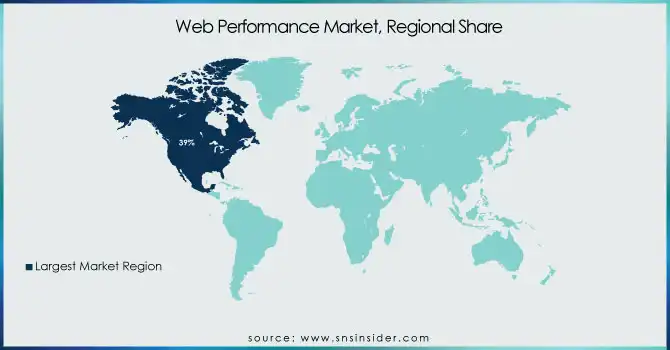
North America led the Web Performance Market with 39% revenue market share in 2023 owing to the large presence of leading technology firms and cloud companies. High penetration of internet, early adoption of sophisticated web optimization technologies, and growing e-commerce further lead to market leadership. Companies in the region are eager to implement digital transformation, AI-based analytics, and cybersecurity, thus demanding web performance solutions. Moreover, strict regulations regarding data security and user experience further fuel the uptake of performance-improving technologies.
The Asia Pacific region is expected to grow at the fastest CAGR of 10.59% during 2024-2032, fueled by speedy digitalization, growing internet users, and a thriving e-commerce sector. China, India, and Japan are seeing huge investments in cloud computing and mobile networks, boosting the demand for web performance solutions. The emergence of 5G, increasing smartphone penetration, and enlarging startup hubs further intensify the demand for quicker, more responsive online experiences throughout the region.
Get Customized Report as per Your Business Requirement - Enquiry Now
Akamai (Ion, Kona Site Defender)
ZenQ (Web Performance Testing Services, Mobile Performance Testing Services)
CA Technologies (Application Performance Management, App Synthetic Monitor)
New Relic (New Relic APM, New Relic Browser)
ThousandEyes (Cloud Performance Monitoring, Internet Insights)
Cavisson (NetStorm, NetDiagnostics)
F5 Networks (BIG-IP Local Traffic Manager, BIG-IP Application Security Manager)
Neustar (UltraDNS, Website Performance Monitoring)
CDNetworks (Content Acceleration, Cloud Security)
Netmagic (Cloud CDN Services, Application Performance Monitoring)
Micro Focus (LoadRunner, AppPulse)
Cloudflare (Content Delivery Network, Argo Smart Routing)
Dynatrace (Digital Experience Monitoring, Application Performance Monitoring)
IBM (IBM Application Performance Management, IBM Content Delivery Network)
Radware Ltd. (FastView, AppWall)
Fastly (Content Delivery Network, Image Optimization)
SolarWinds (Pingdom, Web Performance Monitor)
Amazon Web Services (AWS) (CloudFront, AWS Global Accelerator)
Google Cloud (Cloud CDN, Cloud Load Balancing)
Microsoft Azure (Azure Front Door, Azure CDN)
Alibaba Cloud (Alibaba Cloud CDN, Alibaba Cloud WAF)
StackPath (StackPath CDN, StackPath WAF)
KeyCDN (HTTP/2 CDN, Image Processing)
Imperva (Incapsula CDN, Incapsula WAF)
Sucuri (Website Firewall, Content Delivery Network)
In November 2024, Akamai Technologies extended its microsegmentation solution, Akamai Guardicore Segmentation, to support agentless enforcement for cloud-native resources in Amazon Web Services (AWS).
In October 2021, Wipro partnered with Micro Focus to launch a Legacy Migration and Modernisation Lab in Sydney, Australia, collaborating with Amazon Web Services (AWS) to help businesses in Australia and New Zealand transition legacy applications to the cloud
| Report Attributes | Details |
|---|---|
| Market Size in 2023 | USD 5.86 Billion |
| Market Size by 2032 | USD 12.70 Billion |
| CAGR | CAGR of 9.04% From 2024 to 2032 |
| Base Year | 2023 |
| Forecast Period | 2024-2032 |
| Historical Data | 2020-2022 |
| Report Scope & Coverage | Market Size, Segments Analysis, Competitive Landscape, Regional Analysis, DROC & SWOT Analysis, Forecast Outlook |
| Key Segments | • By Component (Solution, Services) • By Deployment (Cloud, On-premise) • By Enterprise Size (Small & Medium Enterprises (SMEs), Large Enterprises) • By End Use (BFSI, IT & Telecom, Manufacturing, Government, Retail & E-commerce, Automotive, Healthcare, Others) |
| Regional Analysis/Coverage | North America (US, Canada, Mexico), Europe (Eastern Europe [Poland, Romania, Hungary, Turkey, Rest of Eastern Europe] Western Europe] Germany, France, UK, Italy, Spain, Netherlands, Switzerland, Austria, Rest of Western Europe]), Asia Pacific (China, India, Japan, South Korea, Vietnam, Singapore, Australia, Rest of Asia Pacific), Middle East & Africa (Middle East [UAE, Egypt, Saudi Arabia, Qatar, Rest of Middle East], Africa [Nigeria, South Africa, Rest of Africa], Latin America (Brazil, Argentina, Colombia, Rest of Latin America) |
| Company Profiles | Akamai, ZenQ, CA Technologies, New Relic, ThousandEyes, Cavisson, F5 Networks, Neustar, CDNetworks, Netmagic, Micro Focus, Cloudflare, Dynatrace, IBM, Radware Ltd., Fastly, SolarWinds, Amazon Web Services (AWS), Google Cloud, Microsoft Azure, Alibaba Cloud, StackPath, KeyCDN, Imperva, Sucuri |
ANS: The Web Performance Market was valued at USD 5.86 billion in 2023 and is projected to reach USD 12.70 billion by 2032, growing at a CAGR of 9.04% from 2024 to 2032.
ANS: The Solution segment led with a 69% revenue share in 2023.
ANS: The Services segment is expected to grow at a CAGR of 11.25%.
ANS: The On-premise segment is expected to grow at a CAGR of 10.47%.
ANS: Asia Pacific is projected to grow at a CAGR of 10.59%.
Table of Contents
1. Introduction
1.1 Market Definition
1.2 Scope (Inclusion and Exclusions)
1.3 Research Assumptions
2. Executive Summary
2.1 Market Overview
2.2 Regional Synopsis
2.3 Competitive Summary
3. Research Methodology
3.1 Top-Down Approach
3.2 Bottom-up Approach
3.3. Data Validation
3.4 Primary Interviews
4. Market Dynamics Impact Analysis
4.1 Market Driving Factors Analysis
4.1.1 Drivers
4.1.2 Restraints
4.1.3 Opportunities
4.1.4 Challenges
4.2 PESTLE Analysis
4.3 Porter’s Five Forces Model
5. Statistical Insights and Trends Reporting
5.1 Performance Metrics
5.2 Investment Trends
5.3 Customer Satisfaction Scores
5.4 Cybersecurity Impact
5.5 Traffic & Usage Data
6. Competitive Landscape
6.1 List of Major Companies, By Region
6.2 Market Share Analysis, By Region
6.3 Product Benchmarking
6.3.1 Product specifications and features
6.3.2 Pricing
6.4 Strategic Initiatives
6.4.1 Marketing and promotional activities
6.4.2 Distribution and supply chain strategies
6.4.3 Expansion plans and new product launches
6.4.4 Strategic partnerships and collaborations
6.5 Technological Advancements
6.6 Market Positioning and Branding
7. Web Performance Market Segmentation, By Component
7.1 Chapter Overview
7.2 Solution
7.2.1 Solution Market Trends Analysis (2020-2032)
7.2.2 Solution Market Size Estimates and Forecasts to 2032 (USD Billion)
7.3 Services
7.3.1 Services Market Trends Analysis (2020-2032)
7.3.2 Services Market Size Estimates and Forecasts to 2032 (USD Billion)
8. Web Performance Market Segmentation, By Deployment
8.1 Chapter Overview
8.2 Cloud
8.2.1 Cloud Market Trends Analysis (2020-2032)
8.2.2 Cloud Market Size Estimates and Forecasts to 2032 (USD Billion)
8.3 On-premise
8.3.1 On-premise Market Trends Analysis (2020-2032)
8.3.2 On-premise Market Size Estimates and Forecasts to 2032 (USD Billion)
9. Web Performance Market Segmentation, By End Use
9.1 Chapter Overview
9.2 BFSI
9.2.1 BFSI Market Trends Analysis (2020-2032)
9.2.2 BFSI Market Size Estimates and Forecasts to 2032 (USD Billion)
9.3 IT & Telecom
9.3.1 IT & Telecom Market Trends Analysis (2020-2032)
9.3.2 IT & Telecom Market Size Estimates and Forecasts to 2032 (USD Billion)
9.4 Manufacturing
9.4.1 Manufacturing Market Trends Analysis (2020-2032)
9.4.2 Manufacturing Market Size Estimates and Forecasts to 2032 (USD Billion)
9.5 Government
9.5.1 Government Market Trends Analysis (2020-2032)
9.5.2 Government Market Size Estimates and Forecasts to 2032 (USD Billion)
9.6 Retail & E-commerce
9.6.1 Retail & E-commerce Market Trends Analysis (2020-2032)
9.6.2 Retail & E-commerce Market Size Estimates and Forecasts to 2032 (USD Billion)
9.7 Automotive
9.7.1 Automotive Market Trends Analysis (2020-2032)
9.7.2 Automotive Market Size Estimates and Forecasts to 2032 (USD Billion)
9.8 Healthcare
9.8.1 Healthcare Market Trends Analysis (2020-2032)
9.8.2 Healthcare Market Size Estimates and Forecasts to 2032 (USD Billion)
9.9 Others
9.9.1 Others Market Trends Analysis (2020-2032)
9.9.2 Others Market Size Estimates and Forecasts to 2032 (USD Billion)
10. Web Performance Market Segmentation, By Enterprise Size
10.1 Chapter Overview
10.2 Small & Medium Enterprises (SMEs)
10.2.1 Small & Medium Enterprises (SMEs) Market Trends Analysis (2020-2032)
10.2.2 Small & Medium Enterprises (SMEs) Market Size Estimates and Forecasts to 2032 (USD Billion)
10.3 Large Enterprises
10.3.1 Large Enterprises Market Trends Analysis (2020-2032)
10.3.2 Large Enterprises Market Size Estimates and Forecasts to 2032 (USD Billion)
11. Regional Analysis
11.1 Chapter Overview
11.2 North America
11.2.1 Trends Analysis
11.2.2 North America Web Performance Market Estimates and Forecasts, by Country (2020-2032) (USD Billion)
11.2.3 North America Web Performance Market Estimates and Forecasts, By Component (2020-2032) (USD Billion)
11.2.4 North America Web Performance Market Estimates and Forecasts, By Deployment (2020-2032) (USD Billion)
11.2.5 North America Web Performance Market Estimates and Forecasts, By End Use (2020-2032) (USD Billion)
11.2.6 North America Web Performance Market Estimates and Forecasts, By Enterprise Size (2020-2032) (USD Billion)
11.2.7 USA
11.2.7.1 USA Web Performance Market Estimates and Forecasts, By Component (2020-2032) (USD Billion)
11.2.7.2 USA Web Performance Market Estimates and Forecasts, By Deployment (2020-2032) (USD Billion)
11.2.7.3 USA Web Performance Market Estimates and Forecasts, By End Use (2020-2032) (USD Billion)
11.2.7.4 USA Web Performance Market Estimates and Forecasts, By Enterprise Size (2020-2032) (USD Billion)
11.2.8 Canada
11.2.8.1 Canada Web Performance Market Estimates and Forecasts, By Component (2020-2032) (USD Billion)
11.2.8.2 Canada Web Performance Market Estimates and Forecasts, By Deployment (2020-2032) (USD Billion)
11.2.8.3 Canada Web Performance Market Estimates and Forecasts, By End Use (2020-2032) (USD Billion)
11.2.8.4 Canada Web Performance Market Estimates and Forecasts, By Enterprise Size (2020-2032) (USD Billion)
11.2.9 Mexico
11.2.9.1 Mexico Web Performance Market Estimates and Forecasts, By Component (2020-2032) (USD Billion)
11.2.9.2 Mexico Web Performance Market Estimates and Forecasts, By Deployment (2020-2032) (USD Billion)
11.2.9.3 Mexico Web Performance Market Estimates and Forecasts, By End Use (2020-2032) (USD Billion)
11.2.9.4 Mexico Web Performance Market Estimates and Forecasts, By Enterprise Size (2020-2032) (USD Billion)
11.3 Europe
11.3.1 Eastern Europe
11.3.1.1 Trends Analysis
11.3.1.2 Eastern Europe Web Performance Market Estimates and Forecasts, by Country (2020-2032) (USD Billion)
11.3.1.3 Eastern Europe Web Performance Market Estimates and Forecasts, By Component (2020-2032) (USD Billion)
11.3.1.4 Eastern Europe Web Performance Market Estimates and Forecasts, By Deployment (2020-2032) (USD Billion)
11.3.1.5 Eastern Europe Web Performance Market Estimates and Forecasts, By End Use (2020-2032) (USD Billion)
11.3.1.6 Eastern Europe Web Performance Market Estimates and Forecasts, By Enterprise Size (2020-2032) (USD Billion)
11.3.1.7 Poland
11.3.1.7.1 Poland Web Performance Market Estimates and Forecasts, By Component (2020-2032) (USD Billion)
11.3.1.7.2 Poland Web Performance Market Estimates and Forecasts, By Deployment (2020-2032) (USD Billion)
11.3.1.7.3 Poland Web Performance Market Estimates and Forecasts, By End Use (2020-2032) (USD Billion)
11.3.1.7.4 Poland Web Performance Market Estimates and Forecasts, By Enterprise Size (2020-2032) (USD Billion)
11.3.1.8 Romania
11.3.1.8.1 Romania Web Performance Market Estimates and Forecasts, By Component (2020-2032) (USD Billion)
11.3.1.8.2 Romania Web Performance Market Estimates and Forecasts, By Deployment (2020-2032) (USD Billion)
11.3.1.8.3 Romania Web Performance Market Estimates and Forecasts, By End Use (2020-2032) (USD Billion)
11.3.1.8.4 Romania Web Performance Market Estimates and Forecasts, By Enterprise Size (2020-2032) (USD Billion)
11.3.1.9 Hungary
11.3.1.9.1 Hungary Web Performance Market Estimates and Forecasts, By Component (2020-2032) (USD Billion)
11.3.1.9.2 Hungary Web Performance Market Estimates and Forecasts, By Deployment (2020-2032) (USD Billion)
11.3.1.9.3 Hungary Web Performance Market Estimates and Forecasts, By End Use (2020-2032) (USD Billion)
11.3.1.9.4 Hungary Web Performance Market Estimates and Forecasts, By Enterprise Size (2020-2032) (USD Billion)
11.3.1.10 Turkey
11.3.1.10.1 Turkey Web Performance Market Estimates and Forecasts, By Component (2020-2032) (USD Billion)
11.3.1.10.2 Turkey Web Performance Market Estimates and Forecasts, By Deployment (2020-2032) (USD Billion)
11.3.1.10.3 Turkey Web Performance Market Estimates and Forecasts, By End Use (2020-2032) (USD Billion)
11.3.1.10.4 Turkey Web Performance Market Estimates and Forecasts, By Enterprise Size (2020-2032) (USD Billion)
11.3.1.11 Rest of Eastern Europe
11.3.1.11.1 Rest of Eastern Europe Web Performance Market Estimates and Forecasts, By Component (2020-2032) (USD Billion)
11.3.1.11.2 Rest of Eastern Europe Web Performance Market Estimates and Forecasts, By Deployment (2020-2032) (USD Billion)
11.3.1.11.3 Rest of Eastern Europe Web Performance Market Estimates and Forecasts, By End Use (2020-2032) (USD Billion)
11.3.1.11.4 Rest of Eastern Europe Web Performance Market Estimates and Forecasts, By Enterprise Size (2020-2032) (USD Billion)
11.3.2 Western Europe
11.3.2.1 Trends Analysis
11.3.2.2 Western Europe Web Performance Market Estimates and Forecasts, by Country (2020-2032) (USD Billion)
11.3.2.3 Western Europe Web Performance Market Estimates and Forecasts, By Component (2020-2032) (USD Billion)
11.3.2.4 Western Europe Web Performance Market Estimates and Forecasts, By Deployment (2020-2032) (USD Billion)
11.3.2.5 Western Europe Web Performance Market Estimates and Forecasts, By End Use (2020-2032) (USD Billion)
11.3.2.6 Western Europe Web Performance Market Estimates and Forecasts, By Enterprise Size (2020-2032) (USD Billion)
11.3.2.7 Germany
11.3.2.7.1 Germany Web Performance Market Estimates and Forecasts, By Component (2020-2032) (USD Billion)
11.3.2.7.2 Germany Web Performance Market Estimates and Forecasts, By Deployment (2020-2032) (USD Billion)
11.3.2.7.3 Germany Web Performance Market Estimates and Forecasts, By End Use (2020-2032) (USD Billion)
11.3.2.7.4 Germany Web Performance Market Estimates and Forecasts, By Enterprise Size (2020-2032) (USD Billion)
11.3.2.8 France
11.3.2.8.1 France Web Performance Market Estimates and Forecasts, By Component (2020-2032) (USD Billion)
11.3.2.8.2 France Web Performance Market Estimates and Forecasts, By Deployment (2020-2032) (USD Billion)
11.3.2.8.3 France Web Performance Market Estimates and Forecasts, By End Use (2020-2032) (USD Billion)
11.3.2.8.4 France Web Performance Market Estimates and Forecasts, By Enterprise Size (2020-2032) (USD Billion)
11.3.2.9 UK
11.3.2.9.1 UK Web Performance Market Estimates and Forecasts, By Component (2020-2032) (USD Billion)
11.3.2.9.2 UK Web Performance Market Estimates and Forecasts, By Deployment (2020-2032) (USD Billion)
11.3.2.9.3 UK Web Performance Market Estimates and Forecasts, By End Use (2020-2032) (USD Billion)
11.3.2.9.4 UK Web Performance Market Estimates and Forecasts, By Enterprise Size (2020-2032) (USD Billion)
11.3.2.10 Italy
11.3.2.10.1 Italy Web Performance Market Estimates and Forecasts, By Component (2020-2032) (USD Billion)
11.3.2.10.2 Italy Web Performance Market Estimates and Forecasts, By Deployment (2020-2032) (USD Billion)
11.3.2.10.3 Italy Web Performance Market Estimates and Forecasts, By End Use (2020-2032) (USD Billion)
11.3.2.10.4 Italy Web Performance Market Estimates and Forecasts, By Enterprise Size (2020-2032) (USD Billion)
11.3.2.11 Spain
11.3.2.11.1 Spain Web Performance Market Estimates and Forecasts, By Component (2020-2032) (USD Billion)
11.3.2.11.2 Spain Web Performance Market Estimates and Forecasts, By Deployment (2020-2032) (USD Billion)
11.3.2.11.3 Spain Web Performance Market Estimates and Forecasts, By End Use (2020-2032) (USD Billion)
11.3.2.11.4 Spain Web Performance Market Estimates and Forecasts, By Enterprise Size (2020-2032) (USD Billion)
11.3.2.12 Netherlands
11.3.2.12.1 Netherlands Web Performance Market Estimates and Forecasts, By Component (2020-2032) (USD Billion)
11.3.2.12.2 Netherlands Web Performance Market Estimates and Forecasts, By Deployment (2020-2032) (USD Billion)
11.3.2.12.3 Netherlands Web Performance Market Estimates and Forecasts, By End Use (2020-2032) (USD Billion)
11.3.2.12.4 Netherlands Web Performance Market Estimates and Forecasts, By Enterprise Size (2020-2032) (USD Billion)
11.3.2.13 Switzerland
11.3.2.13.1 Switzerland Web Performance Market Estimates and Forecasts, By Component (2020-2032) (USD Billion)
11.3.2.13.2 Switzerland Web Performance Market Estimates and Forecasts, By Deployment (2020-2032) (USD Billion)
11.3.2.13.3 Switzerland Web Performance Market Estimates and Forecasts, By End Use (2020-2032) (USD Billion)
11.3.2.13.4 Switzerland Web Performance Market Estimates and Forecasts, By Enterprise Size (2020-2032) (USD Billion)
11.3.2.14 Austria
11.3.2.14.1 Austria Web Performance Market Estimates and Forecasts, By Component (2020-2032) (USD Billion)
11.3.2.14.2 Austria Web Performance Market Estimates and Forecasts, By Deployment (2020-2032) (USD Billion)
11.3.2.14.3 Austria Web Performance Market Estimates and Forecasts, By End Use (2020-2032) (USD Billion)
11.3.2.14.4 Austria Web Performance Market Estimates and Forecasts, By Enterprise Size (2020-2032) (USD Billion)
11.3.2.15 Rest of Western Europe
11.3.2.15.1 Rest of Western Europe Web Performance Market Estimates and Forecasts, By Component (2020-2032) (USD Billion)
11.3.2.15.2 Rest of Western Europe Web Performance Market Estimates and Forecasts, By Deployment (2020-2032) (USD Billion)
11.3.2.15.3 Rest of Western Europe Web Performance Market Estimates and Forecasts, By End Use (2020-2032) (USD Billion)
11.3.2.15.4 Rest of Western Europe Web Performance Market Estimates and Forecasts, By Enterprise Size (2020-2032) (USD Billion)
11.4 Asia Pacific
11.4.1 Trends Analysis
11.4.2 Asia Pacific Web Performance Market Estimates and Forecasts, by Country (2020-2032) (USD Billion)
11.4.3 Asia Pacific Web Performance Market Estimates and Forecasts, By Component (2020-2032) (USD Billion)
11.4.4 Asia Pacific Web Performance Market Estimates and Forecasts, By Deployment (2020-2032) (USD Billion)
11.4.5 Asia Pacific Web Performance Market Estimates and Forecasts, By End Use (2020-2032) (USD Billion)
11.4.6 Asia Pacific Web Performance Market Estimates and Forecasts, By Enterprise Size (2020-2032) (USD Billion)
11.4.7 China
11.4.7.1 China Web Performance Market Estimates and Forecasts, By Component (2020-2032) (USD Billion)
11.4.7.2 China Web Performance Market Estimates and Forecasts, By Deployment (2020-2032) (USD Billion)
11.4.7.3 China Web Performance Market Estimates and Forecasts, By End Use (2020-2032) (USD Billion)
11.4.7.4 China Web Performance Market Estimates and Forecasts, By Enterprise Size (2020-2032) (USD Billion)
11.4.8 India
11.4.8.1 India Web Performance Market Estimates and Forecasts, By Component (2020-2032) (USD Billion)
11.4.8.2 India Web Performance Market Estimates and Forecasts, By Deployment (2020-2032) (USD Billion)
11.4.8.3 India Web Performance Market Estimates and Forecasts, By End Use (2020-2032) (USD Billion)
11.4.8.4 India Web Performance Market Estimates and Forecasts, By Enterprise Size (2020-2032) (USD Billion)
11.4.9 Japan
11.4.9.1 Japan Web Performance Market Estimates and Forecasts, By Component (2020-2032) (USD Billion)
11.4.9.2 Japan Web Performance Market Estimates and Forecasts, By Deployment (2020-2032) (USD Billion)
11.4.9.3 Japan Web Performance Market Estimates and Forecasts, By End Use (2020-2032) (USD Billion)
11.4.9.4 Japan Web Performance Market Estimates and Forecasts, By Enterprise Size (2020-2032) (USD Billion)
11.4.10 South Korea
11.4.10.1 South Korea Web Performance Market Estimates and Forecasts, By Component (2020-2032) (USD Billion)
11.4.10.2 South Korea Web Performance Market Estimates and Forecasts, By Deployment (2020-2032) (USD Billion)
11.4.10.3 South Korea Web Performance Market Estimates and Forecasts, By End Use (2020-2032) (USD Billion)
11.4.10.4 South Korea Web Performance Market Estimates and Forecasts, By Enterprise Size (2020-2032) (USD Billion)
11.4.11 Vietnam
11.4.11.1 Vietnam Web Performance Market Estimates and Forecasts, By Component (2020-2032) (USD Billion)
11.4.11.2 Vietnam Web Performance Market Estimates and Forecasts, By Deployment (2020-2032) (USD Billion)
11.4.11.3 Vietnam Web Performance Market Estimates and Forecasts, By End Use (2020-2032) (USD Billion)
11.4.11.4 Vietnam Web Performance Market Estimates and Forecasts, By Enterprise Size (2020-2032) (USD Billion)
11.4.12 Singapore
11.4.12.1 Singapore Web Performance Market Estimates and Forecasts, By Component (2020-2032) (USD Billion)
11.4.12.2 Singapore Web Performance Market Estimates and Forecasts, By Deployment (2020-2032) (USD Billion)
11.4.12.3 Singapore Web Performance Market Estimates and Forecasts, By End Use (2020-2032) (USD Billion)
11.4.12.4 Singapore Web Performance Market Estimates and Forecasts, By Enterprise Size (2020-2032) (USD Billion)
11.4.13 Australia
11.4.13.1 Australia Web Performance Market Estimates and Forecasts, By Component (2020-2032) (USD Billion)
11.4.13.2 Australia Web Performance Market Estimates and Forecasts, By Deployment (2020-2032) (USD Billion)
11.4.13.3 Australia Web Performance Market Estimates and Forecasts, By End Use (2020-2032) (USD Billion)
11.4.13.4 Australia Web Performance Market Estimates and Forecasts, By Enterprise Size (2020-2032) (USD Billion)
11.4.14 Rest of Asia Pacific
11.4.14.1 Rest of Asia Pacific Web Performance Market Estimates and Forecasts, By Component (2020-2032) (USD Billion)
11.4.14.2 Rest of Asia Pacific Web Performance Market Estimates and Forecasts, By Deployment (2020-2032) (USD Billion)
11.4.14.3 Rest of Asia Pacific Web Performance Market Estimates and Forecasts, By End Use (2020-2032) (USD Billion)
11.4.14.4 Rest of Asia Pacific Web Performance Market Estimates and Forecasts, By Enterprise Size (2020-2032) (USD Billion)
11.5 Middle East and Africa
11.5.1 Middle East
11.5.1.1 Trends Analysis
11.5.1.2 Middle East Web Performance Market Estimates and Forecasts, by Country (2020-2032) (USD Billion)
11.5.1.3 Middle East Web Performance Market Estimates and Forecasts, By Component (2020-2032) (USD Billion)
11.5.1.4 Middle East Web Performance Market Estimates and Forecasts, By Deployment (2020-2032) (USD Billion)
11.5.1.5 Middle East Web Performance Market Estimates and Forecasts, By End Use (2020-2032) (USD Billion)
11.5.1.6 Middle East Web Performance Market Estimates and Forecasts, By Enterprise Size (2020-2032) (USD Billion)
11.5.1.7 UAE
11.5.1.7.1 UAE Web Performance Market Estimates and Forecasts, By Component (2020-2032) (USD Billion)
11.5.1.7.2 UAE Web Performance Market Estimates and Forecasts, By Deployment (2020-2032) (USD Billion)
11.5.1.7.3 UAE Web Performance Market Estimates and Forecasts, By End Use (2020-2032) (USD Billion)
11.5.1.7.4 UAE Web Performance Market Estimates and Forecasts, By Enterprise Size (2020-2032) (USD Billion)
11.5.1.8 Egypt
11.5.1.8.1 Egypt Web Performance Market Estimates and Forecasts, By Component (2020-2032) (USD Billion)
11.5.1.8.2 Egypt Web Performance Market Estimates and Forecasts, By Deployment (2020-2032) (USD Billion)
11.5.1.8.3 Egypt Web Performance Market Estimates and Forecasts, By End Use (2020-2032) (USD Billion)
11.5.1.8.4 Egypt Web Performance Market Estimates and Forecasts, By Enterprise Size (2020-2032) (USD Billion)
11.5.1.9 Saudi Arabia
11.5.1.9.1 Saudi Arabia Web Performance Market Estimates and Forecasts, By Component (2020-2032) (USD Billion)
11.5.1.9.2 Saudi Arabia Web Performance Market Estimates and Forecasts, By Deployment (2020-2032) (USD Billion)
11.5.1.9.3 Saudi Arabia Web Performance Market Estimates and Forecasts, By End Use (2020-2032) (USD Billion)
11.5.1.9.4 Saudi Arabia Web Performance Market Estimates and Forecasts, By Enterprise Size (2020-2032) (USD Billion)
11.5.1.10 Qatar
11.5.1.10.1 Qatar Web Performance Market Estimates and Forecasts, By Component (2020-2032) (USD Billion)
11.5.1.10.2 Qatar Web Performance Market Estimates and Forecasts, By Deployment (2020-2032) (USD Billion)
11.5.1.10.3 Qatar Web Performance Market Estimates and Forecasts, By End Use (2020-2032) (USD Billion)
11.5.1.10.4 Qatar Web Performance Market Estimates and Forecasts, By Enterprise Size (2020-2032) (USD Billion)
11.5.1.11 Rest of Middle East
11.5.1.11.1 Rest of Middle East Web Performance Market Estimates and Forecasts, By Component (2020-2032) (USD Billion)
11.5.1.11.2 Rest of Middle East Web Performance Market Estimates and Forecasts, By Deployment (2020-2032) (USD Billion)
11.5.1.11.3 Rest of Middle East Web Performance Market Estimates and Forecasts, By End Use (2020-2032) (USD Billion)
11.5.1.11.4 Rest of Middle East Web Performance Market Estimates and Forecasts, By Enterprise Size (2020-2032) (USD Billion)
11.5.2 Africa
11.5.2.1 Trends Analysis
11.5.2.2 Africa Web Performance Market Estimates and Forecasts, by Country (2020-2032) (USD Billion)
11.5.2.3 Africa Web Performance Market Estimates and Forecasts, By Component (2020-2032) (USD Billion)
11.5.2.4 Africa Web Performance Market Estimates and Forecasts, By Deployment (2020-2032) (USD Billion)
11.5.2.5 Africa Web Performance Market Estimates and Forecasts, By End Use (2020-2032) (USD Billion)
11.5.2.6 Africa Web Performance Market Estimates and Forecasts, By Enterprise Size (2020-2032) (USD Billion)
11.5.2.7 South Africa
11.5.2.7.1 South Africa Web Performance Market Estimates and Forecasts, By Component (2020-2032) (USD Billion)
11.5.2.7.2 South Africa Web Performance Market Estimates and Forecasts, By Deployment (2020-2032) (USD Billion)
11.5.2.7.3 South Africa Web Performance Market Estimates and Forecasts, By End Use (2020-2032) (USD Billion)
11.5.2.7.4 South Africa Web Performance Market Estimates and Forecasts, By Enterprise Size (2020-2032) (USD Billion)
11.5.2.8 Nigeria
11.5.2.8.1 Nigeria Web Performance Market Estimates and Forecasts, By Component (2020-2032) (USD Billion)
11.5.2.8.2 Nigeria Web Performance Market Estimates and Forecasts, By Deployment (2020-2032) (USD Billion)
11.5.2.8.3 Nigeria Web Performance Market Estimates and Forecasts, By End Use (2020-2032) (USD Billion)
11.5.2.8.4 Nigeria Web Performance Market Estimates and Forecasts, By Enterprise Size (2020-2032) (USD Billion)
11.5.2.9 Rest of Africa
11.5.2.9.1 Rest of Africa Web Performance Market Estimates and Forecasts, By Component (2020-2032) (USD Billion)
11.5.2.9.2 Rest of Africa Web Performance Market Estimates and Forecasts, By Deployment (2020-2032) (USD Billion)
11.5.2.9.3 Rest of Africa Web Performance Market Estimates and Forecasts, By End Use (2020-2032) (USD Billion)
11.5.2.9.4 Rest of Africa Web Performance Market Estimates and Forecasts, By Enterprise Size (2020-2032) (USD Billion)
11.6 Latin America
11.6.1 Trends Analysis
11.6.2 Latin America Web Performance Market Estimates and Forecasts, by Country (2020-2032) (USD Billion)
11.6.3 Latin America Web Performance Market Estimates and Forecasts, By Component (2020-2032) (USD Billion)
11.6.4 Latin America Web Performance Market Estimates and Forecasts, By Deployment (2020-2032) (USD Billion)
11.6.5 Latin America Web Performance Market Estimates and Forecasts, By End Use (2020-2032) (USD Billion)
11.6.6 Latin America Web Performance Market Estimates and Forecasts, By Enterprise Size (2020-2032) (USD Billion)
11.6.7 Brazil
11.6.7.1 Brazil Web Performance Market Estimates and Forecasts, By Component (2020-2032) (USD Billion)
11.6.7.2 Brazil Web Performance Market Estimates and Forecasts, By Deployment (2020-2032) (USD Billion)
11.6.7.3 Brazil Web Performance Market Estimates and Forecasts, By End Use (2020-2032) (USD Billion)
11.6.7.4 Brazil Web Performance Market Estimates and Forecasts, By Enterprise Size (2020-2032) (USD Billion)
11.6.8 Argentina
11.6.8.1 Argentina Web Performance Market Estimates and Forecasts, By Component (2020-2032) (USD Billion)
11.6.8.2 Argentina Web Performance Market Estimates and Forecasts, By Deployment (2020-2032) (USD Billion)
11.6.8.3 Argentina Web Performance Market Estimates and Forecasts, By End Use (2020-2032) (USD Billion)
11.6.8.4 Argentina Web Performance Market Estimates and Forecasts, By Enterprise Size (2020-2032) (USD Billion)
11.6.9 Colombia
11.6.9.1 Colombia Web Performance Market Estimates and Forecasts, By Component (2020-2032) (USD Billion)
11.6.9.2 Colombia Web Performance Market Estimates and Forecasts, By Deployment (2020-2032) (USD Billion)
11.6.9.3 Colombia Web Performance Market Estimates and Forecasts, By End Use (2020-2032) (USD Billion)
11.6.9.4 Colombia Web Performance Market Estimates and Forecasts, By Enterprise Size (2020-2032) (USD Billion)
11.6.10 Rest of Latin America
11.6.10.1 Rest of Latin America Web Performance Market Estimates and Forecasts, By Component (2020-2032) (USD Billion)
11.6.10.2 Rest of Latin America Web Performance Market Estimates and Forecasts, By Deployment (2020-2032) (USD Billion)
11.6.10.3 Rest of Latin America Web Performance Market Estimates and Forecasts, By End Use (2020-2032) (USD Billion)
11.6.10.4 Rest of Latin America Web Performance Market Estimates and Forecasts, By Enterprise Size (2020-2032) (USD Billion)
12. Company Profiles
12.1 Akamai
12.1.1 Company Overview
12.1.2 Financial
12.1.3 Products/ Services Offered
12.1.4 SWOT Analysis
12.2 ZenQ
12.2.1 Company Overview
12.2.2 Financial
12.2.3 Products/ Services Offered
12.2.4 SWOT Analysis
12.3 CA Technologies
12.3.1 Company Overview
12.3.2 Financial
12.3.3 Products/ Services Offered
12.3.4 SWOT Analysis
12.4 New Relic
12.4.1 Company Overview
12.4.2 Financial
12.4.3 Products/ Services Offered
12.4.4 SWOT Analysis
12.5 ThousandEyes
12.5.1 Company Overview
12.5.2 Financial
12.5.3 Products/ Services Offered
12.5.4 SWOT Analysis
12.6 Cavisson
12.6.1 Company Overview
12.6.2 Financial
12.6.3 Products/ Services Offered
12.6.4 SWOT Analysis
12.7 F5 Networks
12.7.1 Company Overview
12.7.2 Financial
12.7.3 Products/ Services Offered
12.7.4 SWOT Analysis
12.8 Neustar
12.8.1 Company Overview
12.8.2 Financial
12.8.3 Products/ Services Offered
12.8.4 SWOT Analysis
12.9 CDNetworks
12.9.1 Company Overview
12.9.2 Financial
12.9.3 Products/ Services Offered
12.9.4 SWOT Analysis
12.10 Netmagic
12.10.1 Company Overview
12.10.2 Financial
12.10.3 Products/ Services Offered
12.10.4 SWOT Analysis
13. Use Cases and Best Practices
14. Conclusion
An accurate research report requires proper strategizing as well as implementation. There are multiple factors involved in the completion of good and accurate research report and selecting the best methodology to compete the research is the toughest part. Since the research reports we provide play a crucial role in any company’s decision-making process, therefore we at SNS Insider always believe that we should choose the best method which gives us results closer to reality. This allows us to reach at a stage wherein we can provide our clients best and accurate investment to output ratio.
Each report that we prepare takes a timeframe of 350-400 business hours for production. Starting from the selection of titles through a couple of in-depth brain storming session to the final QC process before uploading our titles on our website we dedicate around 350 working hours. The titles are selected based on their current market cap and the foreseen CAGR and growth.
The 5 steps process:
Step 1: Secondary Research:
Secondary Research or Desk Research is as the name suggests is a research process wherein, we collect data through the readily available information. In this process we use various paid and unpaid databases which our team has access to and gather data through the same. This includes examining of listed companies’ annual reports, Journals, SEC filling etc. Apart from this our team has access to various associations across the globe across different industries. Lastly, we have exchange relationships with various university as well as individual libraries.

Step 2: Primary Research
When we talk about primary research, it is a type of study in which the researchers collect relevant data samples directly, rather than relying on previously collected data. This type of research is focused on gaining content specific facts that can be sued to solve specific problems. Since the collected data is fresh and first hand therefore it makes the study more accurate and genuine.
We at SNS Insider have divided Primary Research into 2 parts.
Part 1 wherein we interview the KOLs of major players as well as the upcoming ones across various geographic regions. This allows us to have their view over the market scenario and acts as an important tool to come closer to the accurate market numbers. As many as 45 paid and unpaid primary interviews are taken from both the demand and supply side of the industry to make sure we land at an accurate judgement and analysis of the market.
This step involves the triangulation of data wherein our team analyses the interview transcripts, online survey responses and observation of on filed participants. The below mentioned chart should give a better understanding of the part 1 of the primary interview.

Part 2: In this part of primary research the data collected via secondary research and the part 1 of the primary research is validated with the interviews from individual consultants and subject matter experts.
Consultants are those set of people who have at least 12 years of experience and expertise within the industry whereas Subject Matter Experts are those with at least 15 years of experience behind their back within the same space. The data with the help of two main processes i.e., FGDs (Focused Group Discussions) and IDs (Individual Discussions). This gives us a 3rd party nonbiased primary view of the market scenario making it a more dependable one while collation of the data pointers.
Step 3: Data Bank Validation
Once all the information is collected via primary and secondary sources, we run that information for data validation. At our intelligence centre our research heads track a lot of information related to the market which includes the quarterly reports, the daily stock prices, and other relevant information. Our data bank server gets updated every fortnight and that is how the information which we collected using our primary and secondary information is revalidated in real time.

Step 4: QA/QC Process
After all the data collection and validation our team does a final level of quality check and quality assurance to get rid of any unwanted or undesired mistakes. This might include but not limited to getting rid of the any typos, duplication of numbers or missing of any important information. The people involved in this process include technical content writers, research heads and graphics people. Once this process is completed the title gets uploader on our platform for our clients to read it.
Step 5: Final QC/QA Process:
This is the last process and comes when the client has ordered the study. In this process a final QA/QC is done before the study is emailed to the client. Since we believe in giving our clients a good experience of our research studies, therefore, to make sure that we do not lack at our end in any way humanly possible we do a final round of quality check and then dispatch the study to the client.
Key Segments:
By Component
Solution
Services
By Deployment
Cloud
On-premise
By Enterprise Size
Small & Medium Enterprises (SMEs)
Large Enterprises
By End Use
BFSI
IT & Telecom
Manufacturing
Government
Retail & E-commerce
Automotive
Healthcare
Others
Request for Segment Customization as per your Business Requirement: Segment Customization Request
Regional Coverage:
North America
US
Canada
Mexico
Europe
Eastern Europe
Poland
Romania
Hungary
Turkey
Rest of Eastern Europe
Western Europe
Germany
France
UK
Italy
Spain
Netherlands
Switzerland
Austria
Rest of Western Europe
Asia Pacific
China
India
Japan
South Korea
Vietnam
Singapore
Australia
Rest of Asia Pacific
Middle East & Africa
Middle East
UAE
Egypt
Saudi Arabia
Qatar
Rest of Middle East
Africa
Nigeria
South Africa
Rest of Africa
Latin America
Brazil
Argentina
Colombia
Rest of Latin America
Request for Country Level Research Report: Country Level Customization Request
Available Customization
With the given market data, SNS Insider offers customization as per the company’s specific needs. The following customization options are available for the report:
Detailed Volume Analysis
Criss-Cross segment analysis (e.g. Product X Application)
Competitive Product Benchmarking
Geographic Analysis
Additional countries in any of the regions
Customized Data Representation
Detailed analysis and profiling of additional market players
Unified Communications as a Service Market was valued at USD 65.05 billion in 2023 and will reach USD 316.23 billion by 2032, growing at a CAGR of 19.27% by 2032.
Privileged Access Management Market was valued at USD 2.69 billion in 2023 and is expected to reach USD 17.42 billion by 2032, growing at a CAGR of 23.13% from 2024-2032.
Attack Surface Management Market was valued at USD 858.97 million in 2023 and is expected to reach USD 8247.40 million by 2032, growing at a CAGR of 28.60% from 2024-2032
The Gamification Market size was valued at USD 14.3 Billion in 2023 and will grow to USD 113.3 Billion by 2032 and grow at a CAGR of 25.9% by 2032.
5G Services Market was valued at USD 93.47 billion in 2023 and is expected to reach USD 2271.25 billion by 2032, growing at a CAGR of 42.59% by 2032.
Queue Management System Market was valued at USD 0.70 billion in 2023 and will reach USD 1.20 billion by 2032, growing at a CAGR of 6.31% by 2032.

Hi! Click one of our member below to chat on Phone
© 2025 All Rights Reserved by SNS Insider Pvt Ltd


