Get More Information on Wearable Sensors Market - Request Sample Report
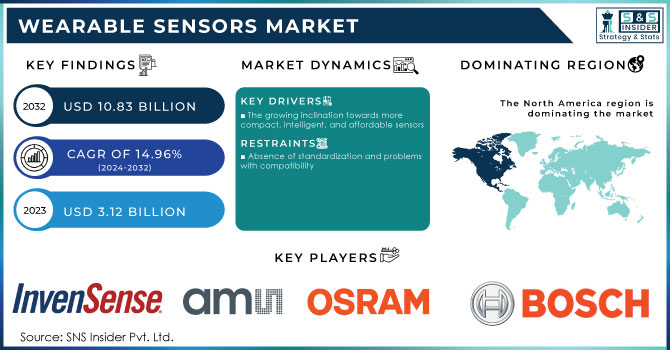
The Wearable Sensors Market Size was valued at USD 3.12 Billion in 2023 and is expected to reach USD 10.83 Billion by 2032 and grow at a CAGR of 14.96% over the forecast period 2024-2032.
Wearable sensors are booming rapidly in the market based on the technology and its adoption of smart gadgets in developing countries. By 2025, close to 1.1 billion wearable devices will be in use worldwide, and most of these will be connected to healthcare and fitness platforms. The current market leaders in wearable technology are smartwatches and fitness bands, with a market share estimated at 45% by 2026, mainly because they collect health data from people between 0-9 years and 60+.
Wearable sensors are also to be integrated into health systems. With the number of chronic diseases on the rise, wearable sensors for diabetic, hypertensive, and cardiac conditions are becoming extremely indispensable. Over 60% of the global population will be suffering from at least one chronic condition by 2030, which will escalate the demand for wearable sensors. After traditional devices like smartwatches, nearly 30% will be captured by upcoming innovations such as smart shoes, clothing, and implantable sensors by 2032.
Wearable sensors also have immense applications in sports and fitness. These devices are increasingly being used for athlete performance monitoring, injury prevention, and optimal programs for training, with the smart wearables in the sports industry expected to attain nearly 20 million units by 2026. In general, advancements in power technology, wireless communication, and sensor technologies are envisioned to sustain continuous market growth which calls for wearable sensors in consumer health and sports technology ecosystems.
KEY DRIVERS:
The growing inclination towards more compact, intelligent, and affordable sensors
The wearable Sensors Market is expected to grow during this period as a direct function of the increasing trend toward smaller, smarter, and more cost-effective sensors. This growth is driven by increased demand for smart platforms like the Internet of Things (IoT). There are also Emerging technologies that enhance the adoption of wearable sensors for plants. The U.N. Food and Agriculture Organization further states that the world has to produce 70% more food by 2050. Agricultural innovation will have to be met with the role of technology in achieving this.
Recent developments in crop monitoring, including sensor-enabled drones and tractors in tandem with low-resolution satellite imagery, have helped farmers scale up crop monitoring. Plant sensors-worn-on body parts take it up to a level higher than this, and it is such innovation that has been underpinned in the 2023 report of the World Economic Forum on emerging technologies.
Besides this, it also appears that with the advancement of smart mobile devices like smartphones and tablets, the costs of sensors have decreased as compared to the past. According to the group specifically to the southeastern US and to their desire to share data captured by the smart devices. We conducted an electronic survey of respondents from the online patient advisory group about smart device ownership, usage, and data sharing. Of the 3021 members of the online patient advisory group, 1368 (45%) completed the survey, including 871 female (64%), 826 and 390 White (60%) and Black (29%) participants, respectively, and a slight majority (52%) age 58 and older. Most of the respondents (98%) owned a smartphone and the majority (59%) owned a wearable. In this population, the most likely to possess a wearable device were those who identify as female, Hispanic and belong to Generation Z (age 18-25), and those with higher education completion levels, who are fully employed. 50 percent of smart device owners would share and 32 percent would consider the sharing of smart device data for research purposes.
RESTRAIN:
Absence of standardization and problems with compatibility
Even though wearable sensors are developing at a very fast rate, some very significant restraints limit them, mostly due to common standards and interoperability issues. Interoperability, which is projected to grow with a strong CAGR between 2024 and 2032, has been an immense challenge that so far hinders the full potential of this market.
Therefore, the lack of universal standards for sensor communications currently restricts market growth. That not only leads to integration problems but also frustrates users whose belongings from multiple brands do not communicate efficiently with each other. The wearable sensors market is likely to boom with the ever-escalating demand for consumers and development in IoT. However, the lack of such standardized solutions has led to fragmentation across platforms.
In addition, the crucial requirement of ensuring safe communication between devices creates another important layer of difficulty in driving further adoption. The long work needed to be done to solve these issues such as security standard definition and implementation will be important in the long term. It is therefore expected that the lack of an overall framework will constrain this projected growth of the wearable sensors market between forecasts since technical limitations will still pose significant challenges against widespread integration and functionality. This shows that collaboration between the enterprises and the developers will be necessary in the setting up of a standard communication protocol and inter-device compatibility.
By Sensor Type
Accelerometer held the largest share at 30% in the wearable sensor market in 2023. The growth in the segment is supported by the increasing inclination of the populace towards the usage of wearable devices in the market. The output of motion sensing with accelerometer sensors is enhanced and gives higher accuracy in tracking and monitoring user activities. The fitness and wellness-related series delivered through the usage of accelerometers in wrist-worn devices serve as a key source of market traction. Further, its ability to separate the step and not to mistake the shaking of just the wrist can be a potential factor in segment growth.
The optical segment is expected to grow at the highest CAGR of 17.81% during the forecasted period 2024-2032. Optical sensors have been linked with growth in wearable devices primarily owing to their application. They are integrated into smart wearables, and they play an essential role by providing accurate electrocardiogram readings with maximum precision. Such factors enable highly sensitive measurement of health parameters and the surrounding environment, hence boosting demand during the forecast period.
By Device type
Smartwatches accounted for the largest share of 39% of wearable sensors in the year 2023 and would expand at the fastest rate of 16.79% over the forecasted period. primarily boosted by advanced sensors including GPS, accelerometers, and heart rate, creating more health and fitness monitoring. Its evolution, ranging from simple fitness bands to feature-packed wearable technologies supporting mobile payments and notification systems along with controls for media, allows the market further to expand in its appeal. Style and personalization appeal to diverse consumers and hence allow expansion in the market.
Smart glasses are the second largest market with a share of 11% in 2023 wearable sensors, which also have increasing adoption due to applications in augmented reality, healthcare, and industrial fields. The glasses come with sensors that will offer real-time data, thus making operations a hands-free affair. Growth in smart glasses would be on an uptrend as more and more industries would embrace AR for training remote assistants and interactive experiences.
BY END USER
The consumer segment holds 50% of the market share in 2023 and is estimated to grow at the highest CAGR of 16.18% during the forecast period. The need for sensor-fused devices is growing as the awareness of remote monitoring of wellness and fitness is becoming quite popular among users. There is a wide variety of factors based on which demand is placed, such as the availability of numerous wearables, technological advancement in sensors, and vendors' ability to provide differentiated products.
Areas of adoption among consumers will continue dominating the market over the forecast period. Critical drivers pushing the shipments of wearables in recent times are increased demand for devices that track fitness, wellness, and lifestyle. Consumers are increasingly preferring wrist-worn, VR headsets, and smart clothing; this is positively impacting the market, and vendors are looking to innovate and provide optimum solutions to users.
Further, the segment is also expected to grow rapidly with increasing consumer spending power, particularly in electronics. Larger companies seem to be coming up with their version of wearables more focused on fusing fashion along with utility. Constant innovation will also be a boon in helping the consumer segment grow further.
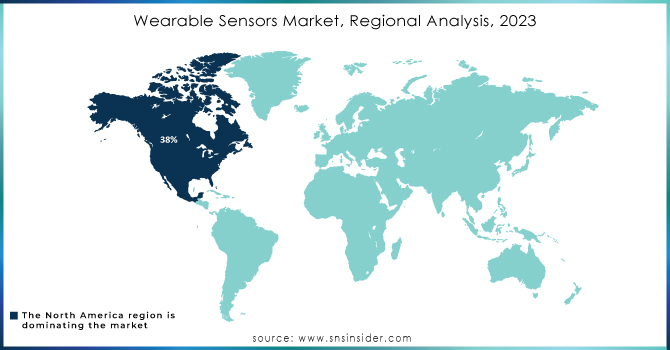
The North American region dominated the wearable sensors market with a revenue share of 38% in 2023. This dominance is due to rapidly increasing awareness of health and fitness. Moreover, the area where wearables can be extremely important lies in the growth of digital technology in the U.S. Apart from this, the region's healthcare industry is doing well, and this will start using wearable sensor-based products more and more throughout the forecast period. The increasing U.S. population with massive health issues among youths coupled with an aging portion is fueling demand for healthcare activity monitoring devices. A wearable sensor is a module in any wearable device. It gives the right and reliable information about the activities and behavioral patterns of a user. A wearable sensor detects activities by monitoring physical and physiological parameters along with other symptoms.
The Asia Pacific wearable sensors market will be seen to grow with a high CAGR of 17.81% during the forecast period 2024-2032. Countries like Japan, South Korea, and China are considered among the top technology hubs in the Asia Pacific region. These OEMs play a significant role in the development of IMUs, MEMS technology, and others, and can promise accuracy while also making it possible to keep the price relatively lower for products developed through them. Many of the enterprises within China have evolved to develop wearables at lower costs, which is attributed to the growing number of users within the market. The growing demand for home healthcare monitoring shall continue to fuel the growth of this market across China for the foreseeable future.
Need Any Customization Research On Wearable Sensors Market - Inquiry Now
Some of the major players in the Wearable Sensors Market are:
InvenSense Inc. (Gyroscopes, accelerometers)
AMS OSRAM AG (Optical sensors, including heart rate sensors)
Bosch Sensortec GmbH (Accelerometers, gyroscopes)
STMicroelectronics (Inertial measurement units (IMUs), pressure sensors)
Infineon Technologies (Power management ICs, microcontrollers)
Knowles Electronics (MEMS microphones and pressure sensors)
NXP Semiconductors (Microcontrollers, NFC chips)
Texas Instruments (Microcontrollers, analog-to-digital converters)
TE Connectivity (Connectors, antennas, and sensors for wearable devices)
Broadcom (Wireless connectivity chips (Bluetooth, Wi-Fi) and NFC)
Analog Devices (ADCs, digital-to-analog converters)
Panasonic (Batteries, sensors, and modules for wearable devices)
Asahi Kasei (Materials for wearable devices, including flexible displays)
Maxim Integrated (Analog ICs, including ADCs)
Renesas Electronics (Microcontrollers, analog ICs)
ON Semiconductor (Power management ICs, analog ICs)
Vishay Intertechnology (Resistors, capacitors)
TDK Corporation (Electronic components, including capacitors)
AVX Corporation (Capacitors and filters)
Honeywell International (Pressure and Humidity sensors)
In May 2024, Sensirion announced its SLD3x series of miniature liquid flow sensor platforms for subcutaneous drug delivery. The product's customizable solutions, according to the company, help to provide precise flow control and contribute to maintaining patient safety for therapies requiring the subcutaneous delivery of medication.
In May 2023, engineers at the University of California, San Diego achieved their first breakthroughs in designing the world's first wearable ultrasound that is fully integrated into the body for deep tissue monitoring. This innovation is a transformative leap in cardiovascular monitoring and lays out life-saving potential ahead of one of the world's leading wearable ultrasound labs.
In May 2023, STMicroelectronics of Switzerland launched a first generation of MEMS pressure sensors said to yield outstanding accuracy and environmental hardness. Gas and water metering, weather monitoring, air conditioning systems, and home appliances are but some applications of the sensors.
| Report Attributes | Details |
|---|---|
| Market Size in 2023 | US$ 3.12 Billion |
| Market Size by 2032 | US$ 10.83 Billion |
| CAGR | CAGR of 14.96% From 2024 to 2032 |
| Base Year | 2023 |
| Forecast Period | 2024-2032 |
| Historical Data | 2020-2022 |
| Report Scope & Coverage | Market Size, Segments Analysis, Competitive Landscape, Regional Analysis, DROC & SWOT Analysis, Forecast Outlook |
| Key Segments | • By Sensor (Accelerometer, Gyroscope, Optical, Force & Pressure, Inertial Sensor, Temperature, Magnetometers, Medical Based Sensors, Others) • By Device type Smartwatch, Fitness Band, Smart Glasses, Smart Fabric, Smart Footwear, Other Wearables) • By End-use (Consumer, Defense, Healthcare, Industrial, Others) |
| Regional Analysis/Coverage | North America (US, Canada, Mexico), Europe (Eastern Europe [Poland, Romania, Hungary, Turkey, Rest of Eastern Europe] Western Europe [Germany, France, UK, Italy, Spain, Netherlands, Switzerland, Austria, Rest of Western Europe]), Asia Pacific (China, India, Japan, South Korea, Vietnam, Singapore, Australia, Rest of Asia Pacific), Middle East & Africa (Middle East [UAE, Egypt, Saudi Arabia, Qatar, Rest of Middle East], Africa [Nigeria, South Africa, Rest of Africa], Latin America (Brazil, Argentina, Colombia, Rest of Latin America) |
| Company Profiles | InvenSense Inc., AMS OSRAM AG, Bosch Sensortec GmbH, STMicroelectronics, Infineon Technologies, Knowles Electronics, NXP Semiconductors, Texas Instruments, TE Connectivity, Broadcom , Analog Devices, Panasonic, Asahi Kasei, Maxim Integrated, Renesas Electronics, ON Semiconductor, Vishay Intertechnology, TDK Corporation AVX Corporation, Honeywell International |
| Key Drivers | • The growing inclination towards more compact, intelligent, and affordable sensors |
| Restraints | • Absence of standardization and problems with compatibility |
Ans: The Wearable Sensor Market is expected to grow at a CAGR of 14.96% during 2024-2032.
Ans: Wearable Sensor Market size was USD 3.12 billion in 2023 and is expected to Reach USD 10.83 billion by 2032.
Ans: The major growth factor of the wearable sensor market is the increasing demand for health monitoring and fitness tracking devices, driven by rising health awareness and technological advancements.
Ans: The Accelerometer segment dominated the Wearable Sensor Market.
Ans: North America dominated the Wearable Sensor Market in 2023.
Table of Content
1. Introduction
1.1 Market Definition
1.2 Scope (Inclusion and Exclusions)
1.3 Research Assumptions
2. Executive Summary
2.1 Market Overview
2.2 Regional Synopsis
2.3 Competitive Summary
3. Research Methodology
3.1 Top-Down Approach
3.2 Bottom-up Approach
3.3. Data Validation
3.4 Primary Interviews
4. Market Dynamics Impact Analysis
4.1 Market Driving Factors Analysis
4.1.1 Drivers
4.1.2 Restraints
4.1.3 Opportunities
4.1.4 Challenges
4.2 PESTLE Analysis
4.3 Porter’s Five Forces Model
5. Statistical Insights and Trends Reporting
5.1 Production Capacity and Utilization Analysis by Region
5.2 Production Volumes, by Region (2023)
5.3 Design Trends (Historic and Future)
5.4 Fab Capacity Utilization (2023)
5.5 Supply Chain Metrics
6. Competitive Landscape
6.1 List of Major Companies, By Region
6.2 Market Share Analysis, By Region
6.3 Product Benchmarking
6.3.1 Product specifications and features
6.3.2 Pricing
6.4 Strategic Initiatives
6.4.1 Marketing and promotional activities
6.4.2 Distribution and Supply Chain Strategies
6.4.3 Expansion plans and new product launches
6.4.4 Strategic partnerships and collaborations
6.5 Technological Advancements
6.6 Market Positioning and Branding
7. Wearable Sensors Market Segmentation, By Sensor Type
7.1 Chapter Overview
7.2 Accelerometer
7.2.1 Accelerometer Market Trends Analysis (2020-2032)
7.2.2 Accelerometer Market Size Estimates and Forecasts to 2032 (USD Billion)
7.3 Gyroscope
7.3.1 Gyroscope Market Trends Analysis (2020-2032)
7.3.2 Gyroscope Market Size Estimates and Forecasts to 2032 (USD Billion)
7.4 Optical
7.4.1 Optical Market Trends Analysis (2020-2032)
7.4.2 Optical Market Size Estimates and Forecasts to 2032 (USD Billion)
7.5 Force & Pressure
7.5.1 Force & Pressure Market Trends Analysis (2020-2032)
7.5.2 Force & Pressure Market Size Estimates and Forecasts to 2032 (USD Billion)
7.6 Inertial Sensor
7.6.1 Inertial Sensor Market Trends Analysis (2020-2032)
7.6.2 Inertial Sensor Market Size Estimates and Forecasts to 2032 (USD Billion)
7.7 Temperature
7.7.1 Temperature Market Trends Analysis (2020-2032)
7.7.2 Temperature Market Size Estimates and Forecasts to 2032 (USD Billion)
7.8 Magnetometers
7.8.1 Magnetometers Market Trends Analysis (2020-2032)
7.8.2 Magnetometers Market Size Estimates and Forecasts to 2032 (USD Billion)
7.9 Medical-Based Sensors
7.9.1 Medical-Based Sensors Market Trends Analysis (2020-2032)
7.9.2 Medical-Based Sensors Market Size Estimates and Forecasts to 2032 (USD Billion)
7.10 Others
7.10.1 Others Market Trends Analysis (2020-2032)
7.10.2 Others Market Size Estimates and Forecasts to 2032 (USD Billion)
8. Wearable Sensors Market Segmentation, By Device Type
8.1 Chapter Overview
8.2 Smartwatch
8.2.1 Smartwatch Market Trends Analysis (2020-2032)
8.2.2 Smartwatch Market Size Estimates and Forecasts to 2032 (USD Billion)
8.3 Fitness Band
8.3.1 Fitness Band Market Trends Analysis (2020-2032)
8.3.2 Fitness Band Market Size Estimates and Forecasts to 2032 (USD Billion)
8.4 Smart Glasses
8.4.1 Smart Glasses Market Trends Analysis (2020-2032)
8.4.2 Smart Glasses Market Size Estimates and Forecasts to 2032 (USD Billion)
8.5 Smart Fabric
8.5.1 Smart Fabric Market Trends Analysis (2020-2032)
8.5.2 Smart Fabric Market Size Estimates and Forecasts to 2032 (USD Billion)
8.6 Smart Footwear
8.6.1 Smart Footwear Market Trends Analysis (2020-2032)
8.6.2 Smart Footwear Market Size Estimates and Forecasts to 2032 (USD Billion)
8.7 Other Wearables
8.7.1 Other Wearables Market Trends Analysis (2020-2032)
8.7.2 Other Wearables Market Size Estimates and Forecasts to 2032 (USD Billion)
9. Wearable Sensors Market Segmentation, By End-use
9.1 Chapter Overview
9.2 Consumer
9.2.1 Consumer Market Trends Analysis (2020-2032)
9.2.2 Consumer Market Size Estimates and Forecasts to 2032 (USD Billion)
9.3 Defense
9.3.1 Defense Market Trends Analysis (2020-2032)
9.3.2 Defense Market Size Estimates and Forecasts to 2032 (USD Billion)
9.4 Healthcare
9.4.1 Healthcare Market Trends Analysis (2020-2032)
9.4.2 Healthcare Market Size Estimates and Forecasts to 2032 (USD Billion)
9.5 Industrial
9.5.1 Industrial Market Trends Analysis (2020-2032)
9.5.2 Industrial Market Size Estimates and Forecasts to 2032 (USD Billion)
9.6 Others
9.6.1 Others Market Trends Analysis (2020-2032)
9.6.2 Others Market Size Estimates and Forecasts to 2032 (USD Billion)
10. Regional Analysis
10.1 Chapter Overview
10.2 North America
10.2.1 Trends Analysis
10.2.2 North America Wearable Sensors Market Estimates and Forecasts, by Country (2020-2032) (USD Billion)
10.2.3 North America Wearable Sensors Market Estimates and Forecasts, by Device Type (2020-2032) (USD Billion)
10.2.4 North America Wearable Sensors Market Estimates and Forecasts, by Sensor Type (2020-2032) (USD Billion)
10.2.5 North America Wearable Sensors Market Estimates and Forecasts, by End Use (2020-2032) (USD Billion)
10.2.6 USA
10.2.6.1 USA Wearable Sensors Market Estimates and Forecasts, by Device Type (2020-2032) (USD Billion)
10.2.6.2 USA Wearable Sensors Market Estimates and Forecasts, by Sensor Type (2020-2032) (USD Billion)
10.2.6.3 USA Wearable Sensors Market Estimates and Forecasts, by End Use (2020-2032) (USD Billion)
10.2.7 Canada
10.2.7.1 Canada Wearable Sensors Market Estimates and Forecasts, by Device Type (2020-2032) (USD Billion)
10.2.7.2 Canada Wearable Sensors Market Estimates and Forecasts, by Sensor Type (2020-2032) (USD Billion)
10.2.7.3 Canada Wearable Sensors Market Estimates and Forecasts, by End Use (2020-2032) (USD Billion)
10.2.8 Mexico
10.2.8.1 Mexico Wearable Sensors Market Estimates and Forecasts, by Device Type (2020-2032) (USD Billion)
10.2.8.2 Mexico Wearable Sensors Market Estimates and Forecasts, by Sensor Type (2020-2032) (USD Billion)
10.2.8.3 Mexico Wearable Sensors Market Estimates and Forecasts, by End Use (2020-2032) (USD Billion)
10.3 Europe
10.3.1 Eastern Europe
10.3.1.1 Trends Analysis
10.3.1.2 Eastern Europe Wearable Sensors Market Estimates and Forecasts, by Country (2020-2032) (USD Billion)
10.3.1.3 Eastern Europe Wearable Sensors Market Estimates and Forecasts, by Device Type (2020-2032) (USD Billion)
10.3.1.4 Eastern Europe Wearable Sensors Market Estimates and Forecasts, by Sensor Type (2020-2032) (USD Billion)
10.3.1.5 Eastern Europe Wearable Sensors Market Estimates and Forecasts, by End Use (2020-2032) (USD Billion)
10.3.1.6 Poland
10.3.1.6.1 Poland Wearable Sensors Market Estimates and Forecasts, by Device Type (2020-2032) (USD Billion)
10.3.1.6.2 Poland Wearable Sensors Market Estimates and Forecasts, by Sensor Type (2020-2032) (USD Billion)
10.3.1.6.3 Poland Wearable Sensors Market Estimates and Forecasts, by End Use (2020-2032) (USD Billion)
10.3.1.7 Romania
10.3.1.7.1 Romania Wearable Sensors Market Estimates and Forecasts, by Device Type (2020-2032) (USD Billion)
10.3.1.7.2 Romania Wearable Sensors Market Estimates and Forecasts, by Sensor Type (2020-2032) (USD Billion)
10.3.1.7.3 Romania Wearable Sensors Market Estimates and Forecasts, by End Use (2020-2032) (USD Billion)
10.3.1.8 Hungary
10.3.1.8.1 Hungary Wearable Sensors Market Estimates and Forecasts, by Device Type (2020-2032) (USD Billion)
10.3.1.8.2 Hungary Wearable Sensors Market Estimates and Forecasts, by Sensor Type (2020-2032) (USD Billion)
10.3.1.8.3 Hungary Wearable Sensors Market Estimates and Forecasts, by End Use (2020-2032) (USD Billion)
10.3.1.9 Turkey
10.3.1.9.1 Turkey Wearable Sensors Market Estimates and Forecasts, by Device Type (2020-2032) (USD Billion)
10.3.1.9.2 Turkey Wearable Sensors Market Estimates and Forecasts, by Sensor Type (2020-2032) (USD Billion)
10.3.1.9.3 Turkey Wearable Sensors Market Estimates and Forecasts, by End Use (2020-2032) (USD Billion)
10.3.1.10 Rest of Eastern Europe
10.3.1.10.1 Rest of Eastern Europe Wearable Sensors Market Estimates and Forecasts, by Device Type (2020-2032) (USD Billion)
10.3.1.10.2 Rest of Eastern Europe Wearable Sensors Market Estimates and Forecasts, by Sensor Type (2020-2032) (USD Billion)
10.3.1.10.3 Rest of Eastern Europe Wearable Sensors Market Estimates and Forecasts, by End Use (2020-2032) (USD Billion)
10.3.2 Western Europe
10.3.2.1 Trends Analysis
10.3.2.2 Western Europe Wearable Sensors Market Estimates and Forecasts, by Country (2020-2032) (USD Billion)
10.3.2.3 Western Europe Wearable Sensors Market Estimates and Forecasts, by Device Type (2020-2032) (USD Billion)
10.3.2.4 Western Europe Wearable Sensors Market Estimates and Forecasts, by Sensor Type (2020-2032) (USD Billion)
10.3.2.5 Western Europe Wearable Sensors Market Estimates and Forecasts, by End Use (2020-2032) (USD Billion)
10.3.2.6 Germany
10.3.2.6.1 Germany Wearable Sensors Market Estimates and Forecasts, by Device Type (2020-2032) (USD Billion)
10.3.2.6.2 Germany Wearable Sensors Market Estimates and Forecasts, by Sensor Type (2020-2032) (USD Billion)
10.3.2.6.3 Germany Wearable Sensors Market Estimates and Forecasts, by End Use (2020-2032) (USD Billion)
10.3.2.7 France
10.3.2.7.1 France Wearable Sensors Market Estimates and Forecasts, by Device Type (2020-2032) (USD Billion)
10.3.2.7.2 France Wearable Sensors Market Estimates and Forecasts, by Sensor Type (2020-2032) (USD Billion)
10.3.2.7.3 France Wearable Sensors Market Estimates and Forecasts, by End Use (2020-2032) (USD Billion)
10.3.2.8 UK
10.3.2.8.1 UK Wearable Sensors Market Estimates and Forecasts, by Device Type (2020-2032) (USD Billion)
10.3.2.8.2 UK Wearable Sensors Market Estimates and Forecasts, by Sensor Type (2020-2032) (USD Billion)
10.3.2.8.3 UK Wearable Sensors Market Estimates and Forecasts, by End Use (2020-2032) (USD Billion)
10.3.2.9 Italy
10.3.2.9.1 Italy Wearable Sensors Market Estimates and Forecasts, by Device Type (2020-2032) (USD Billion)
10.3.2.9.2 Italy Wearable Sensors Market Estimates and Forecasts, by Sensor Type (2020-2032) (USD Billion)
10.3.2.9.3 Italy Wearable Sensors Market Estimates and Forecasts, by End Use (2020-2032) (USD Billion)
10.3.2.10 Spain
10.3.2.10.1 Spain Wearable Sensors Market Estimates and Forecasts, by Device Type (2020-2032) (USD Billion)
10.3.2.10.2 Spain Wearable Sensors Market Estimates and Forecasts, by Sensor Type (2020-2032) (USD Billion)
10.3.2.10.3 Spain Wearable Sensors Market Estimates and Forecasts, by End Use (2020-2032) (USD Billion)
10.3.2.11 Netherlands
10.3.2.11.1 Netherlands Wearable Sensors Market Estimates and Forecasts, by Device Type (2020-2032) (USD Billion)
10.3.2.11.2 Netherlands Wearable Sensors Market Estimates and Forecasts, by Sensor Type (2020-2032) (USD Billion)
10.3.2.11.3 Netherlands Wearable Sensors Market Estimates and Forecasts, by End Use (2020-2032) (USD Billion)
10.3.2.12 Switzerland
10.3.2.12.1 Switzerland Wearable Sensors Market Estimates and Forecasts, by Device Type (2020-2032) (USD Billion)
10.3.2.12.2 Switzerland Wearable Sensors Market Estimates and Forecasts, by Sensor Type (2020-2032) (USD Billion)
10.3.2.12.3 Switzerland Wearable Sensors Market Estimates and Forecasts, by End Use (2020-2032) (USD Billion)
10.3.2.13 Austria
10.3.2.13.1 Austria Wearable Sensors Market Estimates and Forecasts, by Device Type (2020-2032) (USD Billion)
10.3.2.13.2 Austria Wearable Sensors Market Estimates and Forecasts, by Sensor Type (2020-2032) (USD Billion)
10.3.2.13.3 Austria Wearable Sensors Market Estimates and Forecasts, by End Use (2020-2032) (USD Billion)
10.3.2.14 Rest of Western Europe
10.3.2.14.1 Rest of Western Europe Wearable Sensors Market Estimates and Forecasts, by Device Type (2020-2032) (USD Billion)
10.3.2.14.2 Rest of Western Europe Wearable Sensors Market Estimates and Forecasts, by Sensor Type (2020-2032) (USD Billion)
10.3.2.14.3 Rest of Western Europe Wearable Sensors Market Estimates and Forecasts, by End Use (2020-2032) (USD Billion)
10.4 Asia Pacific
10.4.1 Trends Analysis
10.4.2 Asia Pacific Wearable Sensors Market Estimates and Forecasts, by Country (2020-2032) (USD Billion)
10.4.3 Asia Pacific Wearable Sensors Market Estimates and Forecasts, by Device Type (2020-2032) (USD Billion)
10.4.4 Asia Pacific Wearable Sensors Market Estimates and Forecasts, by Sensor Type (2020-2032) (USD Billion)
10.4.5 Asia Pacific Wearable Sensors Market Estimates and Forecasts, by End Use (2020-2032) (USD Billion)
10.4.6 China
10.4.6.1 China Wearable Sensors Market Estimates and Forecasts, by Device Type (2020-2032) (USD Billion)
10.4.6.2 China Wearable Sensors Market Estimates and Forecasts, by Sensor Type (2020-2032) (USD Billion)
10.4.6.3 China Wearable Sensors Market Estimates and Forecasts, by End Use (2020-2032) (USD Billion)
10.4.7 India
10.4.7.1 India Wearable Sensors Market Estimates and Forecasts, by Device Type (2020-2032) (USD Billion)
10.4.7.2 India Wearable Sensors Market Estimates and Forecasts, by Sensor Type (2020-2032) (USD Billion)
10.4.7.3 India Wearable Sensors Market Estimates and Forecasts, by End Use (2020-2032) (USD Billion)
10.4.8 Japan
10.4.8.1 Japan Wearable Sensors Market Estimates and Forecasts, by Device Type (2020-2032) (USD Billion)
10.4.8.2 Japan Wearable Sensors Market Estimates and Forecasts, by Sensor Type (2020-2032) (USD Billion)
10.4.8.3 Japan Wearable Sensors Market Estimates and Forecasts, by End Use (2020-2032) (USD Billion)
10.4.9 South Korea
10.4.9.1 South Korea Wearable Sensors Market Estimates and Forecasts, by Device Type (2020-2032) (USD Billion)
10.4.9.2 South Korea Wearable Sensors Market Estimates and Forecasts, by Sensor Type (2020-2032) (USD Billion)
10.4.9.3 South Korea Wearable Sensors Market Estimates and Forecasts, by End Use (2020-2032) (USD Billion)
10.4.10 Vietnam
10.4.10.1 Vietnam Wearable Sensors Market Estimates and Forecasts, by Device Type (2020-2032) (USD Billion)
10.4.10.2 Vietnam Wearable Sensors Market Estimates and Forecasts, by Sensor Type (2020-2032) (USD Billion)
10.4.10.3 Vietnam Wearable Sensors Market Estimates and Forecasts, by End Use (2020-2032) (USD Billion)
10.4.11 Singapore
10.4.11.1 Singapore Wearable Sensors Market Estimates and Forecasts, by Device Type (2020-2032) (USD Billion)
10.4.11.2 Singapore Wearable Sensors Market Estimates and Forecasts, by Sensor Type (2020-2032) (USD Billion)
10.4.11.3 Singapore Wearable Sensors Market Estimates and Forecasts, by End Use (2020-2032) (USD Billion)
10.4.12 Australia
10.4.12.1 Australia Wearable Sensors Market Estimates and Forecasts, by Device Type (2020-2032) (USD Billion)
10.4.12.2 Australia Wearable Sensors Market Estimates and Forecasts, by Sensor Type (2020-2032) (USD Billion)
10.4.12.3 Australia Wearable Sensors Market Estimates and Forecasts, by End Use (2020-2032) (USD Billion)
10.4.13 Rest of Asia Pacific
10.4.13.1 Rest of Asia Pacific Wearable Sensors Market Estimates and Forecasts, by Device Type (2020-2032) (USD Billion)
10.4.13.2 Rest of Asia Pacific Wearable Sensors Market Estimates and Forecasts, by Sensor Type (2020-2032) (USD Billion)
10.4.13.3 Rest of Asia Pacific Wearable Sensors Market Estimates and Forecasts, by End Use (2020-2032) (USD Billion)
10.5 Middle East and Africa
10.5.1 Middle East
10.5.1.1 Trends Analysis
10.5.1.2 Middle East Wearable Sensors Market Estimates and Forecasts, by Country (2020-2032) (USD Billion)
10.5.1.3 Middle East Wearable Sensors Market Estimates and Forecasts, by Device Type (2020-2032) (USD Billion)
10.5.1.4 Middle East Wearable Sensors Market Estimates and Forecasts, by Sensor Type (2020-2032) (USD Billion)
10.5.1.5 Middle East Wearable Sensors Market Estimates and Forecasts, by End Use (2020-2032) (USD Billion)
10.5.1.6 UAE
10.5.1.6.1 UAE Wearable Sensors Market Estimates and Forecasts, by Device Type (2020-2032) (USD Billion)
10.5.1.6.2 UAE Wearable Sensors Market Estimates and Forecasts, by Sensor Type (2020-2032) (USD Billion)
10.5.1.6.3 UAE Wearable Sensors Market Estimates and Forecasts, by End Use (2020-2032) (USD Billion)
10.5.1.7 Egypt
10.5.1.7.1 Egypt Wearable Sensors Market Estimates and Forecasts, by Device Type (2020-2032) (USD Billion)
10.5.1.7.2 Egypt Wearable Sensors Market Estimates and Forecasts, by Sensor Type (2020-2032) (USD Billion)
10.5.1.7.3 Egypt Wearable Sensors Market Estimates and Forecasts, by End Use (2020-2032) (USD Billion)
10.5.1.8 Saudi Arabia
10.5.1.8.1 Saudi Arabia Wearable Sensors Market Estimates and Forecasts, by Device Type (2020-2032) (USD Billion)
10.5.1.8.2 Saudi Arabia Wearable Sensors Market Estimates and Forecasts, by Sensor Type (2020-2032) (USD Billion)
10.5.1.8.3 Saudi Arabia Wearable Sensors Market Estimates and Forecasts, by End Use (2020-2032) (USD Billion)
10.5.1.9 Qatar
10.5.1.9.1 Qatar Wearable Sensors Market Estimates and Forecasts, by Device Type (2020-2032) (USD Billion)
10.5.1.9.2 Qatar Wearable Sensors Market Estimates and Forecasts, by Sensor Type (2020-2032) (USD Billion)
10.5.1.9.3 Qatar Wearable Sensors Market Estimates and Forecasts, by End Use (2020-2032) (USD Billion)
10.5.1.10 Rest of Middle East
10.5.1.10.1 Rest of Middle East Wearable Sensors Market Estimates and Forecasts, by Device Type (2020-2032) (USD Billion)
10.5.1.10.2 Rest of Middle East Wearable Sensors Market Estimates and Forecasts, by Sensor Type (2020-2032) (USD Billion)
10.5.1.10.3 Rest of Middle East Wearable Sensors Market Estimates and Forecasts, by End Use (2020-2032) (USD Billion)
10.5.2 Africa
10.5.2.1 Trends Analysis
10.5.2.2 Africa Wearable Sensors Market Estimates and Forecasts, by Country (2020-2032) (USD Billion)
10.5.2.3 Africa Wearable Sensors Market Estimates and Forecasts, by Device Type (2020-2032) (USD Billion)
10.5.2.4 Africa Wearable Sensors Market Estimates and Forecasts, by Sensor Type (2020-2032) (USD Billion)
10.5.2.5 Africa Wearable Sensors Market Estimates and Forecasts, by End Use (2020-2032) (USD Billion)
10.5.2.6 South Africa
10.5.2.6.1 South Africa Wearable Sensors Market Estimates and Forecasts, by Device Type (2020-2032) (USD Billion)
10.5.2.6.2 South Africa Wearable Sensors Market Estimates and Forecasts, by Sensor Type (2020-2032) (USD Billion)
10.5.2.6.3 South Africa Wearable Sensors Market Estimates and Forecasts, by End Use (2020-2032) (USD Billion)
10.5.2.7 Nigeria
10.5.2.7.1 Nigeria Wearable Sensors Market Estimates and Forecasts, by Device Type (2020-2032) (USD Billion)
10.5.2.7.2 Nigeria Wearable Sensors Market Estimates and Forecasts, by Sensor Type (2020-2032) (USD Billion)
10.5.2.7.3 Nigeria Wearable Sensors Market Estimates and Forecasts, by End Use (2020-2032) (USD Billion)
10.5.2.8 Rest of Africa
10.5.2.8.1 Rest of Africa Wearable Sensors Market Estimates and Forecasts, by Device Type (2020-2032) (USD Billion)
10.5.2.8.2 Rest of Africa Wearable Sensors Market Estimates and Forecasts, by Sensor Type (2020-2032) (USD Billion)
10.5.2.8.3 Rest of Africa Wearable Sensors Market Estimates and Forecasts, by End Use (2020-2032) (USD Billion)
10.6 Latin America
10.6.1 Trends Analysis
10.6.2 Latin America Wearable Sensors Market Estimates and Forecasts, by Country (2020-2032) (USD Billion)
10.6.3 Latin America Wearable Sensors Market Estimates and Forecasts, by Device Type (2020-2032) (USD Billion)
10.6.4 Latin America Wearable Sensors Market Estimates and Forecasts, by Sensor Type (2020-2032) (USD Billion)
10.6.5 Latin America Wearable Sensors Market Estimates and Forecasts, by End Use (2020-2032) (USD Billion)
10.6.6 Brazil
10.6.6.1 Brazil Wearable Sensors Market Estimates and Forecasts, by Device Type (2020-2032) (USD Billion)
10.6.6.2 Brazil Wearable Sensors Market Estimates and Forecasts, by Sensor Type (2020-2032) (USD Billion)
10.6.6.3 Brazil Wearable Sensors Market Estimates and Forecasts, by End Use (2020-2032) (USD Billion)
10.6.7 Argentina
10.6.7.1 Argentina Wearable Sensors Market Estimates and Forecasts, by Device Type (2020-2032) (USD Billion)
10.6.7.2 Argentina Wearable Sensors Market Estimates and Forecasts, by Sensor Type (2020-2032) (USD Billion)
10.6.7.3 Argentina Wearable Sensors Market Estimates and Forecasts, by End Use (2020-2032) (USD Billion)
10.6.8 Colombia
10.6.8.1 Colombia Wearable Sensors Market Estimates and Forecasts, by Device Type (2020-2032) (USD Billion)
10.6.8.2 Colombia Wearable Sensors Market Estimates and Forecasts, by Sensor Type (2020-2032) (USD Billion)
10.6.8.3 Colombia Wearable Sensors Market Estimates and Forecasts, by End Use (2020-2032) (USD Billion)
10.6.9 Rest of Latin America
10.6.9.1 Rest of Latin America Wearable Sensors Market Estimates and Forecasts, by Device Type (2020-2032) (USD Billion)
10.6.9.2 Rest of Latin America Wearable Sensors Market Estimates and Forecasts, by Sensor Type (2020-2032) (USD Billion)
10.6.9.3 Rest of Latin America Wearable Sensors Market Estimates and Forecasts, by End Use (2020-2032) (USD Billion)
11. Company Profiles
11.1 InvenSense Inc.
11.1.1 Company Overview
11.1.2 Financial
11.1.3 Products/ Services Offered
11.1.4 SWOT Analysis
11.2 AMS OSRAM AG
11.2.1 Company Overview
11.2.2 Financial
11.2.3 Products/ Services Offered
11.2.4 SWOT Analysis
11.3 Bosch Sensortec GmbH
11.3.1 Company Overview
11.3.2 Financial
11.3.3 Products/ Services Offered
11.3.4 SWOT Analysis
11.4 STMicroelectronics
11.4.1 Company Overview
11.4.2 Financial
11.4.3 Products/ Services Offered
11.4.4 SWOT Analysis
11.5 Infineon Technologies
11.5.1 Company Overview
11.5.2 Financial
11.5.3 Products/ Services Offered
11.5.4 SWOT Analysis
11.6 Knowles Electronics
11.6.1 Company Overview
11.6.2 Financial
11.6.3 Products/ Services Offered
11.6.4 SWOT Analysis
11.7 NXP Semiconductors
11.7.1 Company Overview
11.7.2 Financial
11.7.3 Products/ Services Offered
11.7.4 SWOT Analysis
11.8 Texas Instruments
11.8.1 Company Overview
11.8.2 Financial
11.8.3 Products/ Services Offered
11.8.4 SWOT Analysis
11.9 TE Connectivity
11.9.1 Company Overview
11.9.2 Financial
11.9.3 Products/ Services Offered
11.9.4 SWOT Analysis
11.10 Broadcom
11.10.1 Company Overview
11.10.2 Financial
11.10.3 Products/ Services Offered
11.10.4 SWOT Analysis
12. Use Cases and Best Practices
13. Conclusion
An accurate research report requires proper strategizing as well as implementation. There are multiple factors involved in the completion of good and accurate research report and selecting the best methodology to compete the research is the toughest part. Since the research reports we provide play a crucial role in any company’s decision-making process, therefore we at SNS Insider always believe that we should choose the best method which gives us results closer to reality. This allows us to reach at a stage wherein we can provide our clients best and accurate investment to output ratio.
Each report that we prepare takes a timeframe of 350-400 business hours for production. Starting from the selection of titles through a couple of in-depth brain storming session to the final QC process before uploading our titles on our website we dedicate around 350 working hours. The titles are selected based on their current market cap and the foreseen CAGR and growth.
The 5 steps process:
Step 1: Secondary Research:
Secondary Research or Desk Research is as the name suggests is a research process wherein, we collect data through the readily available information. In this process we use various paid and unpaid databases which our team has access to and gather data through the same. This includes examining of listed companies’ annual reports, Journals, SEC filling etc. Apart from this our team has access to various associations across the globe across different industries. Lastly, we have exchange relationships with various university as well as individual libraries.

Step 2: Primary Research
When we talk about primary research, it is a type of study in which the researchers collect relevant data samples directly, rather than relying on previously collected data. This type of research is focused on gaining content specific facts that can be sued to solve specific problems. Since the collected data is fresh and first hand therefore it makes the study more accurate and genuine.
We at SNS Insider have divided Primary Research into 2 parts.
Part 1 wherein we interview the KOLs of major players as well as the upcoming ones across various geographic regions. This allows us to have their view over the market scenario and acts as an important tool to come closer to the accurate market numbers. As many as 45 paid and unpaid primary interviews are taken from both the demand and supply side of the industry to make sure we land at an accurate judgement and analysis of the market.
This step involves the triangulation of data wherein our team analyses the interview transcripts, online survey responses and observation of on filed participants. The below mentioned chart should give a better understanding of the part 1 of the primary interview.

Part 2: In this part of primary research the data collected via secondary research and the part 1 of the primary research is validated with the interviews from individual consultants and subject matter experts.
Consultants are those set of people who have at least 12 years of experience and expertise within the industry whereas Subject Matter Experts are those with at least 15 years of experience behind their back within the same space. The data with the help of two main processes i.e., FGDs (Focused Group Discussions) and IDs (Individual Discussions). This gives us a 3rd party nonbiased primary view of the market scenario making it a more dependable one while collation of the data pointers.
Step 3: Data Bank Validation
Once all the information is collected via primary and secondary sources, we run that information for data validation. At our intelligence centre our research heads track a lot of information related to the market which includes the quarterly reports, the daily stock prices, and other relevant information. Our data bank server gets updated every fortnight and that is how the information which we collected using our primary and secondary information is revalidated in real time.

Step 4: QA/QC Process
After all the data collection and validation our team does a final level of quality check and quality assurance to get rid of any unwanted or undesired mistakes. This might include but not limited to getting rid of the any typos, duplication of numbers or missing of any important information. The people involved in this process include technical content writers, research heads and graphics people. Once this process is completed the title gets uploader on our platform for our clients to read it.
Step 5: Final QC/QA Process:
This is the last process and comes when the client has ordered the study. In this process a final QA/QC is done before the study is emailed to the client. Since we believe in giving our clients a good experience of our research studies, therefore, to make sure that we do not lack at our end in any way humanly possible we do a final round of quality check and then dispatch the study to the client.
BY SENSOR TYPE
Accelerometer
Gyroscope
Optical
Force & Pressure
Inertial Sensor
Temperature
Magnetometers
Medical Based Sensors
Others
By Device Type
Smartwatch
Fitness Band
Smart Glasses
Smart Fabric
Smart Footwear
Other Wearables
By End-Use
Consumer
Defense
Healthcare
Industrial
Others
Request for Segment Customization as per your Business Requirement: Segment Customization Request
REGIONAL COVERAGE:
North America
US
Canada
Mexico
Europe
Eastern Europe
Poland
Romania
Hungary
Turkey
Rest of Eastern Europe
Western Europe
Germany
France
UK
Italy
Spain
Netherlands
Switzerland
Austria
Rest of Western Europe
Asia Pacific
China
India
Japan
South Korea
Vietnam
Singapore
Australia
Rest of Asia Pacific
Middle East & Africa
Middle East
UAE
Egypt
Saudi Arabia
Qatar
Rest of the Middle East
Africa
Nigeria
South Africa
Rest of Africa
Latin America
Brazil
Argentina
Colombia
Request for Country Level Research Report: Country Level Customization Request
Available Customization
With the given market data, SNS Insider offers customization as per the company’s specific needs. The following customization options are available for the report:
Product Analysis
Criss-Cross segment analysis (e.g. Product X Application)
Product Matrix which gives a detailed comparison of product portfolio of each company
Geographic Analysis
Additional countries in any of the regions
Company Information
Detailed analysis and profiling of additional market players (Up to five)
The Sensor Hub Market was valued at USD 29.17 billion in 2023 and is projected to reach USD 125.23 billion by 2032, growing at a CAGR of 17.58% from 2024 to 2032.
The Thin Film Battery Market Size was valued at USD 0.45 Billion in 2023 and is expected to grow at a CAGR of 22.99% to reach USD 2.92 Billion by 2032.
The Airborne Radars Market Size was valued at USD 9.81 Billion in 2023 and is expected to reach USD 18.94 Billion by 2032 and grow at a CAGR of 7.66% over the forecast period 2024-2032.
The Video Measuring System Market Size was valued at USD 0.66 Billion in 2023 and is projected to grow at a CAGR of 5.23% to reach USD 1.38 Billion by 2032
The Artificial Intelligence (AI) in Semiconductor Market Size was valued at USD 48.96 Billion in 2023 and is expected to grow at a CAGR of 15.2% From 2024-2032.
The Rugged Tablet Market Size was valued at USD 0.96 Billion in 2023 and is expected to grow at a CAGR of 6.28% to reach USD 1.66 Billion by 2032.

Hi! Click one of our member below to chat on Phone
© 2025 All Rights Reserved by SNS Insider Pvt Ltd


