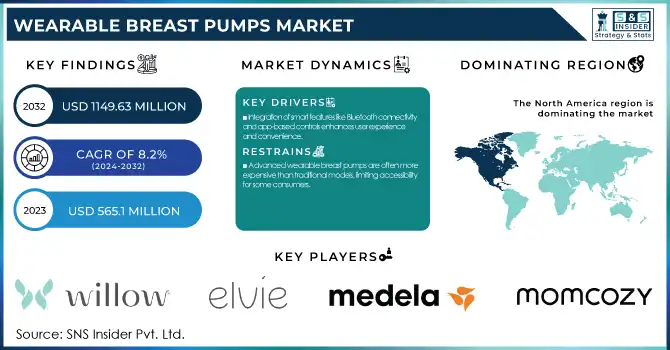
The Wearable Breast Pumps Market Size was valued at USD 565.1 million in 2023 and is expected to reach USD 1149.63 million by 2032, growing at a CAGR of 8.2% over the forecast period 2024-2032.
Get more information on Wearable Breast Pumps Market - Request Sample Report
The wearable breast pumps market report delivers some crucial insights based on the adoption rates across different segments of the target audience including working mothers and first-time users. It analyzes device shipments by volume through 2020-2023 to monitor the growth of the market. By tracking consumer demographics and usage, trends are identified based on age, employment status, and frequency of use. Pricing and cost analysis detail affordability, local price differences, and insurance coverage Technological advancements focus on innovations like silent operation, app connectivity, and hands-free functionality. Regulatory & compliance trends which include FDA approvals, CE markings, and other regional safety standards affecting market penetration. Key drivers of the global wearable breast pumps market include the changing lifestyle of women with their increasing participation in the female workforce and their growing awareness of the benefits that a breast pump provides in a breastfeeding environment.
Drivers
Integration of smart features like Bluetooth connectivity and app-based controls enhances user experience and convenience.
The wearable breast pumps market has undergone tremendous transformation owing to technological advancements, which enable breastfeeding mothers to be more convenient and efficient. Modern wearable breast pumps, such as the Willow and Elvie models, have revolutionized the pumping experience by offering discreet, hands-free operation. These devices are integrated into a bra so mothers can pump milk without external tubes or wires, the mobile, flexible option. A prominent aspect of these sophisticated pumps is the implementation of smart technology. For example, the Elvie pump connects to a smartphone app, providing real-time milk volume monitoring and pumping history tracking and allowing control of the device remotely. This means not only better use of experience but also a amount of data to help mothers manage their breastfeeding routines more effectively. Furthermore, the development of quieter motors and improved suction mechanisms has addressed common concerns associated with traditional breast pumps. Elvie pump is known for its silent function, which helps mothers to pump in public places without getting noticed.
Retsrain
Advanced wearable breast pumps are often more expensive than traditional models, limiting accessibility for some consumers.
The high cost of wearable breast pumps remains a significant barrier to widespread adoption, as premium models with advanced features can range from USD 200 to USD 500 or more. Many consumers find these devices expensive compared to traditional electric or manual pumps, which are available at lower price points. In a 2024 consumer survey, cost was cited by about 42% of new moms as a critical factor influencing their purchase decisions. Moreover, the price of insurance is not homogenous across parts of the world, as only 30% of the similar U.S. insurance policies compensated for all costs generated by a smart wearable breast pump, while others compensated only partially. Long term ownership cost is driven up by the high initial price tag, as well as the costs for replacement accessories like collection cups and valves. However, the affordability hurdle is even more pronounced in emerging markets, with disposable income levels severely limiting market penetration despite an increased level of awareness for the benefits associated with wearable breast pumps.
Opportunity
Increasing product reach through effective marketing strategies, such as Willow Innovations' "Pumping IS Breastfeeding" campaign launched in August 2024.
The wearable breast pumps market presents a significant opportunity through increasing product reach via effective marketing strategies. For example, Willow Innovations introduced the "Pumping IS Breastfeeding" campaign in August 2024 to broaden the breastfeeding dialogue and shift the narrative toward making pumping a normal part of the breastfeeding conversation. This is powered by the increasing women's employment rate globally. According to data released in December 2022, over 993,000 mothers were employed in the United States, and the participation rate for women in the labour force reached 77.0 %. Also, the U.S. Bureau of Labor Statistics says the U.S. unemployment rate for women has fallen from 13.9% in 2020 to 3.3% in 2023.
The awareness and support for working mothers who breastfeed are also to help the market. As an example in Australia in 2023, women accounted for 60.4% of the total employment population. To capture this chance, the company is taking advantage of digital marketplace and marketing channels. Popular platforms including Amazon, Bodily, and Haakaa have reduced prices plus speedy customer support on a wide range of breast pumps and also breast-feeding extras. Moreover, smart wearable breast pumps connected to mobile applications that provide data on milk volume, history of the last pumping, and pumping time can be crucial information that encourages women to carry them in places without pumping spaces.
Challenge
Limited battery capacity and suction along with leakage issues, can affect the overall user experience and adoption rates.
The main challenges in the wearable breast pumps market are limited battery capacity and suction, along with concerns regarding leakage. Recent data from 2025 indicates that battery life remains a concern for many users. For example, the Elvie Pump one of the best wearable breast pumps has a battery life of around 2.5 hours. Although this is better than the earlier models, it still needs regular charging, which may not be possible during a busy mother's schedule. Another challenge is the suction strength, namely that the suction strength of wearable pumps is generally much weaker than that of traditional wall pumps. As a result, some users may not fully empty the breast and this could affect some users' milk supply. Additionally, leakage issues persist in some models. The Elvie Pump, for example, requires careful handling to prevent milk from spilling back into the flange area when removing the pump. These challenges can affect the overall user experience and adoption rates of wearable breast pumps.
By Component
In 2023, wearable pumps held the largest market share of 67%. This growth is driven by the convenience and portability offered by wearable pumps that align perfectly with the needs of modern, active mothers. Such devices enable hidden milk pumping in different settings, such as offices and public areas, resolving obstacles for employed mothers. In addition, new technologies have markedly improved the capabilities of wearable pumps. With features like app connectivity, customizable settings, or noise reduction, their appeal has grown. Consumer confidence was supported by clearance of a number of novel wearable pump designs by the U.S. Food and Drug Administration. Moreover, the Affordable Care Act's requirement for insurance coverage of breast pumps has made the devices available to a wider population. The Centers for Disease Control and Prevention (CDC) reported that 84.1% of infants born in 2022 were breastfed at some point, indicating a strong market for breastfeeding accessories .
By technology
In 2023, Battery-operated wearable breast pumps dominated the market and held the largest revenue share of about 59%. There are several major factors that contribute to this dominance. Battery-operated pumps offer a perfect balance between portability and performance, making them ideal for mothers who need to pump on the go or in various settings. In 2023, 81.9% of employed mothers with children younger than 3 years old were full-time workers, according to the U.S. Department of Labor, showcasing the ever-growing need for pump solutions that fit within busy lifestyles.
The technological advancements in battery life and efficiency have significantly improved the usability of these pumps. Many models now offer extended operation times on a single charge, aligning with typical workday durations. The quiet operation of battery-powered pumps also contributes to their popularity, allowing for discreet use in various environments. Furthermore, the Centers for Disease Control and Prevention (CDC) reported that in 2022, 58.3% of mothers were still breastfeeding at 6 months postpartum, indicating a sustained need for efficient pumping solutions over extended periods.
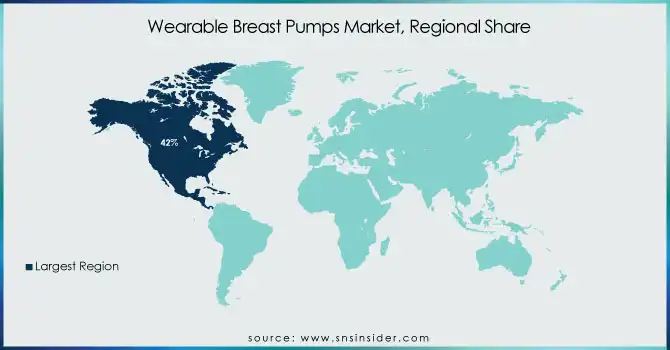
The North American region dominated and held 42% share of the wearable breast pumps market in 2023. The dominance of North America can be majorly attributed to high awareness regarding the benefits of breastfeeding along with favourable policies and advanced healthcare infrastructure. The U.S. Centers for Disease Control and Prevention reported that 84.1% of infants born in 2022 were breastfed at some point, indicating a strong culture of breastfeeding support. The region's high female labor force participation rate, which stood at 56.8% in 2023 according to the U.S. Bureau of Labor Statistics, has driven demand for convenient pumping solutions. Moreover, the Affordable Care Act requires that insurance cover the cost of breast pumps.
Asia-Pacific region is anticipated to grow at the highest CAGR throughout the forecast period, 2024 -2032. The rapid growth in the Asia-Pacific region where urbanization is occurring at an unprecedented rate along with higher disposable incomes and improving awareness of breastfeeding benefits are the key factors driving the market. The World Bank also stated that female labor force participation in East Asia and Pacific was 59.4% in 2023, thus reflecting a significant potential market. In addition, the market for breastfeeding products in the region is benefiting from government initiatives encouraging breastfeeding, such as China's national nutrition plan (2017-2030) which seeks to boost the exclusive breastfeeding rate to 50% in the nation by the year 2030.
Need any customization research on Wearable Breast Pumps Market - Enquiry Now
Key Players
Key Service Providers/Manufacturers
Willow Innovations, Inc.: (Willow Go, Willow 360)
Elvie: (Elvie Pump, Elvie Stride)
Medela LLC: (Freestyle Hands-free Breast Pump, Swing Maxi Hands-free)
Lansinoh Laboratories Inc.: (Lansinoh Wearable Pump)
Momcozy: (S12 Pro, S9 Pro)
Paruu: (P3 Wearable Pump, X2 Wearable Pump)
Spectra Baby: (Spectra Wearable Breast Pump)
LuvLap: (Melody Wearable Electric Breast Pump)
Fraupow: (Fraupow Wearable Breast Pump)
Tommee Tippee: (Made for Me Wearable Breast Pump)
Users:
Working mothers in corporate sectors
Healthcare professionals
Flight attendants
Teachers
Retail workers
Freelancers and remote workers
Military personnel
Athletes
Students
Recent developments:
In March 2024, Medela announced its latest "Freestyle Hands-free" breast pump, which is wearable, and silent through new noise reduction technology and offers a companion app that creates individualized pumping schedules. The launch led to a 15% increase in the company's sales of its wearable pump.
In November 2023, market leader Elvie announced its expansion into a U.S. manufacturing facility in order to meet increasing consumer demand. There was its reported U.S. sales growth, with the company's seeing a 30% year-over-year gain for its wearable pumps.
In February 2025, Willow Innovations added features such as longer battery life and better milk flow sensors and called it the next-generation wearable pump, the Willow Go 2.0. Pre-orders for the new model were 40% higher than expected, the company reported.
Report Attributes | Details |
---|---|
Market Size in 2023 | USD 5651 Million |
Market Size by 2032 | USD 1149.6 Million |
CAGR | CAGR of 8.2% From 2024 to 2032 |
Base Year | 2023 |
Forecast Period | 2024-2032 |
Historical Data | 2020-2022 |
Report Scope & Coverage | Market Size, Segments Analysis, Competitive Landscape, Regional Analysis, DROC & SWOT Analysis, Forecast Outlook |
Key Segments | • By Component (Wearable Pumps, Accessories) • By Technology (Manual Wearable Breast Pump, Battery Operated Wearable Breast Pump, Smart Wearable Breast Pump) |
Regional Analysis/Coverage | North America (US, Canada, Mexico), Europe (Eastern Europe [Poland, Romania, Hungary, Turkey, Rest of Eastern Europe] Western Europe] Germany, France, UK, Italy, Spain, Netherlands, Switzerland, Austria, Rest of Western Europe]), Asia Pacific (China, India, Japan, South Korea, Vietnam, Singapore, Australia, Rest of Asia Pacific), Middle East & Africa (Middle East [UAE, Egypt, Saudi Arabia, Qatar, Rest of Middle East], Africa [Nigeria, South Africa, Rest of Africa], Latin America (Brazil, Argentina, Colombia, Rest of Latin America) |
Company Profiles | Willow Innovations, Inc., Elvie, Medela LLC, Lansinoh Laboratories Inc., Momcozy, Paruu, Spectra Baby, LuvLap, Fraupow, Tommee Tippee |
Ans. The projected market size for the Wearable Breast Pump Market is USD 1149.6 Million by 2032.
Ans: The Asia Pacific region is growing with the fastest CAGR in the Wearable Breast Pump Market over the forecast period.
Ans. The CAGR of the Wearable Breast Pump Market is 8.2% During the forecast period of 2024-2032.
Ans: The Strategic Initiatives provided under the Wearable Breast Pump Market report,
Marketing and promotional activities
Distribution and supply chain strategies
Expansion plans and new product launches
Strategic partnerships and collaborations
Technological Advancements
Market Positioning and Branding
Ans: The Wearable Pumps component segment dominated the Wearable Breast Pump Market
1. Introduction
1.1 Market Definition
1.2 Scope (Inclusion and Exclusions)
1.3 Research Assumptions
2. Executive Summary
2.1 Market Overview
2.2 Regional Synopsis
2.3 Competitive Summary
3. Research Methodology
3.1 Top-Down Approach
3.2 Bottom-up Approach
3.3. Data Validation
3.4 Primary Interviews
4. Market Dynamics Impact Analysis
4.1 Market Driving Factors Analysis
4.1.2 Drivers
4.1.2 Restraints
4.1.3 Opportunities
4.1.4 Challenges
4.2 PESTLE Analysis
4.3 Porter’s Five Forces Model
5. Statistical Insights and Trends Reporting
5.1 Device Shipment Volume (2020-2023)
5.2 Consumer Demographics & Usage Patterns
5.3 Pricing and Cost Analysis
5.4 Technological Advancements & Feature Analysis
5.5 Regulatory and Compliance Trends
6. Competitive Landscape
6.1 List of Major Companies, By Region
6.2 Market Share Analysis, By Region
6.3 Product Benchmarking
6.3.1 Product specifications and features
6.3.2 Pricing
6.4 Strategic Initiatives
6.4.1 Marketing and promotional activities
6.4.2 Distribution and supply chain strategies
6.4.3 Expansion plans and new product launches
6.4.4 Strategic partnerships and collaborations
6.5 Technological Advancements
6.6 Market Positioning and Branding
7. Wearable Breast Pump Market Segmentation, By Component
7.1 Chapter Overview
7.2 Wearable Pumps
7.2.1 Wearable Pumps Market Trends Analysis (2020-2032)
7.2.2 Wearable Pumps Market Size Estimates and Forecasts to 2032 (USD Million)
7.3 Accessories
7.3.1 Accessories Market Trends Analysis (2020-2032)
7.3.2 Accessories Market Size Estimates and Forecasts to 2032 (USD Million)
8. Wearable Breast Pump Market Segmentation, By Technology
8.1 Chapter Overview
8.2 Manual Wearable Breast Pump
8.2.1 Manual Wearable Breast Pump Market Trends Analysis (2020-2032)
8.2.2 Manual Wearable Breast Pump Market Size Estimates and Forecasts to 2032 (USD Million)
8.3 Smart Wearable Breast Pump
8.3.1 Smart Wearable Breast Pump Market Trends Analysis (2020-2032)
8.3.2 Smart Wearable Breast Pump Market Size Estimates and Forecasts to 2032 (USD Million)
8.4 Battery Operated Wearable Breast Pump
8.4.1 Battery Operated Wearable Breast Pump Market Trends Analysis (2020-2032)
8.4.2 Battery Operated Wearable Breast Pump Market Size Estimates and Forecasts to 2032 (USD Million)
9. Regional Analysis
9.1 Chapter Overview
9.2 North America
9.2.1 Trends Analysis
9.2.2 North America Wearable Breast Pump Market Estimates and Forecasts, by Country (2020-2032) (USD Million)
9.2.3 North America Wearable Breast Pump Market Estimates and Forecasts, By Component (2020-2032) (USD Million)
9.2.4 North America Wearable Breast Pump Market Estimates and Forecasts, By Technology (2020-2032) (USD Million)
9.2.5 USA
9.2.5.1 USA Wearable Breast Pump Market Estimates and Forecasts, By Component (2020-2032) (USD Million)
9.2.5.2 USA Wearable Breast Pump Market Estimates and Forecasts, By Technology (2020-2032) (USD Million)
9.2.6 Canada
9.2.6.1 Canada Wearable Breast Pump Market Estimates and Forecasts, By Component (2020-2032) (USD Million)
9.2.6.2 Canada Wearable Breast Pump Market Estimates and Forecasts, By Technology (2020-2032) (USD Million)
9.2.7 Mexico
9.2.7.1 Mexico Wearable Breast Pump Market Estimates and Forecasts, By Component (2020-2032) (USD Million)
9.2.7.2 Mexico Wearable Breast Pump Market Estimates and Forecasts, By Technology (2020-2032) (USD Million)
9.3 Europe
9.3.1 Eastern Europe
9.3.1.1 Trends Analysis
9.3.1.2 Eastern Europe Wearable Breast Pump Market Estimates and Forecasts, by Country (2020-2032) (USD Million)
9.3.1.3 Eastern Europe Wearable Breast Pump Market Estimates and Forecasts, By Component (2020-2032) (USD Million)
9.3.1.4 Eastern Europe Wearable Breast Pump Market Estimates and Forecasts, By Technology (2020-2032) (USD Million)
9.3.1.5 Poland
9.3.1.5.1 Poland Wearable Breast Pump Market Estimates and Forecasts, By Component (2020-2032) (USD Million)
9.3.1.5.2 Poland Wearable Breast Pump Market Estimates and Forecasts, By Technology (2020-2032) (USD Million)
9.3.1.6 Romania
9.3.1.6.1 Romania Wearable Breast Pump Market Estimates and Forecasts, By Component (2020-2032) (USD Million)
9.3.1.6.2 Romania Wearable Breast Pump Market Estimates and Forecasts, By Technology (2020-2032) (USD Million)
9.3.1.7 Hungary
9.3.1.7.1 Hungary Wearable Breast Pump Market Estimates and Forecasts, By Component (2020-2032) (USD Million)
9.3.1.7.2 Hungary Wearable Breast Pump Market Estimates and Forecasts, By Technology (2020-2032) (USD Million)
9.3.1.8 Turkey
9.3.1.8.1 Turkey Wearable Breast Pump Market Estimates and Forecasts, By Component (2020-2032) (USD Million)
9.3.1.8.2 Turkey Wearable Breast Pump Market Estimates and Forecasts, By Technology (2020-2032) (USD Million)
9.3.1.9 Rest of Eastern Europe
9.3.1.9.1 Rest of Eastern Europe Wearable Breast Pump Market Estimates and Forecasts, By Component (2020-2032) (USD Million)
9.3.1.9.2 Rest of Eastern Europe Wearable Breast Pump Market Estimates and Forecasts, By Technology (2020-2032) (USD Million)
9.3.2 Western Europe
9.3.2.1 Trends Analysis
9.3.2.2 Western Europe Wearable Breast Pump Market Estimates and Forecasts, by Country (2020-2032) (USD Million)
9.3.2.3 Western Europe Wearable Breast Pump Market Estimates and Forecasts, By Component (2020-2032) (USD Million)
9.3.2.4 Western Europe Wearable Breast Pump Market Estimates and Forecasts, By Technology (2020-2032) (USD Million)
9.3.2.5 Germany
9.3.2.5.1 Germany Wearable Breast Pump Market Estimates and Forecasts, By Component (2020-2032) (USD Million)
9.3.2.5.2 Germany Wearable Breast Pump Market Estimates and Forecasts, By Technology (2020-2032) (USD Million)
9.3.2.6 France
9.3.2.6.1 France Wearable Breast Pump Market Estimates and Forecasts, By Component (2020-2032) (USD Million)
9.3.2.6.2 France Wearable Breast Pump Market Estimates and Forecasts, By Technology (2020-2032) (USD Million)
9.3.2.7 UK
9.3.2.7.1 UK Wearable Breast Pump Market Estimates and Forecasts, By Component (2020-2032) (USD Million)
9.3.2.7.2 UK Wearable Breast Pump Market Estimates and Forecasts, By Technology (2020-2032) (USD Million)
9.3.2.8 Italy
9.3.2.8.1 Italy Wearable Breast Pump Market Estimates and Forecasts, By Component (2020-2032) (USD Million)
9.3.2.8.2 Italy Wearable Breast Pump Market Estimates and Forecasts, By Technology (2020-2032) (USD Million)
9.3.2.9 Spain
9.3.2.9.1 Spain Wearable Breast Pump Market Estimates and Forecasts, By Component (2020-2032) (USD Million)
9.3.2.9.2 Spain Wearable Breast Pump Market Estimates and Forecasts, By Technology (2020-2032) (USD Million)
9.3.2.10 Netherlands
9.3.2.10.1 Netherlands Wearable Breast Pump Market Estimates and Forecasts, By Component (2020-2032) (USD Million)
9.3.2.10.2 Netherlands Wearable Breast Pump Market Estimates and Forecasts, By Technology (2020-2032) (USD Million)
9.3.2.11 Switzerland
9.3.2.11.1 Switzerland Wearable Breast Pump Market Estimates and Forecasts, By Component (2020-2032) (USD Million)
9.3.2.11.2 Switzerland Wearable Breast Pump Market Estimates and Forecasts, By Technology (2020-2032) (USD Million)
9.3.2.12 Austria
9.3.2.12.1 Austria Wearable Breast Pump Market Estimates and Forecasts, By Component (2020-2032) (USD Million)
9.3.2.12.2 Austria Wearable Breast Pump Market Estimates and Forecasts, By Technology (2020-2032) (USD Million)
9.3.2.13 Rest of Western Europe
9.3.2.13.1 Rest of Western Europe Wearable Breast Pump Market Estimates and Forecasts, By Component (2020-2032) (USD Million)
9.3.2.13.2 Rest of Western Europe Wearable Breast Pump Market Estimates and Forecasts, By Technology (2020-2032) (USD Million)
9.4 Asia Pacific
9.4.1 Trends Analysis
9.4.2 Asia Pacific Wearable Breast Pump Market Estimates and Forecasts, by Country (2020-2032) (USD Million)
9.4.3 Asia Pacific Wearable Breast Pump Market Estimates and Forecasts, By Component (2020-2032) (USD Million)
9.4.4 Asia Pacific Wearable Breast Pump Market Estimates and Forecasts, By Technology (2020-2032) (USD Million)
9.4.5 China
9.4.5.1 China Wearable Breast Pump Market Estimates and Forecasts, By Component (2020-2032) (USD Million)
9.4.5.2 China Wearable Breast Pump Market Estimates and Forecasts, By Technology (2020-2032) (USD Million)
9.4.6 India
9.4.5.1 India Wearable Breast Pump Market Estimates and Forecasts, By Component (2020-2032) (USD Million)
9.4.5.2 India Wearable Breast Pump Market Estimates and Forecasts, By Technology (2020-2032) (USD Million)
9.4.5 Japan
9.4.5.1 Japan Wearable Breast Pump Market Estimates and Forecasts, By Component (2020-2032) (USD Million)
9.4.5.2 Japan Wearable Breast Pump Market Estimates and Forecasts, By Technology (2020-2032) (USD Million)
9.4.6 South Korea
9.4.6.1 South Korea Wearable Breast Pump Market Estimates and Forecasts, By Component (2020-2032) (USD Million)
9.4.6.2 South Korea Wearable Breast Pump Market Estimates and Forecasts, By Technology (2020-2032) (USD Million)
9.4.7 Vietnam
9.4.7.1 Vietnam Wearable Breast Pump Market Estimates and Forecasts, By Component (2020-2032) (USD Million)
9.2.7.2 Vietnam Wearable Breast Pump Market Estimates and Forecasts, By Technology (2020-2032) (USD Million)
9.4.8 Singapore
9.4.8.1 Singapore Wearable Breast Pump Market Estimates and Forecasts, By Component (2020-2032) (USD Million)
9.4.8.2 Singapore Wearable Breast Pump Market Estimates and Forecasts, By Technology (2020-2032) (USD Million)
9.4.9 Australia
9.4.9.1 Australia Wearable Breast Pump Market Estimates and Forecasts, By Component (2020-2032) (USD Million)
9.4.9.2 Australia Wearable Breast Pump Market Estimates and Forecasts, By Technology (2020-2032) (USD Million)
9.4.10 Rest of Asia Pacific
9.4.10.1 Rest of Asia Pacific Wearable Breast Pump Market Estimates and Forecasts, By Component (2020-2032) (USD Million)
9.4.10.2 Rest of Asia Pacific Wearable Breast Pump Market Estimates and Forecasts, By Technology (2020-2032) (USD Million)
9.5 Middle East and Africa
9.5.1 Middle East
9.5.1.1 Trends Analysis
9.5.1.2 Middle East Wearable Breast Pump Market Estimates and Forecasts, by Country (2020-2032) (USD Million)
9.5.1.3 Middle East Wearable Breast Pump Market Estimates and Forecasts, By Component (2020-2032) (USD Million)
9.5.1.4 Middle East Wearable Breast Pump Market Estimates and Forecasts, By Technology (2020-2032) (USD Million)
9.5.1.5 UAE
9.5.1.5.1 UAE Wearable Breast Pump Market Estimates and Forecasts, By Component (2020-2032) (USD Million)
9.5.1.5.2 UAE Wearable Breast Pump Market Estimates and Forecasts, By Technology (2020-2032) (USD Million)
9.5.1.6 Egypt
9.5.1.6.1 Egypt Wearable Breast Pump Market Estimates and Forecasts, By Component (2020-2032) (USD Million)
9.5.1.6.2 Egypt Wearable Breast Pump Market Estimates and Forecasts, By Technology (2020-2032) (USD Million)
9.5.1.7 Saudi Arabia
9.5.1.7.1 Saudi Arabia Wearable Breast Pump Market Estimates and Forecasts, By Component (2020-2032) (USD Million)
9.5.1.7.2 Saudi Arabia Wearable Breast Pump Market Estimates and Forecasts, By Technology (2020-2032) (USD Million)
9.5.1.8 Qatar
9.5.1.8.1 Qatar Wearable Breast Pump Market Estimates and Forecasts, By Component (2020-2032) (USD Million)
9.5.1.8.2 Qatar Wearable Breast Pump Market Estimates and Forecasts, By Technology (2020-2032) (USD Million)
9.5.1.9 Rest of Middle East
9.5.1.9.1 Rest of Middle East Wearable Breast Pump Market Estimates and Forecasts, By Component (2020-2032) (USD Million)
9.5.1.9.2 Rest of Middle East Wearable Breast Pump Market Estimates and Forecasts, By Technology (2020-2032) (USD Million)
9.5.2 Africa
9.5.2.1 Trends Analysis
9.5.2.2 Africa Wearable Breast Pump Market Estimates and Forecasts, by Country (2020-2032) (USD Million)
9.5.2.3 Africa Wearable Breast Pump Market Estimates and Forecasts, By Component (2020-2032) (USD Million)
9.5.2.4 Africa Wearable Breast Pump Market Estimates and Forecasts, By Technology (2020-2032) (USD Million)
9.5.2.5 South Africa
9.5.2.5.1 South Africa Wearable Breast Pump Market Estimates and Forecasts, By Component (2020-2032) (USD Million)
9.5.2.5.2 South Africa Wearable Breast Pump Market Estimates and Forecasts, By Technology (2020-2032) (USD Million)
9.5.2.6 Nigeria
9.5.2.6.1 Nigeria Wearable Breast Pump Market Estimates and Forecasts, By Component (2020-2032) (USD Million)
9.5.2.6.2 Nigeria Wearable Breast Pump Market Estimates and Forecasts, By Technology (2020-2032) (USD Million)
9.5.2.7 Rest of Africa
9.5.2.7.1 Rest of Africa Wearable Breast Pump Market Estimates and Forecasts, By Component (2020-2032) (USD Million)
9.5.2.7.2 Rest of Africa Wearable Breast Pump Market Estimates and Forecasts, By Technology (2020-2032) (USD Million)
9.6 Latin America
9.6.1 Trends Analysis
9.6.2 Latin America Wearable Breast Pump Market Estimates and Forecasts, by Country (2020-2032) (USD Million)
9.6.3 Latin America Wearable Breast Pump Market Estimates and Forecasts, By Component (2020-2032) (USD Million)
9.6.4 Latin America Wearable Breast Pump Market Estimates and Forecasts, By Technology (2020-2032) (USD Million)
9.6.5 Brazil
9.6.5.1 Brazil Wearable Breast Pump Market Estimates and Forecasts, By Component (2020-2032) (USD Million)
9.6.5.2 Brazil Wearable Breast Pump Market Estimates and Forecasts, By Technology (2020-2032) (USD Million)
9.6.6 Argentina
9.6.6.1 Argentina Wearable Breast Pump Market Estimates and Forecasts, By Component (2020-2032) (USD Million)
9.6.6.2 Argentina Wearable Breast Pump Market Estimates and Forecasts, By Technology (2020-2032) (USD Million)
9.6.7 Colombia
9.6.7.1 Colombia Wearable Breast Pump Market Estimates and Forecasts, By Component (2020-2032) (USD Million)
9.6.7.2 Colombia Wearable Breast Pump Market Estimates and Forecasts, By Technology (2020-2032) (USD Million)
9.6.8 Rest of Latin America
9.6.8.1 Rest of Latin America Wearable Breast Pump Market Estimates and Forecasts, By Component (2020-2032) (USD Million)
9.6.8.2 Rest of Latin America Wearable Breast Pump Market Estimates and Forecasts, By Technology (2020-2032) (USD Million)
10. Company Profiles
10.1 Willow Innovations, Inc.
10.1.1 Company Overview
10.1.2 Financial
10.1.3 Products/ Services Offered
110.1.4 SWOT Analysis
10.2 Elvie
10.2.1 Company Overview
10.2.2 Financial
10.2.3 Products/ Services Offered
10.2.4 SWOT Analysis
10.3 Medela LLC
10.3.1 Company Overview
10.3.2 Financial
10.3.3 Products/ Services Offered
10.3.4 SWOT Analysis
10.4 Lansinoh Laboratories Inc.
10.4.1 Company Overview
10.4.2 Financial
10.4.3 Products/ Services Offered
10.4.4 SWOT Analysis
10.5 Momcozy
10.5.1 Company Overview
10.5.2 Financial
10.5.3 Products/ Services Offered
10.5.4 SWOT Analysis
10.6 Paruu
10.6.1 Company Overview
10.6.2 Financial
10.6.3 Products/ Services Offered
10.6.4 SWOT Analysis
10.7 Spectra Baby
10.7.1 Company Overview
10.7.2 Financial
10.7.3 Products/ Services Offered
10.7.4 SWOT Analysis
10.8 LuvLap
10.8.1 Company Overview
10.8.2 Financial
10.8.3 Products/ Services Offered
10.8.4 SWOT Analysis
10.9 Fraupow
10.9.1 Company Overview
10.9.2 Financial
10.9.3 Products/ Services Offered
10.9.4 SWOT Analysis
10.10 Tommee Tippee
10.9.1 Company Overview
10.9.2 Financial
10.9.3 Products/ Services Offered
10.9.4 SWOT Analysis
11. Use Cases and Best Practices
12. Conclusion
An accurate research report requires proper strategizing as well as implementation. There are multiple factors involved in the completion of good and accurate research report and selecting the best methodology to compete the research is the toughest part. Since the research reports we provide play a crucial role in any company’s decision-making process, therefore we at SNS Insider always believe that we should choose the best method which gives us results closer to reality. This allows us to reach at a stage wherein we can provide our clients best and accurate investment to output ratio.
Each report that we prepare takes a timeframe of 350-400 business hours for production. Starting from the selection of titles through a couple of in-depth brain storming session to the final QC process before uploading our titles on our website we dedicate around 350 working hours. The titles are selected based on their current market cap and the foreseen CAGR and growth.
The 5 steps process:
Step 1: Secondary Research:
Secondary Research or Desk Research is as the name suggests is a research process wherein, we collect data through the readily available information. In this process we use various paid and unpaid databases which our team has access to and gather data through the same. This includes examining of listed companies’ annual reports, Journals, SEC filling etc. Apart from this our team has access to various associations across the globe across different industries. Lastly, we have exchange relationships with various university as well as individual libraries.
Step 2: Primary Research
When we talk about primary research, it is a type of study in which the researchers collect relevant data samples directly, rather than relying on previously collected data. This type of research is focused on gaining content specific facts that can be sued to solve specific problems. Since the collected data is fresh and first hand therefore it makes the study more accurate and genuine.
We at SNS Insider have divided Primary Research into 2 parts.
Part 1 wherein we interview the KOLs of major players as well as the upcoming ones across various geographic regions. This allows us to have their view over the market scenario and acts as an important tool to come closer to the accurate market numbers. As many as 45 paid and unpaid primary interviews are taken from both the demand and supply side of the industry to make sure we land at an accurate judgement and analysis of the market.
This step involves the triangulation of data wherein our team analyses the interview transcripts, online survey responses and observation of on filed participants. The below mentioned chart should give a better understanding of the part 1 of the primary interview.
Part 2: In this part of primary research the data collected via secondary research and the part 1 of the primary research is validated with the interviews from individual consultants and subject matter experts.
Consultants are those set of people who have at least 12 years of experience and expertise within the industry whereas Subject Matter Experts are those with at least 15 years of experience behind their back within the same space. The data with the help of two main processes i.e., FGDs (Focused Group Discussions) and IDs (Individual Discussions). This gives us a 3rd party nonbiased primary view of the market scenario making it a more dependable one while collation of the data pointers.
Step 3: Data Bank Validation
Once all the information is collected via primary and secondary sources, we run that information for data validation. At our intelligence centre our research heads track a lot of information related to the market which includes the quarterly reports, the daily stock prices, and other relevant information. Our data bank server gets updated every fortnight and that is how the information which we collected using our primary and secondary information is revalidated in real time.
Step 4: QA/QC Process
After all the data collection and validation our team does a final level of quality check and quality assurance to get rid of any unwanted or undesired mistakes. This might include but not limited to getting rid of the any typos, duplication of numbers or missing of any important information. The people involved in this process include technical content writers, research heads and graphics people. Once this process is completed the title gets uploader on our platform for our clients to read it.
Step 5: Final QC/QA Process:
This is the last process and comes when the client has ordered the study. In this process a final QA/QC is done before the study is emailed to the client. Since we believe in giving our clients a good experience of our research studies, therefore, to make sure that we do not lack at our end in any way humanly possible we do a final round of quality check and then dispatch the study to the client.
By Component
Wearable Pumps
Accessories
By Technology
Manual Wearable Breast Pump
Battery Operated Wearable Breast Pump
Smart Wearable Breast Pump
Request for Segment Customization as per your Business Requirement: Segment Customization Request
REGIONAL COVERAGE:
North America
US
Canada
Mexico
Europe
Eastern Europe
Poland
Romania
Hungary
Turkey
Rest of Eastern Europe
Western Europe
Germany
France
UK
Italy
Spain
Netherlands
Switzerland
Austria
Rest of Western Europe
Asia Pacific
China
India
Japan
South Korea
Vietnam
Singapore
Australia
Rest of Asia Pacific
Middle East & Africa
Middle East
UAE
Egypt
Saudi Arabia
Qatar
Rest of the Middle East
Africa
Nigeria
South Africa
Rest of Africa
Latin America
Brazil
Argentina
Colombia
Rest of Latin America
Request for Country Level Research Report: Country Level Customization Request
Available Customization
With the given market data, SNS Insider offers customization as per the company’s specific needs. The following customization options are available for the report:
Detailed Volume Analysis
Criss-Cross segment analysis (e.g. Product X Application)
Competitive Product Benchmarking
Geographic Analysis
Additional countries in any of the regions
Customized Data Representation
Detailed analysis and profiling of additional market players
The Prostate Health Market Size was valued at USD 37.73 billion in 2023, and is expected to reach USD 82.62 billion by 2032 and grow at a CAGR of 9.1% over the forecast period 2024-2032.
The Cosmeceuticals Market Size was valued at USD 63.63 Billion in 2023, and is expected to reach USD 142.52 Billion by 2032, and grow at a CAGR of 9.84%.
The Molecular Diagnostics Market Size was USD 15.35 Billion in 2023, and expected to reach USD 32.37 Billion by 2032, and grow at a CAGR of 9.07%.
Downstream Processing Market was valued at USD 29.35 billion in 2023 and is expected to reach USD 99.64 billion by 2032, growing at a CAGR of 14.60%.
The Surgical Retractors Market Size was valued at USD 2.12 billion in 2023 and is expected to reach USD 3.81 billion by 2032 and grow at a CAGR of 6.74% by 2024-2032.
The Hospital EMR Systems Market size was USD 18.37 Billion in 2023 and is expected to reach USD 33.73 Billion by 2032 and grow at a CAGR of 6.99% over the forecast period of 2024-2032.
Hi! Click one of our member below to chat on Phone