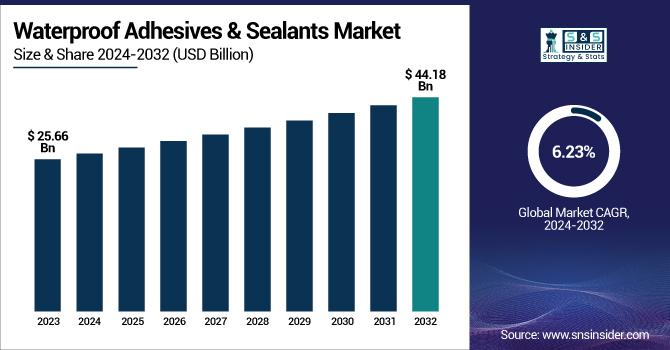
The Waterproof Adhesives & Sealants Market Size was valued at USD 25.66 Billion in 2023 and is expected to reach USD 44.18 Billion by 2032, growing at a CAGR of 6.23% over the forecast period of 2024-2032.
The Waterproof Adhesives & Sealants Market is evolving with rising demand from construction, automotive, and industrial applications. Investment trends reflect a surge in funding for advanced, eco-friendly formulations, reshaping competitive strategies. Meanwhile, raw material price fluctuations in silicones, polyurethanes, and acrylics impact production costs and pricing dynamics. The market also exhibits distinct preferences in consumer-grade versus industrial-grade products, where household users seek convenience while industries demand high durability. However, supply chain disruptions have intensified, causing raw material shortages and extended delivery timelines. Our report explores these pivotal factors, offering a comprehensive analysis of investment shifts, pricing volatility, product segmentation, and logistics challenges to help businesses adapt to the evolving market landscape.
The US Waterproof Adhesives & Sealants Market Size was valued at USD 4.53 Million in 2023 and is expected to reach USD 7.77 Million by 2032, growing at a CAGR of 6.19% over the forecast period of 2024-2032.
The U.S. Waterproof Adhesives & Sealants Market is experiencing steady growth, driven by rising construction activities, stringent environmental regulations, and advancements in material science. Organizations like the American Chemical Society (ACS) and the Adhesive and Sealant Council (ASC) highlight increasing demand for high-performance, eco-friendly adhesives in infrastructure and automotive sectors. The Department of Energy (DOE) promotes energy-efficient buildings, fueling the adoption of durable sealants for insulation. Additionally, U.S.-based companies like Henkel Corporation and 3M are developing innovative polyurethane and silicone-based waterproof solutions for industrial and consumer applications. Our report provides an in-depth analysis of these trends shaping the U.S. market.
Drivers
Rising Demand for Advanced Waterproofing in High-Rise and Smart Building Construction Drives the Waterproof Adhesives & Sealants Market Growth
The increasing construction of high-rise buildings and smart infrastructure globally is a key driver for the Waterproof Adhesives & Sealants Market. Urbanization has led to the need for innovative materials that ensure long-term durability, leak-proof structures, and energy efficiency. High-rise buildings, particularly in cities like New York, Chicago, and Los Angeles, require strong bonding solutions to withstand harsh weather conditions, wind pressure, and structural movements. Additionally, smart buildings integrate advanced materials for energy efficiency, with silicone and polyurethane sealants playing a crucial role in window glazing, roofing, and façade applications. Organizations such as the National Association of Home Builders (NAHB) emphasize the importance of moisture-resistant materials to prevent structural degradation, boosting the demand for waterproof adhesives and sealants. With the adoption of green building certifications such as LEED (Leadership in Energy and Environmental Design), manufacturers are focusing on developing low-VOC, solvent-free adhesives. This trend is pushing market players like 3M, Dow, and Henkel to innovate products that align with sustainability standards, fueling the industry's expansion.
Restraints
Fluctuating Raw Material Costs and Supply Chain Disruptions Hamper the Waterproof Adhesives & Sealants Market Growth
The Waterproof Adhesives & Sealants Market faces a significant restraint due to fluctuating raw material costs and frequent supply chain disruptions. Key ingredients such as polyurethanes, silicones, and acrylics are derived from petrochemical sources, making them vulnerable to crude oil price volatility. The Russia-Ukraine conflict, trade restrictions, and natural disasters have caused severe disruptions in the global supply chain, leading to increased production costs and inconsistent material availability. Additionally, rising energy prices and labor shortages in manufacturing hubs such as China and the United States have further complicated logistics and distribution. The U.S. Bureau of Labor Statistics has reported a substantial increase in transportation and logistics costs, making procurement and delivery more expensive for manufacturers. To mitigate these issues, companies are exploring local sourcing and alternative materials, but sudden price hikes continue to challenge profit margins. These factors, combined with uncertainty in global trade policies, hinder the seamless growth of the Waterproof Adhesives & Sealants Market, creating instability in supply and demand dynamics.
Opportunities
Growing Investments in Bio-Based and Sustainable Waterproof Adhesives & Sealants Propel Market Growth
The increasing shift towards bio-based and sustainable adhesives is creating lucrative opportunities in the Waterproof Adhesives & Sealants Market. Companies are focusing on plant-derived polymers, water-based formulations, and biodegradable materials to meet environmental compliance standards and reduce carbon footprints. Regulatory initiatives like the U.S. Green Building Council’s LEED certification and the European Union’s Circular Economy Action Plan encourage the adoption of low-VOC and solvent-free adhesives. Leading manufacturers such as Ashland and Arkema have introduced bio-polyurethane and soy-based adhesives that offer comparable performance to traditional synthetic counterparts. Additionally, the demand for recyclable and compostable packaging solutions in food and beverage, pharmaceuticals, and e-commerce is driving innovation in sustainable adhesive technologies. The rising consumer awareness of eco-friendly home improvement products and energy-efficient building materials is further accelerating market growth. As industries transition towards green chemistry and sustainable production methods, the demand for bio-based waterproof adhesives & sealants is expected to surge, presenting significant opportunities for manufacturers.
Challenge
Intensifying Competition from Alternative Bonding Technologies Challenges the Market Expansion of Waterproof Adhesives & Sealants
The Waterproof Adhesives & Sealants Market faces increasing competition from alternative bonding technologies, such as mechanical fasteners, welding, and advanced adhesive tapes. High-performance bonding tapes, developed by companies like Avery Dennison and 3M, offer instant adhesion, solvent-free application, and enhanced durability, making them a preferred choice in industries like construction, packaging, and automotive assembly. Additionally, ultrasonic and laser welding techniques are gaining traction in aerospace and medical devices, reducing reliance on liquid adhesives. The growing demand for recyclable and reworkable fastening solutions in sustainable manufacturing is further shifting market preferences toward non-adhesive bonding technologies. While traditional adhesives still dominate many applications, the rising popularity of next-generation bonding methods poses a long-term challenge for adhesive manufacturers, necessitating continuous innovation to stay competitive in the evolving market landscape.
By Type
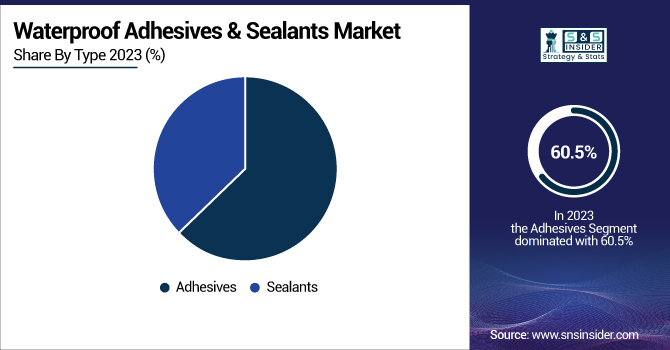
Adhesives dominated the Waterproof Adhesives & Sealants Market in 2023, capturing a 60.5% market share, with polyurethane adhesives emerging as the leading subsegment. Polyurethane adhesives are widely used in construction, automotive, and marine applications due to their high flexibility, moisture resistance, and strong adhesion to diverse substrates. According to the U.S. Green Building Council, the increasing adoption of LEED-certified buildings has driven demand for low-VOC polyurethane adhesives in waterproofing applications. Additionally, the National Association of Home Builders (NAHB) reported a 7% increase in residential construction projects in 2023, further fueling the demand. In the automotive sector, polyurethane adhesives are extensively utilized for bonding windshields, sealing panels, and improving vehicle durability, particularly in electric vehicle manufacturing. The U.S. Department of Energy has highlighted the growing need for lightweight, high-strength bonding solutions in EV assembly, contributing to the dominance of adhesives in the Waterproof Adhesives & Sealants Market.
By Base Material
Polyurethanes dominated and held a 30.9% market share in 2023, dominating the Waterproof Adhesives & Sealants Market due to their exceptional elasticity, chemical resistance, and superior bonding strength. The demand for polyurethane-based adhesives and sealants has surged, particularly in the construction and automotive industries, where durability and waterproofing are crucial. The U.S. Environmental Protection Agency (EPA) has promoted low-VOC polyurethane formulations, driving adoption in eco-friendly infrastructure projects. Additionally, the Federal Highway Administration (FHWA) has reported an increase in bridge and road maintenance projects, which require high-performance polyurethane sealants for waterproofing expansion joints and concrete structures. In marine applications, polyurethane sealants are preferred for boat manufacturing and deck sealing due to their resistance to saltwater, UV exposure, and extreme weather conditions. Leading manufacturers such as Dow and Henkel have invested in bio-based polyurethane adhesives, further strengthening the material’s dominance in the Waterproof Adhesives & Sealants Market.
By End-Use Industry
The Building & Construction segment dominated the Waterproof Adhesives & Sealants Market in 2023, accounting for a 40.3% market share. The rapid expansion of residential, commercial, and infrastructure projects, particularly in urban development and smart city initiatives, has fueled demand for high-performance waterproof adhesives and sealants. The National Association of Home Builders (NAHB) reported that construction spending in the U.S. exceeded $1.8 trillion in 2023, significantly boosting the market. Additionally, the American Society of Civil Engineers (ASCE) emphasized the need for waterproofing solutions in aging infrastructure rehabilitation, driving adoption in bridge repair and tunnel sealing. With government-backed initiatives such as the Bipartisan Infrastructure Law, increased investment in transportation and water management projects has further solidified the segment's dominance. Sustainable and energy-efficient buildings are also contributing to market expansion, with waterproof adhesives playing a key role in green roofing, façade sealing, and insulation panel bonding.
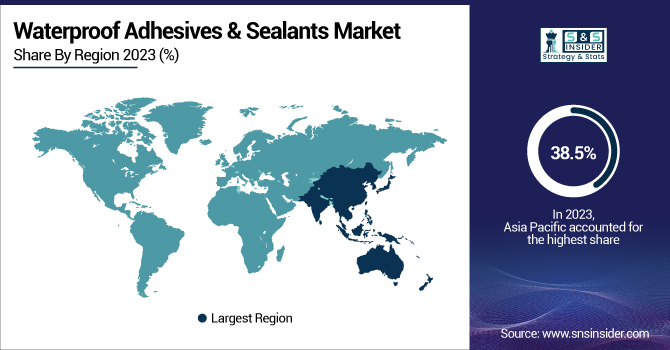
The Asia Pacific region dominated the Waterproof Adhesives & Sealants Market in 2023, holding a 38.5% market share, driven by rapid industrialization, infrastructure development, and growing automotive production. China emerged as the dominant country, fueled by massive investments in construction and smart city projects. According to the China Ministry of Housing and Urban-Rural Development, government initiatives such as the "New Urbanization Plan" have accelerated demand for waterproof adhesives in high-rise buildings and urban infrastructure. India also played a significant role, with the Indian Government's Smart Cities Mission increasing the use of waterproof sealants in urban construction. Additionally, Japan’s automotive industry witnessed rising adoption of polyurethane adhesives in electric vehicle (EV) manufacturing, as highlighted by the Japan Automobile Manufacturers Association (JAMA). Southeast Asian countries, including Vietnam and Indonesia, saw an uptick in demand due to growing marine and packaging industries, further boosting the region's dominance. The presence of key manufacturers such as Sika, BASF, and Henkel in the region has strengthened supply chains, enhancing market expansion.
Moreover, North America emerged as the fastest-growing region in the Waterproof Adhesives & Sealants Market, with a significant CAGR during the forecast period of 2024 to 2032. The United States dominates the region, driven by increasing investments in sustainable construction, automotive advancements, and infrastructure rehabilitation. According to the U.S. Department of Transportation, over $110 billion has been allocated for bridge repairs and highway expansions, boosting demand for waterproof adhesives and sealants in road maintenance. The rising adoption of EVs is also fueling market growth, with General Motors and Tesla increasing production of electric vehicles, where advanced bonding solutions are essential. Canada is the fastest-growing country, propelled by government policies promoting energy-efficient buildings under the Net-Zero Emissions by 2050 Plan. Mexico, with its expanding automotive and aerospace manufacturing sectors, has also witnessed increased demand for polyurethane-based adhesives for lightweight vehicle assembly. The presence of major players such as 3M, Dow, and H.B. Fuller in North America is further accelerating innovation and market growth.
3M Company (3M Marine Adhesive Sealant 5200, 3M Scotch-Weld Urethane Adhesive, 3M Fastbond Contact Adhesive)
Ashland (Pliogrip Structural Adhesives, Aroset Emulsion Adhesive, Isogrip Adhesive)
Avery Dennison Corporation (S7000 Adhesive, C4500 Waterproof Adhesive, Fasson Waterproof Label Adhesive)
BASF SE (MasterSeal NP1, MasterSeal 700, MasterEmaco ADH 327)
Bostik SA (Arkema Group) (Bostik 940 FS, Bostik MSP 107 Sealant, Simson ISR 70-03)
DAP Products Inc. (Dynaflex 230, Alex Plus Acrylic Latex Sealant, Kwik Seal Ultra)
Dow Chemical Company (DOWSIL 795 Silicone Sealant, DOWSIL 790, DOWSIL 991)
H.B. Fuller Company (Swift Lock Adhesive, GorillaPro Sealant, Advantra Adhesive)
Henkel AG & Co. KGaA (LOCTITE PL S40, TEROSON MS 939, Pritt Waterproof Adhesive)
Huntsman Corporation (Araldite 2021, Araldite 2050, Renshape Adhesives)
MAPEI SpA (Mapeflex PU45, Mapesil AC, Ultrabond Eco 995)
PPG Industries, Inc. (SIGMASHIELD 880, Pitt-Guard Epoxy Sealant, Envirobase Waterproof Adhesive)
Royal Adhesives & Sealants (H.B. Fuller Subsidiary) (Silaprene Adhesive, Supreme Seal 900, Fastbond Sealant)
RPM International Inc. (Tremco Dymonic 100, Rust-Oleum LeakSeal, Euclid Flexolith)
Sika AG (Sikaflex-221, Sikasil WS-305, SikaBond T-55)
Solvay (Omnix Waterproof Adhesive, Conapoxy Adhesive, Reactsol Sealant)
Uniseal, Inc. (Auto-Seal 400, Uniseal Bond, FlexSeal 700)
Wacker Chemie AG (GENIOSIL XB 502, ELASTOSIL N 2199, Silres BS 280)
Westlake Corporation (Westlake Epoxy Sealant, POLYBOND Adhesive, TUF-BOND)
Worcester Adhesives & Sealants (WorcoBond 250, AquaSeal Pro, Duraseal 500)
August 2024: H.B. Fuller acquired HS Butyl Limited, a UK-based butyl tapes manufacturer, strengthening its position in specialty construction tapes and engineering adhesive solutions. HS Butyl exports to over 50 countries, serving industries like construction, automotive, and renewable energy.
March 2025: Nobelus launched thermal polyethylene (PE) sealants for flexible packaging in digital printing. These multilayer sealants improve efficiency and adhesion in digital converters, enhancing flexible packaging applications.
Report Attributes | Details |
---|---|
Market Size in 2023 | USD 25.66 Billion |
Market Size by 2032 | USD 44.18 Billion |
CAGR | CAGR of 6.23% From 2024 to 2032 |
Base Year | 2023 |
Forecast Period | 2024-2032 |
Historical Data | 2020-2022 |
Report Scope & Coverage | Market Size, Segments Analysis, Competitive Landscape, Regional Analysis, DROC & SWOT Analysis, Forecast Outlook |
Key Segments | •By Type (Adhesives [UV curing adhesives, Anaerobic adhesives, Epoxy adhesives, Cross linking PVA glue, Polyurethane adhesives, Epoxy glue, Construction glue, Others], Sealants [Silicone, Polyurethane, Bituminous, Others]) •By Base Material (Silicones, Polyurethanes, Acrylics, Epoxy, Polysulfide, Others) •By End-Use Industry (Building & Construction, Transportation, Electrical & Electronics, Packaging , Medical, Consumer, Others) |
Regional Analysis/Coverage | North America (US, Canada, Mexico), Europe (Eastern Europe [Poland, Romania, Hungary, Turkey, Rest of Eastern Europe] Western Europe] Germany, France, UK, Italy, Spain, Netherlands, Switzerland, Austria, Rest of Western Europe]), Asia Pacific (China, India, Japan, South Korea, Vietnam, Singapore, Australia, Rest of Asia Pacific), Middle East & Africa (Middle East [UAE, Egypt, Saudi Arabia, Qatar, Rest of Middle East], Africa [Nigeria, South Africa, Rest of Africa], Latin America (Brazil, Argentina, Colombia, Rest of Latin America) |
Company Profiles | Henkel AG & Co. KGaA, H.B. Fuller Company, Sika AG, Bostik SA (Arkema Group), RPM International Inc., Wacker Chemie AG, MAPEI SpA, DAP Products Inc., Uniseal, Inc. and other key players |
Ans: The Waterproof Adhesives & Sealants Market was valued at USD 25.66 billion in 2023.
Ans: The Waterproof Adhesives & Sealants Market is expected to reach USD 44.18 billion by 2032, growing at a CAGR of 6.23%.
Ans: The Waterproof Adhesives & Sealants Market is led by companies like 3M, Henkel, Dow, and Sika.
Ans: The Waterproof Adhesives & Sealants Market is shifting towards bio-based and low-VOC adhesives due to environmental regulations.
Ans: The U.S. Waterproof Adhesives & Sealants Market is growing due to infrastructure projects and eco-friendly material adoption.
Table of Contents
1. Introduction
1.1 Market Definition
1.2 Scope (Inclusion and Exclusions)
1.3 Research Assumptions
2. Executive Summary
2.1 Market Overview
2.2 Regional Synopsis
2.3 Competitive Summary
3. Research Methodology
3.1 Top-Down Approach
3.2 Bottom-up Approach
3.3. Data Validation
3.4 Primary Interviews
4. Market Dynamics Impact Analysis
4.1 Market Driving Factors Analysis
4.1.1 Drivers
4.1.2 Restraints
4.1.3 Opportunities
4.1.4 Challenges
4.2 PESTLE Analysis
4.3 Porter’s Five Forces Model
5. Statistical Insights and Trends Reporting
5.1 Investment Trends in Waterproof Adhesives & Sealants Market
5.2 Raw Material Price Trends and Impact Analysis
5.3 Consumer-Type Versus Industrial-Type Product Analysis
5.4 Supply Chain Disruptions and Logistics Challenges
6. Competitive Landscape
6.1 List of Major Companies, By Region
6.2 Market Share Analysis, By Region
6.3 Product Benchmarking
6.3.1 Product specifications and features
6.3.2 Pricing
6.4 Strategic Initiatives
6.4.1 Marketing and promotional activities
6.4.2 Distribution and supply chain strategies
6.4.3 Expansion plans and new product launches
6.4.4 Strategic partnerships and collaborations
6.5 Technological Advancements
6.6 Market Positioning and Branding
7. Waterproof Adhesives & Sealants Market Segmentation, by Type
7.1 Chapter Overview
7.2 Adhesives
7.2.1 Adhesives Market Trends Analysis (2020-2032)
7.2.2 Adhesives Market Size Estimates and Forecasts to 2032 (USD Billion)
7.2.3 UV curing adhesives
7.2.3.1 UV curing adhesives Market Trends Analysis (2020-2032)
7.2.3.2 UV curing adhesives Market Size Estimates and Forecasts to 2032 (USD Billion)
7.2.4 Anaerobic adhesives
7.2.4.1 Anaerobic adhesives Market Trends Analysis (2020-2032)
7.2.4.2 Anaerobic adhesives Market Size Estimates and Forecasts to 2032 (USD Billion)
7.2.5 Epoxy adhesives
7.2.5.1 Epoxy adhesives Market Trends Analysis (2020-2032)
7.2.5.2 Epoxy adhesives Market Size Estimates and Forecasts to 2032 (USD Billion)
7.2.6 Cross linking PVA glue
7.2.6.1 Cross linking PVA glue Market Trends Analysis (2020-2032)
7.2.6.2 Cross linking PVA glue Market Size Estimates and Forecasts to 2032 (USD Billion)
7.2.7 Polyurethane adhesives
7.2.7.1 Polyurethane adhesives Market Trends Analysis (2020-2032)
7.2.7.2 Polyurethane adhesives Market Size Estimates and Forecasts to 2032 (USD Billion)
7.2.8 Epoxy glue
7.2.8.1 Epoxy glue Market Trends Analysis (2020-2032)
7.2.8.2 Epoxy glue Market Size Estimates and Forecasts to 2032 (USD Billion)
7.2.9 Construction glue
7.2.9.1 Construction glue Market Trends Analysis (2020-2032)
7.2.9.2 Construction glue Market Size Estimates and Forecasts to 2032 (USD Billion)
7.2.10 Others
7.2.10.1 Others Market Trends Analysis (2020-2032)
7.2.10.2 Others Market Size Estimates and Forecasts to 2032 (USD Billion)
7.3 Sealants
7.3.1 Sealants Market Trends Analysis (2020-2032)
7.3.2 Sealants Market Size Estimates and Forecasts to 2032 (USD Billion)
7.2.3 Silicone
7.2.3.1 Silicone Market Trends Analysis (2020-2032)
7.2.3.2 Silicone Market Size Estimates and Forecasts to 2032 (USD Billion)
7.2.4 Polyurethane
7.2.4.1 Polyurethane Market Trends Analysis (2020-2032)
7.2.4.2 Polyurethane Market Size Estimates and Forecasts to 2032 (USD Billion)
7.2.5 Bituminous
7.2.5.1 Bituminous Market Trends Analysis (2020-2032)
7.2.5.2 Bituminous Market Size Estimates and Forecasts to 2032 (USD Billion)
7.2.6 Others
7.2.6.1 Others glue Market Trends Analysis (2020-2032)
7.2.6.2 Others glue Market Size Estimates and Forecasts to 2032 (USD Billion)
8. Waterproof Adhesives & Sealants Market Segmentation, by Base Material
8.1 Chapter Overview
8.2 Silicones
8.2.1 Silicones Market Trends Analysis (2020-2032)
8.2.2 Silicones Market Size Estimates and Forecasts to 2032 (USD Billion)
8.3 Polyurethanes
8.3.1 Polyurethanes Market Trends Analysis (2020-2032)
8.3.2 Polyurethanes Market Size Estimates and Forecasts to 2032 (USD Billion)
8.4 Acrylics
8.4.1 Acrylics Market Trends Analysis (2020-2032)
8.4.2 Acrylics Market Size Estimates and Forecasts to 2032 (USD Billion)
8.5 Epoxy
8.5.1 Epoxy Market Trends Analysis (2020-2032)
8.5.2 Epoxy Market Size Estimates and Forecasts to 2032 (USD Billion)
8.6 Polysulfide
8.6.1 Polysulfide Market Trends Analysis (2020-2032)
8.6.2 Polysulfide Market Size Estimates and Forecasts to 2032 (USD Billion)
8.6 Others
8.6.1 Others Market Trends Analysis (2020-2032)
8.6.2 Others Market Size Estimates and Forecasts to 2032 (USD Billion)
9. Waterproof Adhesives & Sealants Market Segmentation, by End-Use Industry
9.1 Chapter Overview
9.2 Building & Construction
9.2.1 Building & Construction Market Trends Analysis (2020-2032)
9.2.2 Building & Construction Market Size Estimates and Forecasts to 2032 (USD Billion)
9.3 Transportation
9.3.1 Transportation Market Trends Analysis (2020-2032)
9.3.2 Transportation Market Size Estimates and Forecasts to 2032 (USD Billion)
9.4 Electrical & Electronics
9.4.1 Electrical & Electronics Market Trends Analysis (2020-2032)
9.4.2 Electrical & Electronics Market Size Estimates and Forecasts to 2032 (USD Billion)
9.5 Packaging
9.5.1 Packaging Market Trends Analysis (2020-2032)
9.5.2 Packaging Market Size Estimates and Forecasts to 2032 (USD Billion)
9.6 Medical
9.6.1 Medical Market Trends Analysis (2020-2032)
9.6.2 Medical Market Size Estimates and Forecasts to 2032 (USD Billion)
9.7 Consumer
9.7.1 Consumer Market Trends Analysis (2020-2032)
9.7.2 Consumer Market Size Estimates and Forecasts to 2032 (USD Billion)
9.8 Others
9.8.1 Others Market Trends Analysis (2020-2032)
9.8.2 Others Market Size Estimates and Forecasts to 2032 (USD Billion)
10. Regional Analysis
10.1 Chapter Overview
10.2 North America
10.2.1 Trends Analysis
10.2.2 North America Waterproof Adhesives & Sealants Market Estimates and Forecasts, by Country (2020-2032) (USD Billion)
10.2.3 North America Waterproof Adhesives & Sealants Market Estimates and Forecasts, by Type (2020-2032) (USD Billion)
10.2.4 North America Waterproof Adhesives & Sealants Market Estimates and Forecasts, by Base Material (2020-2032) (USD Billion)
10.2.5 North America Waterproof Adhesives & Sealants Market Estimates and Forecasts, by End-Use Industry (2020-2032) (USD Billion)
10.2.6 USA
10.2.6.1 USA Waterproof Adhesives & Sealants Market Estimates and Forecasts, by Type (2020-2032) (USD Billion)
10.2.6.2 USA Waterproof Adhesives & Sealants Market Estimates and Forecasts, by Base Material (2020-2032) (USD Billion)
10.2.6.3 USA Waterproof Adhesives & Sealants Market Estimates and Forecasts, by End-Use Industry (2020-2032) (USD Billion)
10.2.7 Canada
10.2.7.1 Canada Waterproof Adhesives & Sealants Market Estimates and Forecasts, by Type (2020-2032) (USD Billion)
10.2.7.2 Canada Waterproof Adhesives & Sealants Market Estimates and Forecasts, by Base Material (2020-2032) (USD Billion)
10.2.7.3 Canada Waterproof Adhesives & Sealants Market Estimates and Forecasts, by End-Use Industry (2020-2032) (USD Billion)
10.2.8 Mexico
10.2.8.1 Mexico Waterproof Adhesives & Sealants Market Estimates and Forecasts, by Type (2020-2032) (USD Billion)
10.2.8.2 Mexico Waterproof Adhesives & Sealants Market Estimates and Forecasts, by Base Material (2020-2032) (USD Billion)
10.2.8.3 Mexico Waterproof Adhesives & Sealants Market Estimates and Forecasts, by End-Use Industry (2020-2032) (USD Billion)
10.3 Europe
10.3.1 Eastern Europe
10.3.1.1 Trends Analysis
10.3.1.2 Eastern Europe Waterproof Adhesives & Sealants Market Estimates and Forecasts, by Country (2020-2032) (USD Billion)
10.3.1.3 Eastern Europe Waterproof Adhesives & Sealants Market Estimates and Forecasts, by Type (2020-2032) (USD Billion)
10.3.1.4 Eastern Europe Waterproof Adhesives & Sealants Market Estimates and Forecasts, by Base Material (2020-2032) (USD Billion)
10.3.1.5 Eastern Europe Waterproof Adhesives & Sealants Market Estimates and Forecasts, by End-Use Industry (2020-2032) (USD Billion)
10.3.1.6 Poland
10.3.1.6.1 Poland Waterproof Adhesives & Sealants Market Estimates and Forecasts, by Type (2020-2032) (USD Billion)
10.3.1.6.2 Poland Waterproof Adhesives & Sealants Market Estimates and Forecasts, by Base Material (2020-2032) (USD Billion)
10.3.1.6.3 Poland Waterproof Adhesives & Sealants Market Estimates and Forecasts, by End-Use Industry (2020-2032) (USD Billion)
10.3.1.7 Romania
10.3.1.7.1 Romania Waterproof Adhesives & Sealants Market Estimates and Forecasts, by Type (2020-2032) (USD Billion)
10.3.1.7.2 Romania Waterproof Adhesives & Sealants Market Estimates and Forecasts, by Base Material (2020-2032) (USD Billion)
10.3.1.7.3 Romania Waterproof Adhesives & Sealants Market Estimates and Forecasts, by End-Use Industry (2020-2032) (USD Billion)
10.3.1.8 Hungary
10.3.1.8.1 Hungary Waterproof Adhesives & Sealants Market Estimates and Forecasts, by Type (2020-2032) (USD Billion)
10.3.1.8.2 Hungary Waterproof Adhesives & Sealants Market Estimates and Forecasts, by Base Material (2020-2032) (USD Billion)
10.3.1.8.3 Hungary Waterproof Adhesives & Sealants Market Estimates and Forecasts, by End-Use Industry (2020-2032) (USD Billion)
10.3.1.9 Turkey
10.3.1.9.1 Turkey Waterproof Adhesives & Sealants Market Estimates and Forecasts, by Type (2020-2032) (USD Billion)
10.3.1.9.2 Turkey Waterproof Adhesives & Sealants Market Estimates and Forecasts, by Base Material (2020-2032) (USD Billion)
10.3.1.9.3 Turkey Waterproof Adhesives & Sealants Market Estimates and Forecasts, by End-Use Industry (2020-2032) (USD Billion)
10.3.1.10 Rest of Eastern Europe
10.3.1.10.1 Rest of Eastern Europe Waterproof Adhesives & Sealants Market Estimates and Forecasts, by Type (2020-2032) (USD Billion)
10.3.1.10.2 Rest of Eastern Europe Waterproof Adhesives & Sealants Market Estimates and Forecasts, by Base Material (2020-2032) (USD Billion)
10.3.1.10.3 Rest of Eastern Europe Waterproof Adhesives & Sealants Market Estimates and Forecasts, by End-Use Industry (2020-2032) (USD Billion)
10.3.2 Western Europe
10.3.2.1 Trends Analysis
10.3.2.2 Western Europe Waterproof Adhesives & Sealants Market Estimates and Forecasts, by Country (2020-2032) (USD Billion)
10.3.2.3 Western Europe Waterproof Adhesives & Sealants Market Estimates and Forecasts, by Type (2020-2032) (USD Billion)
10.3.2.4 Western Europe Waterproof Adhesives & Sealants Market Estimates and Forecasts, by Base Material (2020-2032) (USD Billion)
10.3.2.5 Western Europe Waterproof Adhesives & Sealants Market Estimates and Forecasts, by End-Use Industry (2020-2032) (USD Billion)
10.3.2.6 Germany
10.3.2.6.1 Germany Waterproof Adhesives & Sealants Market Estimates and Forecasts, by Type (2020-2032) (USD Billion)
10.3.2.6.2 Germany Waterproof Adhesives & Sealants Market Estimates and Forecasts, by Base Material (2020-2032) (USD Billion)
10.3.2.6.3 Germany Waterproof Adhesives & Sealants Market Estimates and Forecasts, by End-Use Industry (2020-2032) (USD Billion)
10.3.2.7 France
10.3.2.7.1 France Waterproof Adhesives & Sealants Market Estimates and Forecasts, by Type (2020-2032) (USD Billion)
10.3.2.7.2 France Waterproof Adhesives & Sealants Market Estimates and Forecasts, by Base Material (2020-2032) (USD Billion)
10.3.2.7.3 France Waterproof Adhesives & Sealants Market Estimates and Forecasts, by End-Use Industry (2020-2032) (USD Billion)
10.3.2.8 UK
10.3.2.8.1 UK Waterproof Adhesives & Sealants Market Estimates and Forecasts, by Type (2020-2032) (USD Billion)
10.3.2.8.2 UK Waterproof Adhesives & Sealants Market Estimates and Forecasts, by Base Material (2020-2032) (USD Billion)
10.3.2.8.3 UK Waterproof Adhesives & Sealants Market Estimates and Forecasts, by End-Use Industry (2020-2032) (USD Billion)
10.3.2.9 Italy
10.3.2.9.1 Italy Waterproof Adhesives & Sealants Market Estimates and Forecasts, by Type (2020-2032) (USD Billion)
10.3.2.9.2 Italy Waterproof Adhesives & Sealants Market Estimates and Forecasts, by Base Material (2020-2032) (USD Billion)
10.3.2.9.3 Italy Waterproof Adhesives & Sealants Market Estimates and Forecasts, by End-Use Industry (2020-2032) (USD Billion)
10.3.2.10 Spain
10.3.2.10.1 Spain Waterproof Adhesives & Sealants Market Estimates and Forecasts, by Type (2020-2032) (USD Billion)
10.3.2.10.2 Spain Waterproof Adhesives & Sealants Market Estimates and Forecasts, by Base Material (2020-2032) (USD Billion)
10.3.2.10.3 Spain Waterproof Adhesives & Sealants Market Estimates and Forecasts, by End-Use Industry (2020-2032) (USD Billion)
10.3.2.11 Netherlands
10.3.2.11.1 Netherlands Waterproof Adhesives & Sealants Market Estimates and Forecasts, by Type (2020-2032) (USD Billion)
10.3.2.11.2 Netherlands Waterproof Adhesives & Sealants Market Estimates and Forecasts, by Base Material (2020-2032) (USD Billion)
10.3.2.11.3 Netherlands Waterproof Adhesives & Sealants Market Estimates and Forecasts, by End-Use Industry (2020-2032) (USD Billion)
10.3.2.12 Switzerland
10.3.2.12.1 Switzerland Waterproof Adhesives & Sealants Market Estimates and Forecasts, by Type (2020-2032) (USD Billion)
10.3.2.12.2 Switzerland Waterproof Adhesives & Sealants Market Estimates and Forecasts, by Base Material (2020-2032) (USD Billion)
10.3.2.12.3 Switzerland Waterproof Adhesives & Sealants Market Estimates and Forecasts, by End-Use Industry (2020-2032) (USD Billion)
10.3.2.13 Austria
10.3.2.13.1 Austria Waterproof Adhesives & Sealants Market Estimates and Forecasts, by Type (2020-2032) (USD Billion)
10.3.2.13.2 Austria Waterproof Adhesives & Sealants Market Estimates and Forecasts, by Base Material (2020-2032) (USD Billion)
10.3.2.13.3 Austria Waterproof Adhesives & Sealants Market Estimates and Forecasts, by End-Use Industry (2020-2032) (USD Billion)
10.3.2.14 Rest of Western Europe
10.3.2.14.1 Rest of Western Europe Waterproof Adhesives & Sealants Market Estimates and Forecasts, by Type (2020-2032) (USD Billion)
10.3.2.14.2 Rest of Western Europe Waterproof Adhesives & Sealants Market Estimates and Forecasts, by Base Material (2020-2032) (USD Billion)
10.3.2.14.3 Rest of Western Europe Waterproof Adhesives & Sealants Market Estimates and Forecasts, by End-Use Industry (2020-2032) (USD Billion)
10.4 Asia Pacific
10.4.1 Trends Analysis
10.4.2 Asia Pacific Waterproof Adhesives & Sealants Market Estimates and Forecasts, by Country (2020-2032) (USD Billion)
10.4.3 Asia Pacific Waterproof Adhesives & Sealants Market Estimates and Forecasts, by Type (2020-2032) (USD Billion)
10.4.4 Asia Pacific Waterproof Adhesives & Sealants Market Estimates and Forecasts, by Base Material (2020-2032) (USD Billion)
10.4.5 Asia Pacific Waterproof Adhesives & Sealants Market Estimates and Forecasts, by End-Use Industry (2020-2032) (USD Billion)
10.4.6 China
10.4.6.1 China Waterproof Adhesives & Sealants Market Estimates and Forecasts, by Type (2020-2032) (USD Billion)
10.4.6.2 China Waterproof Adhesives & Sealants Market Estimates and Forecasts, by Base Material (2020-2032) (USD Billion)
10.4.6.3 China Waterproof Adhesives & Sealants Market Estimates and Forecasts, by End-Use Industry (2020-2032) (USD Billion)
10.4.7 India
10.4.7.1 India Waterproof Adhesives & Sealants Market Estimates and Forecasts, by Type (2020-2032) (USD Billion)
10.4.7.2 India Waterproof Adhesives & Sealants Market Estimates and Forecasts, by Base Material (2020-2032) (USD Billion)
10.4.7.3 India Waterproof Adhesives & Sealants Market Estimates and Forecasts, by End-Use Industry (2020-2032) (USD Billion)
10.4.8 Japan
10.4.8.1 Japan Waterproof Adhesives & Sealants Market Estimates and Forecasts, by Type (2020-2032) (USD Billion)
10.4.8.2 Japan Waterproof Adhesives & Sealants Market Estimates and Forecasts, by Base Material (2020-2032) (USD Billion)
10.4.8.3 Japan Waterproof Adhesives & Sealants Market Estimates and Forecasts, by End-Use Industry (2020-2032) (USD Billion)
10.4.9 South Korea
10.4.9.1 South Korea Waterproof Adhesives & Sealants Market Estimates and Forecasts, by Type (2020-2032) (USD Billion)
10.4.9.2 South Korea Waterproof Adhesives & Sealants Market Estimates and Forecasts, by Base Material (2020-2032) (USD Billion)
10.4.9.3 South Korea Waterproof Adhesives & Sealants Market Estimates and Forecasts, by End-Use Industry (2020-2032) (USD Billion)
10.4.10 Vietnam
10.4.10.1 Vietnam Waterproof Adhesives & Sealants Market Estimates and Forecasts, by Type (2020-2032) (USD Billion)
10.4.10.2 Vietnam Waterproof Adhesives & Sealants Market Estimates and Forecasts, by Base Material (2020-2032) (USD Billion)
10.4.10.3 Vietnam Waterproof Adhesives & Sealants Market Estimates and Forecasts, by End-Use Industry (2020-2032) (USD Billion)
10.4.11 Singapore
10.4.11.1 Singapore Waterproof Adhesives & Sealants Market Estimates and Forecasts, by Type (2020-2032) (USD Billion)
10.4.11.2 Singapore Waterproof Adhesives & Sealants Market Estimates and Forecasts, by Base Material (2020-2032) (USD Billion)
10.4.11.3 Singapore Waterproof Adhesives & Sealants Market Estimates and Forecasts, by End-Use Industry (2020-2032) (USD Billion)
10.4.12 Australia
10.4.12.1 Australia Waterproof Adhesives & Sealants Market Estimates and Forecasts, by Type (2020-2032) (USD Billion)
10.4.12.2 Australia Waterproof Adhesives & Sealants Market Estimates and Forecasts, by Base Material (2020-2032) (USD Billion)
10.4.12.3 Australia Waterproof Adhesives & Sealants Market Estimates and Forecasts, by End-Use Industry (2020-2032) (USD Billion)
10.4.13 Rest of Asia Pacific
10.4.13.1 Rest of Asia Pacific Waterproof Adhesives & Sealants Market Estimates and Forecasts, by Type (2020-2032) (USD Billion)
10.4.13.2 Rest of Asia Pacific Waterproof Adhesives & Sealants Market Estimates and Forecasts, by Base Material (2020-2032) (USD Billion)
10.4.13.3 Rest of Asia Pacific Waterproof Adhesives & Sealants Market Estimates and Forecasts, by End-Use Industry (2020-2032) (USD Billion)
10.5 Middle East and Africa
10.5.1 Middle East
10.5.1.1 Trends Analysis
10.5.1.2 Middle East Waterproof Adhesives & Sealants Market Estimates and Forecasts, by Country (2020-2032) (USD Billion)
10.5.1.3 Middle East Waterproof Adhesives & Sealants Market Estimates and Forecasts, by Type (2020-2032) (USD Billion)
10.5.1.4 Middle East Waterproof Adhesives & Sealants Market Estimates and Forecasts, by Base Material (2020-2032) (USD Billion)
10.5.1.5 Middle East Waterproof Adhesives & Sealants Market Estimates and Forecasts, by End-Use Industry (2020-2032) (USD Billion)
10.5.1.6 UAE
10.5.1.6.1 UAE Waterproof Adhesives & Sealants Market Estimates and Forecasts, by Type (2020-2032) (USD Billion)
10.5.1.6.2 UAE Waterproof Adhesives & Sealants Market Estimates and Forecasts, by Base Material (2020-2032) (USD Billion)
10.5.1.6.3 UAE Waterproof Adhesives & Sealants Market Estimates and Forecasts, by End-Use Industry (2020-2032) (USD Billion)
10.5.1.7 Egypt
10.5.1.7.1 Egypt Waterproof Adhesives & Sealants Market Estimates and Forecasts, by Type (2020-2032) (USD Billion)
10.5.1.7.2 Egypt Waterproof Adhesives & Sealants Market Estimates and Forecasts, by Base Material (2020-2032) (USD Billion)
10.5.1.7.3 Egypt Waterproof Adhesives & Sealants Market Estimates and Forecasts, by End-Use Industry (2020-2032) (USD Billion)
10.5.1.8 Saudi Arabia
10.5.1.8.1 Saudi Arabia Waterproof Adhesives & Sealants Market Estimates and Forecasts, by Type (2020-2032) (USD Billion)
10.5.1.8.2 Saudi Arabia Waterproof Adhesives & Sealants Market Estimates and Forecasts, by Base Material (2020-2032) (USD Billion)
10.5.1.8.3 Saudi Arabia Waterproof Adhesives & Sealants Market Estimates and Forecasts, by End-Use Industry (2020-2032) (USD Billion)
10.5.1.9 Qatar
10.5.1.9.1 Qatar Waterproof Adhesives & Sealants Market Estimates and Forecasts, by Type (2020-2032) (USD Billion)
10.5.1.9.2 Qatar Waterproof Adhesives & Sealants Market Estimates and Forecasts, by Base Material (2020-2032) (USD Billion)
10.5.1.9.3 Qatar Waterproof Adhesives & Sealants Market Estimates and Forecasts, by End-Use Industry (2020-2032) (USD Billion)
10.5.1.10 Rest of Middle East
10.5.1.10.1 Rest of Middle East Waterproof Adhesives & Sealants Market Estimates and Forecasts, by Type (2020-2032) (USD Billion)
10.5.1.10.2 Rest of Middle East Waterproof Adhesives & Sealants Market Estimates and Forecasts, by Base Material (2020-2032) (USD Billion)
10.5.1.10.3 Rest of Middle East Waterproof Adhesives & Sealants Market Estimates and Forecasts, by End-Use Industry (2020-2032) (USD Billion)
10.5.2 Africa
10.5.2.1 Trends Analysis
10.5.2.2 Africa Waterproof Adhesives & Sealants Market Estimates and Forecasts, by Country (2020-2032) (USD Billion)
10.5.2.3 Africa Waterproof Adhesives & Sealants Market Estimates and Forecasts, by Type (2020-2032) (USD Billion)
10.5.2.4 Africa Waterproof Adhesives & Sealants Market Estimates and Forecasts, by Base Material (2020-2032) (USD Billion)
10.5.2.5 Africa Waterproof Adhesives & Sealants Market Estimates and Forecasts, by End-Use Industry (2020-2032) (USD Billion)
10.5.2.6 South Africa
10.5.2.6.1 South Africa Waterproof Adhesives & Sealants Market Estimates and Forecasts, by Type (2020-2032) (USD Billion)
10.5.2.6.2 South Africa Waterproof Adhesives & Sealants Market Estimates and Forecasts, by Base Material (2020-2032) (USD Billion)
10.5.2.6.3 South Africa Waterproof Adhesives & Sealants Market Estimates and Forecasts, by End-Use Industry (2020-2032) (USD Billion)
10.5.2.7 Nigeria
10.5.2.7.1 Nigeria Waterproof Adhesives & Sealants Market Estimates and Forecasts, by Type (2020-2032) (USD Billion)
10.5.2.7.2 Nigeria Waterproof Adhesives & Sealants Market Estimates and Forecasts, by Base Material (2020-2032) (USD Billion)
10.5.2.7.3 Nigeria Waterproof Adhesives & Sealants Market Estimates and Forecasts, by End-Use Industry (2020-2032) (USD Billion)
10.5.2.8 Rest of Africa
10.5.2.8.1 Rest of Africa Waterproof Adhesives & Sealants Market Estimates and Forecasts, by Type (2020-2032) (USD Billion)
10.5.2.8.2 Rest of Africa Waterproof Adhesives & Sealants Market Estimates and Forecasts, by Base Material (2020-2032) (USD Billion)
10.5.2.8.3 Rest of Africa Waterproof Adhesives & Sealants Market Estimates and Forecasts, by End-Use Industry (2020-2032) (USD Billion)
10.6 Latin America
10.6.1 Trends Analysis
10.6.2 Latin America Waterproof Adhesives & Sealants Market Estimates and Forecasts, by Country (2020-2032) (USD Billion)
10.6.3 Latin America Waterproof Adhesives & Sealants Market Estimates and Forecasts, by Type (2020-2032) (USD Billion)
10.6.4 Latin America Waterproof Adhesives & Sealants Market Estimates and Forecasts, by Base Material (2020-2032) (USD Billion)
10.6.5 Latin America Waterproof Adhesives & Sealants Market Estimates and Forecasts, by End-Use Industry (2020-2032) (USD Billion)
10.6.6 Brazil
10.6.6.1 Brazil Waterproof Adhesives & Sealants Market Estimates and Forecasts, by Type (2020-2032) (USD Billion)
10.6.6.2 Brazil Waterproof Adhesives & Sealants Market Estimates and Forecasts, by Base Material (2020-2032) (USD Billion)
10.6.6.3 Brazil Waterproof Adhesives & Sealants Market Estimates and Forecasts, by End-Use Industry (2020-2032) (USD Billion)
10.6.7 Argentina
10.6.7.1 Argentina Waterproof Adhesives & Sealants Market Estimates and Forecasts, by Type (2020-2032) (USD Billion)
10.6.7.2 Argentina Waterproof Adhesives & Sealants Market Estimates and Forecasts, by Base Material (2020-2032) (USD Billion)
10.6.7.3 Argentina Waterproof Adhesives & Sealants Market Estimates and Forecasts, by End-Use Industry (2020-2032) (USD Billion)
10.6.8 Colombia
10.6.8.1 Colombia Waterproof Adhesives & Sealants Market Estimates and Forecasts, by Type (2020-2032) (USD Billion)
10.6.8.2 Colombia Waterproof Adhesives & Sealants Market Estimates and Forecasts, by Base Material (2020-2032) (USD Billion)
10.6.8.3 Colombia Waterproof Adhesives & Sealants Market Estimates and Forecasts, by End-Use Industry (2020-2032) (USD Billion)
10.6.9 Rest of Latin America
10.6.9.1 Rest of Latin America Waterproof Adhesives & Sealants Market Estimates and Forecasts, by Type (2020-2032) (USD Billion)
10.6.9.2 Rest of Latin America Waterproof Adhesives & Sealants Market Estimates and Forecasts, by Base Material (2020-2032) (USD Billion)
10.6.9.3 Rest of Latin America Waterproof Adhesives & Sealants Market Estimates and Forecasts, by End-Use Industry (2020-2032) (USD Billion)
11. Company Profiles
11.1 Henkel AG & Co. KGaA
11.1.1 Company Overview
11.1.2 Financial
11.1.3 Products/ Services Offered
11.1.4 SWOT Analysis
11.2 H.B. Fuller Company
11.2.1 Company Overview
11.2.2 Financial
11.2.3 Products/ Services Offered
11.2.4 SWOT Analysis
11.3 Sika AG
11.3.1 Company Overview
11.3.2 Financial
11.3.3 Products/ Services Offered
11.3.4 SWOT Analysis
11.4 Bostik SA (Arkema Group)
11.4.1 Company Overview
11.4.2 Financial
11.4.3 Products/ Services Offered
11.4.4 SWOT Analysis
11.5 RPM International Inc.
11.5.1 Company Overview
11.5.2 Financial
11.5.3 Products/ Services Offered
11.5.4 SWOT Analysis
11.6 Wacker Chemie AG
11.6.1 Company Overview
11.6.2 Financial
11.6.3 Products/ Services Offered
11.6.4 SWOT Analysis
11.7 MAPEI SpA
11.7.1 Company Overview
11.7.2 Financial
11.7.3 Products/ Services Offered
11.7.4 SWOT Analysis
11.8 DAP Products Inc.
11.8.1 Company Overview
11.8.2 Financial
11.8.3 Products/ Services Offered
11.8.4 SWOT Analysis
11.9 Uniseal, Inc.
11.9.1 Company Overview
11.9.2 Financial
11.9.3 Products/ Services Offered
11.9.4 SWOT Analysis
12. Use Cases and Best Practices
13. Conclusion
An accurate research report requires proper strategizing as well as implementation. There are multiple factors involved in the completion of good and accurate research report and selecting the best methodology to compete the research is the toughest part. Since the research reports we provide play a crucial role in any company’s decision-making process, therefore we at SNS Insider always believe that we should choose the best method which gives us results closer to reality. This allows us to reach at a stage wherein we can provide our clients best and accurate investment to output ratio.
Each report that we prepare takes a timeframe of 350-400 business hours for production. Starting from the selection of titles through a couple of in-depth brain storming session to the final QC process before uploading our titles on our website we dedicate around 350 working hours. The titles are selected based on their current market cap and the foreseen CAGR and growth.
The 5 steps process:
Step 1: Secondary Research:
Secondary Research or Desk Research is as the name suggests is a research process wherein, we collect data through the readily available information. In this process we use various paid and unpaid databases which our team has access to and gather data through the same. This includes examining of listed companies’ annual reports, Journals, SEC filling etc. Apart from this our team has access to various associations across the globe across different industries. Lastly, we have exchange relationships with various university as well as individual libraries.
Step 2: Primary Research
When we talk about primary research, it is a type of study in which the researchers collect relevant data samples directly, rather than relying on previously collected data. This type of research is focused on gaining content specific facts that can be sued to solve specific problems. Since the collected data is fresh and first hand therefore it makes the study more accurate and genuine.
We at SNS Insider have divided Primary Research into 2 parts.
Part 1 wherein we interview the KOLs of major players as well as the upcoming ones across various geographic regions. This allows us to have their view over the market scenario and acts as an important tool to come closer to the accurate market numbers. As many as 45 paid and unpaid primary interviews are taken from both the demand and supply side of the industry to make sure we land at an accurate judgement and analysis of the market.
This step involves the triangulation of data wherein our team analyses the interview transcripts, online survey responses and observation of on filed participants. The below mentioned chart should give a better understanding of the part 1 of the primary interview.
Part 2: In this part of primary research the data collected via secondary research and the part 1 of the primary research is validated with the interviews from individual consultants and subject matter experts.
Consultants are those set of people who have at least 12 years of experience and expertise within the industry whereas Subject Matter Experts are those with at least 15 years of experience behind their back within the same space. The data with the help of two main processes i.e., FGDs (Focused Group Discussions) and IDs (Individual Discussions). This gives us a 3rd party nonbiased primary view of the market scenario making it a more dependable one while collation of the data pointers.
Step 3: Data Bank Validation
Once all the information is collected via primary and secondary sources, we run that information for data validation. At our intelligence centre our research heads track a lot of information related to the market which includes the quarterly reports, the daily stock prices, and other relevant information. Our data bank server gets updated every fortnight and that is how the information which we collected using our primary and secondary information is revalidated in real time.
Step 4: QA/QC Process
After all the data collection and validation our team does a final level of quality check and quality assurance to get rid of any unwanted or undesired mistakes. This might include but not limited to getting rid of the any typos, duplication of numbers or missing of any important information. The people involved in this process include technical content writers, research heads and graphics people. Once this process is completed the title gets uploader on our platform for our clients to read it.
Step 5: Final QC/QA Process:
This is the last process and comes when the client has ordered the study. In this process a final QA/QC is done before the study is emailed to the client. Since we believe in giving our clients a good experience of our research studies, therefore, to make sure that we do not lack at our end in any way humanly possible we do a final round of quality check and then dispatch the study to the client.
Key Segments:
By Type
Adhesives
UV curing adhesives
Anaerobic adhesives
Epoxy adhesives
Cross linking PVA glue
Polyurethane adhesives
Epoxy glue
Construction glue
Others
Sealants
Silicone
Polyurethane
Bituminous
Others
By Base Material
Silicones
Polyurethanes
Acrylics
Epoxy
Polysulfide
Others
By End-Use Industry
Building & Construction
Transportation
Electrical & Electronics
Packaging
Medical
Consumer
Others
Request for Segment Customization as per your Business Requirement: Segment Customization Request
Regional Coverage:
North America
US
Canada
Mexico
Europe
Eastern Europe
Poland
Romania
Hungary
Turkey
Rest of Eastern Europe
Western Europe
Germany
France
UK
Italy
Spain
Netherlands
Switzerland
Austria
Rest of Western Europe
Asia Pacific
China
India
Japan
South Korea
Vietnam
Singapore
Australia
Rest of Asia Pacific
Middle East & Africa
Middle East
UAE
Egypt
Saudi Arabia
Qatar
Rest of Middle East
Africa
Nigeria
South Africa
Rest of Africa
Latin America
Brazil
Argentina
Colombia
Rest of Latin America
Request for Country Level Research Report: Country Level Customization Request
Available Customization
With the given market data, SNS Insider offers customization as per the company’s specific needs. The following customization options are available for the report:
Detailed Volume Analysis
Criss-Cross segment analysis (e.g. Product X Application)
Competitive Product Benchmarking
Geographic Analysis
Additional countries in any of the regions
Customized Data Representation
Detailed analysis and profiling of additional market players
The Natural Dyes Market Size was valued at USD 4.57 Billion in 2023 and is expected to reach USD 7.54 Billion by 2032, growing at a CAGR of 5.73% over the forecast period of 2024-2032.
The Fermentation Chemicals Market Size was valued at USD 74.50 billion in 2023 and is expected to reach USD 132.04 billion by 2032 and grow at a CAGR of 7.54% over the forecast period 2024-2032.
Iron Ore Market size was valued at USD 309.7 billion in 2023 and is expected to reach USD 392.4 billion by 2032, growing at a CAGR of 2.7% from 2024 to 2032.
Net-Zero Energy Buildings Market size was valued at USD 41.70 Bn in 2023 and is expected to reach USD 194.97 Bn by 2032, at a CAGR of 18.70% from 2024-2032.
The Isoparaffin Solvents Market Size was USD 870 Million in 2023 and will Reach to USD 1185.7 Million by 2032 and grow at a CAGR of 3.5% by of 2024-2032.
The Polyimide Films and Tapes Market size was valued at USD 1.9 Billion in 2023. It is expected to grow to USD 3.6 Billion by 2032 and grow at a CAGR of 8.2% over the forecast period of 2024-2032.
Hi! Click one of our member below to chat on Phone