Get More Information on Water Treatment Chemicals Market - Request Sample Report
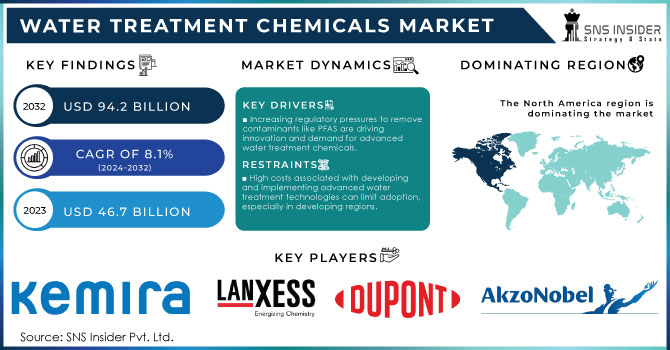
The Water Treatment Chemicals Market Size was valued at USD 46.7 billion in 2023, and is expected to reach USD 94.2 billion by 2032, and grow at a CAGR of 8.1% over the forecast period 2024-2032.
The water treatment chemicals market is presently undergoing significant transformation, impelled by a set of dynamic factors and recent technological changes. Various growing concerns regarding water contamination and toxic pollutants have increased interest in the implementation of new water treatments to eliminate such harmful contaminants as "forever chemicals" (PFAS). These chemical compounds are notorious for being persistent in the environment; hence, they become of prime concern to regulatory bodies and also to industry players.
The recent water filtration technologies being developed are indicative of the market's proactive ways of handling persistent contaminants. This involves the unveiling of a breakthrough filtration material in September 2024 that is said to have the potential to effectively remove long-lasting chemicals from water. This new material employs an advanced filtration technique that can target and remove such stubborn pollutants and thus could be a potential solution for the problem of the persistence of water contamination. This further illustrates an increasing focus on the development of specialty materials with the capability to resolve complex water quality issues.
Additionally, in January 2024, such zwitterionic hydrogels were developed by scientists that showed rapid removal of micropollutants from water. These hydrogels take advantage of their peculiar chemical nature to attract and neutralize the pollutants, thus joining the ranks of water purification chemicals. Their capability for fast and effective withdrawal of contaminants underlines the commitment of this industry to the ongoing improvement of methods for water purification and the fulfillment of more and more strict regulatory limits.
Furthermore, the advanced treatment technology commitment, in May 2023, it was reported that a new PFAS removal method in water was developed. Such treatment combines various chemicals to degrade the tough-to-break pollutant and thus manifests effort into one of the most challenging environmental concerns. The continuous development and refinement of such methods are representative of the market commitment to improvement in assurance about water safety and emerging contamination concerns. Similarly, in April 2024, the EPA set new limits on the levels of PFAS in drinking water, reflecting heightened regulatory pressure on the water treatment industry. These regulations will lead to more intense processes of water treatment, further spurring innovation in water treatment chemicals. Companies are subsequently upgrading their products to current standards and appropriate solutions for safe water.
Moreover, the chemical storage facilities in Raleigh, North Carolina, were enhanced in July 2024 to improve the security of its water supply. This would indeed reflect the practical measures taken to ensure sufficient and safe storage of water treatment chemicals to be highly instrumental in maintaining effectiveness in treatment processes and public health. The water treatment chemicals market is experiencing swift growth based on the development of technologies, variations in regulatory environments, and increases in demands for effective solutions against water pollution. Alongside new material and technique development, growing regulatory pressures will also help shape the future of water treatment with emerging challenges faced by the industry.
Drivers:
Increasing regulatory pressures to remove contaminants like PFAS are driving innovation and demand for advanced water treatment chemicals.
Increasing regulatory pressures to eliminate contaminants such as PFAS are one of the major driving forces for innovation and demand in the Water Treatment Chemicals Market. As governments and environmental agencies around the world set stricter regulations on the permissible levels of hazardous substances in drinking water, companies are driven to innovate better and more efficient means of treatment. For example, the US EPA has imposed strict limits on PFAS concentrations; thus, water utilities and treatment plants have to seek emerging technologies capable of meeting such standards and installing them. Companies have been investing in developing special adsorbents and ion exchange resins for efficient capture and removal of PFAS from water supplies. The European Union in Europe has imposed regulations classifying PFAS as substances of concern, inspiring the development of novel chemical formulations targeting these contaminants. Companies like 3M and DuPont have active research and commercialization efforts regarding novel chemical treatments and filtration media that are targeted and specifically engineered to address PFAS and other emerging pollutants. These economies achieve not only regulatory compliance but also the improvement of water safety and quality-clear indications of how the market responds to continuously changing environmental standards. Therefore, regulatory pressures will keep on increasing, imposing the necessity for advanced and effective chemicals in water treatment.
• Investments in advanced filtration technologies are increasingly being driven by the environmental and health impacts of polluted water sources.
Increasing awareness of environmental effects, along with increasing health-related effects due to contaminated water, has been one of the prime reasons for investment in improved filtration technologies within the water treatment chemicals market. As more and more people are becoming aware of the health and ecological costs arising from polluted water, demand is increasing. Incidents like water contamination recently brought to the fore in the lead crisis of Flint, Michigan- have driven massive investments into new filtration technologies. Greater awareness has made sure that substantial funds flow toward advanced filtration systems, which can remove a wider range of contaminants present in water supplies, from heavy metals to pharmaceuticals and microplastics. In response to this demand, new advanced filtration technologies have emerged and commercialized from companies including Danaher and Pentair, such as ultrafiltration membranes and advanced oxidation processes, improving water purity and safety. The ecological impacts of water pollution, ranging from aquatic life to biodiversity, increasingly raise awareness that fuels investments into environmentally friendly water treatment technologies. These advanced solutions are further being accelerated through government incentives and public-private partnerships, reflecting a proactive approach toward better water treatment and sustainability. On account of increasing awareness, there is likely to be more stringent enforcement for innovative and efficient filtration technologies, hence ongoing developments and increased market activity in the sector of water treatment chemicals.
Restraint:
High costs associated with developing and implementing advanced water treatment technologies can limit adoption, especially in developing regions.
High costs developed and involved in the implementation of advanced water treatment technologies can greatly impede this technology's adoption, especially in developing regions. Advanced filtration systems, chemical treatments involving nanotechnology or advanced oxidation processes, and related filtration systems are extremely capital-intensive in terms of research, infrastructure, and maintenance costs. In developing countries, where the budgets for water infrastructures are very limited, such high costs become unaffordable. For instance, state-of-the-art advanced reverse osmosis systems or electrochemical treatments require high investments not only in their purchase but also in their operational use fact that most countries with limited resources might hardly be able to bear continuously. As a result, a large number of developing regions may hardly adopt these technologies, continuing to rely on more traditional methods that already appear less effective and do not fully address emerging water quality issues. Presently, sophisticated solutions are financially prohibitive for widespread application, which means there is a requirement to deal with complicated contaminants for better water safety.
Opportunity:
Emerging markets present significant growth potential for water treatment chemicals as infrastructure development and environmental regulations expand.
Infrastructure development and expanding environmental regulations in emerging markets have created large growth opportunities for water treatment chemicals. As investment in the upgrading and expansion of infrastructure within the water market in emerging regions continues to rise to meet the increasing population and urbanization, so does the need for appropriate and effective water treatment. Specifically, the increased enforcement of higher environmental standards in countries of Southeast Asia and Africa has increasingly realized water pollution and improvements in public health using new systems for water purification. It is on these bases that companies specializing in water treatment chemicals find a fertile environment to introduce their products and technologies. While investments in state-of-the-art water treatment plants and improvements in regulatory frameworks have created the need for advanced sophisticated chemicals to treat a wide range of contaminants, these markets, though at constant development processes, do nevertheless represent some major opportunities for growth and innovation in the water treatment area. Companies could be brought into a strategic position by leveraging the growing demand for effective and efficient treatments.
Challenge:
• Rapid technological advancements require continuous investment in research and development, posing a challenge for companies to keep pace and remain competitive.
The high pace at which water treatment chemicals technology is unfolding calls for almost incessant reinvestment in research and development. Hence, the main challenge to any competitive company is the pressure to continuously innovate along with every new technology such as advanced filtration materials or novel chemical treatments so as not to fall behind. For instance, enterprises that work on the development of the latest nanomaterials or smart water monitoring systems usually require substantial R&D investments regarding the creation and commercialization of such value-enhanced solutions. These continuous investment needs may outweigh financial burdens and thus become a real entry barrier for small companies or low-budget enterprises since they hardly can compete with the leading group to whom such investments could be easier to bear. Consequently, companies have to balance their R&D expenditures against other needs for operations to offer state-of-the-art products that can meet new and emerging water quality problems.
By Type
The coagulants and flocculants segment dominated the Water Treatment Chemicals Market in 2023, commanding a market share of approximately 35%, as per estimation. This can be because coagulants and flocculants have the largest applicative areas in water treatment, be it for municipalities, industrial processes, or other wastewater treatments. Such chemicals are mainly used for the removal of suspended solids and impurities from water through the aggregation of particles into large clumps that could be later easily separated by filtration or sedimentation. For example, the most commonly applied coagulants and flocculants in water treatment involve alum and polyacrylamide; these are essential agents that should be involved in the treatment of drinking water so that it meet safety standards and is appropriate for consumption. Their effectiveness in improving process effectiveness for water purification and applicability to a wide range of industries keeps them way ahead of other competitors.
By Application
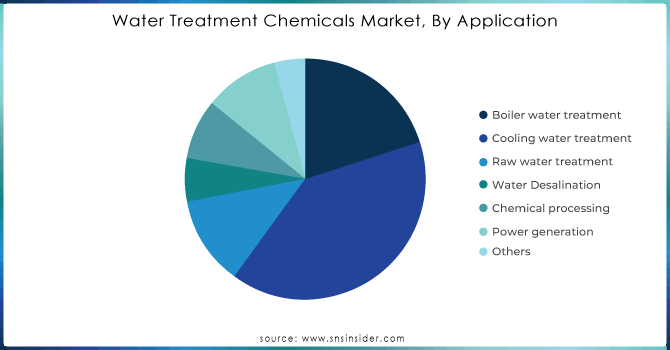
Cooling Water Treatment dominated and accounted for about 40% of the total Water Treatment Chemicals Market in 2023. This is primarily because cooling water treatment has become an indispensable aspect of the functioning of all industries and the generation of power. Cooling systems form an integral part of industrial processes and generation of power to dissipate the built-up heat. Water treatment programs are meant to address the issues of scaling, corrosion, and biological fouling, each of which may reduce system efficiency. Most of the chemical treatment applied to the cooling towers in the power plants for efficient performance and a longer life span includes scale inhibitors and biocides. This underlines a high segment of the market, involving the high volume of cooling water used and the critical need to ensure operational efficiency with reduced downtime.
Get Customized Report as per Your Business Requirement - Request For Customized Report
By End-use Industry
The Industrial segment dominated the Water Treatment Chemicals Market and accounted for approximately 45% of the estimated share in 2023. Major driving factors such as extensive application in power generation, oil and gas extraction industries, chemicals, and mining drive the dominance of this segment. Most of the processes in industries require massive usage of water, which has to be treated for various reasons: to assure efficiency in operations, to prevent any damage to machinery or equipment involved in the process, and to follow environmental laws. For instance, the chemical treatment in power generation involves boiler water treatment and cooling systems, while in the oil and gas segment, the applications are found in enhanced oil recovery and the treatment of produced water. Since all these industries are in great demand, the extensive use of water treatment chemicals in these industries significantly contributes to the leading market share of the Industrial segment.
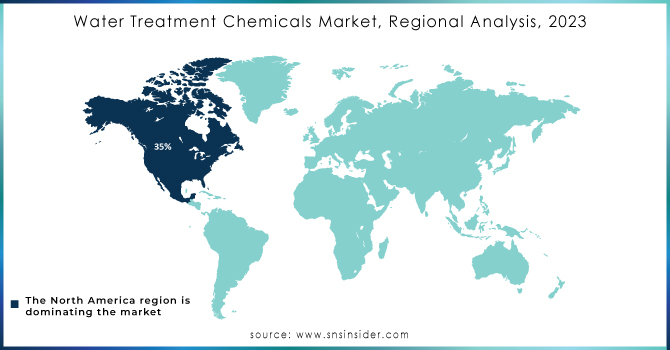
In 2023, North America dominated the Water Treatment Chemicals Market, contributing around 35% to the total estimate, considering the region has highly developed infrastructure for industries, stringent environmental regulations, and soaring demands across multiple sectors. For instance, the U.S. and Canada have very strong industrial activities in areas such as power generation, chemical manufacturing, etc., for which large-scale water treatment is required to regulate processes and meet regulatory standards. Further, substantial investments in upgrading water treatment plants and controlling emerging contaminants have also strengthened the market growth in this region. Thus, the strong orientation of North America toward both water quality and technology within treatment methods cements its leading position in the global market.
Key Players:
Kemira OYJ, Lanxess, DuPont, Akzo Nobel NV, Solenis LLC, Ecolab Inc, Baker Hughes, Suez SA, Lonza Group, LG Chem Ltd., and other key players.
| Report Attributes | Details |
|---|---|
| Market Size in 2023 | US$ 46.7 Billion |
| Market Size by 2032 | US$ 94.2 Billion |
| CAGR | CAGR of 8.1% From 2024 to 2032 |
| Base Year | 2023 |
| Forecast Period | 2024-2032 |
| Historical Data | 2020-2022 |
| Report Scope & Coverage | Market Size, Segments Analysis, Competitive Landscape, Regional Analysis, DROC & SWOT Analysis, Forecast Outlook |
| Key Segments | •By Type (Coagulants & Flocculants, pH Adjusters & Softeners, Biocides & Disinfectants, Scale Inhibitors & Dispersants, Corrosion Inhibitors, Chelating agents, Anti-foaming agents, Others) •By Application (Boiler water treatment, Cooling water treatment, Raw water treatment, Water Desalination, Chemical processing, Power generation, Others) •By End-use Industry (Residential, Commercial, Industrial, Power, Oil and Gas, Chemical Manufacturing, Mining and Mineral Processing, Food and Beverage, Pulp and Paper, Others) |
| Regional Analysis/Coverage | North America (US, Canada, Mexico), Europe (Eastern Europe [Poland, Romania, Hungary, Turkey, Rest of Eastern Europe] Western Europe] Germany, France, UK, Italy, Spain, Netherlands, Switzerland, Austria, Rest of Western Europe]), Asia Pacific (China, India, Japan, South Korea, Vietnam, Singapore, Australia, Rest of Asia Pacific), Middle East & Africa (Middle East [UAE, Egypt, Saudi Arabia, Qatar, Rest of Middle East], Africa [Nigeria, South Africa, Rest of Africa], Latin America (Brazil, Argentina, Colombia, Rest of Latin America) |
| Company Profiles | Kemira OYJ, Lanxess, DuPont, Akzo Nobel NV, Solenis LLC, Ecolab Inc, Baker Hughes, Suez SA, and, Lonza Group, LG Chem Ltd. and other key players |
| Key Drivers | • Increasing regulatory pressures to remove contaminants like PFAS are driving innovation and demand for advanced water treatment chemicals • Investments in advanced filtration technologies are increasingly being driven by the environmental and health impacts of polluted water sources |
| Restraints | •High costs associated with developing and implementing advanced water treatment technologies can limit adoption, especially in developing regions |
Ans: The Water Treatment Chemicals Market Size was valued at USD 46.7 billion in 2023 and is expected to reach USD 94.2 billion by 2032.
Ans: The Water Treatment Chemicals Market is expected to grow at a CAGR of 8.1%.
Ans: Emerging markets present significant opportunities for water treatment chemicals as infrastructure development and environmental regulations expand.
Ans: Kemira OYJ (Finland), Lanxess (Germany), DuPont (US), Akzo Nobel NV (Netherlands), Solenis LLC (US), Ecolab Inc (US),Baker Hughes (US), Suez SA (France) and, Lonza Group (Switzerland) are some of the major players of the Global Water Treatment Chemicals Market.
Ans: Yes.
Table of Contents:
1. Introduction
1.1 Market Definition
1.2 Scope (Inclusion and Exclusions)
1.3 Research Assumptions
2. Executive Summary
2.1 Market Overview
2.2 Regional Synopsis
2.3 Competitive Summary
3. Research Methodology
3.1 Top-Down Approach
3.2 Bottom-up Approach
3.3. Data Validation
3.4 Primary Interviews
4. Market Dynamics Impact Analysis
4.1 Market Driving Factors Analysis
4.1.1 Drivers
4.1.2 Restraints
4.1.3 Opportunities
4.1.4 Challenges
4.2 PESTLE Analysis
4.3 Porter’s Five Forces Model
5. Statistical Insights and Trends Reporting
5.1 Production Capacity and Utilization Analysis by Region
5.2 Feedstock Prices Analysis by Region
5.3 Regulatory Impact: Effects of regulations on production and usage.
5.4 Environmental Metrics Analysis by Region
5.5 Innovation and R&D
6. Competitive Landscape
6.1 List of Major Companies, By Region
6.2 Market Share Analysis, By Region
6.3 Product Benchmarking
6.3.1 Product specifications and features
6.3.2 Pricing
6.4 Strategic Initiatives
6.4.1 Marketing and promotional activities
6.4.2 Distribution and supply chain strategies
6.4.3 Expansion plans and new product launches
6.4.4 Strategic partnerships and collaborations
6.5 Technological Advancements
6.6 Market Positioning and Branding
7. Water Treatment Chemicals Market Segmentation, by Grade
7.1 Chapter Overview
7.2 Coagulants & Flocculants
7.2.1 Coagulants & Flocculants Market Trends Analysis (2020-2032)
7.2.2 Coagulants & Flocculants Market Size Estimates and Forecasts to 2032 (USD Billion)
7.3 PH Adjusters & Softeners
7.3.1 PH Adjusters & Softeners Market Trends Analysis (2020-2032)
7.3.2 PH Adjusters & Softeners Market Size Estimates and Forecasts to 2032 (USD Billion)
7.4 Biocides & Disinfectants
7.4.1 Biocides & Disinfectants Market Trends Analysis (2020-2032)
7.4.2 Biocides & Disinfectants Market Size Estimates and Forecasts to 2032 (USD Billion)
7.5 Scale Inhibitors & Dispersants
7.5.1 Scale Inhibitors & Dispersants Market Trends Analysis (2020-2032)
7.5.2 Scale Inhibitors & Dispersants Market Size Estimates and Forecasts to 2032 (USD Billion)
7.6 Corrosion Inhibitors
7.6.1 Corrosion Inhibitors Market Trends Analysis (2020-2032)
7.6.2 Corrosion Inhibitors Market Size Estimates and Forecasts to 2032 (USD Billion)
7.7 Chelating agents
7.7.1 Chelating agents Market Trends Analysis (2020-2032)
7.7.2 Chelating agents Market Size Estimates and Forecasts to 2032 (USD Billion)
7.8 Anti-foaming agents
7.8.1 Anti-foaming agents Market Trends Analysis (2020-2032)
7.8.2 Anti-foaming agents Market Size Estimates and Forecasts to 2032 (USD Billion)
7.9 Others
7.9.1 Others Market Trends Analysis (2020-2032)
7.9.2 Others Market Size Estimates and Forecasts to 2032 (USD Billion)
8. Water Treatment Chemicals Market Segmentation, by Application
8.1 Chapter Overview
8.2 Boiler water treatment
8.2.1 Boiler water treatment Market Trends Analysis (2020-2032)
8.2.2 Boiler water treatment Market Size Estimates and Forecasts to 2032 (USD Billion)
8.3 Cooling water treatment
8.3.1 Cooling water treatment Market Trends Analysis (2020-2032)
8.3.2 Cooling water treatment Market Size Estimates and Forecasts to 2032 (USD Billion)
8.4 Raw water treatment
8.4.1 Raw water treatment Market Trends Analysis (2020-2032)
8.4.2 Raw water treatment Market Size Estimates and Forecasts to 2032 (USD Billion)
8.5 Water Desalination
8.5.1 Water Desalination Market Trends Analysis (2020-2032)
8.5.2 Water Desalination Market Size Estimates and Forecasts to 2032 (USD Billion)
8.6 Chemical processing
8.6.1 Chemical processing Market Trends Analysis (2020-2032)
8.6.2 Chemical processing Market Size Estimates and Forecasts to 2032 (USD Billion)
8.7 Chemical processing
8.7.1 Chemical processing Market Trends Analysis (2020-2032)
8.7.2 Chemical processing Market Size Estimates and Forecasts to 2032 (USD Billion)
8.8 Power generation
8.8.1 Power generation Market Trends Analysis (2020-2032)
8.8.2 Power generation Market Size Estimates and Forecasts to 2032 (USD Billion)
8.9 Others
8.9.1 Others Market Trends Analysis (2020-2032)
8.9.2 Others Market Size Estimates and Forecasts to 2032 (USD Billion)
9. Water Treatment Chemicals Market Segmentation, by End-use Industry
9.1 Chapter Overview
9.2 Residential
9.2.1 Residential Market Trends Analysis (2020-2032)
9.2.2 Residential Market Size Estimates and Forecasts to 2032 (USD Billion)
9.3 Commercial
9.3.1 Commercial Market Trends Analysis (2020-2032)
9.3.2 Commercial Market Size Estimates and Forecasts to 2032 (USD Billion)
9.4 Industrial
9.4.1 Industrial Market Trends Analysis (2020-2032)
9.4.2 Industrial Market Size Estimates and Forecasts to 2032 (USD Billion)
9.4.3 Power
9.4.3.1 Power Market Trends Analysis (2020-2032)
9.4.3.2 Power Market Size Estimates and Forecasts to 2032 (USD Billion)
9.4.4 Oil and Gas
9.4.4.1 Oil and Gas Market Trends Analysis (2020-2032)
9.4.4.2 Oil and Gas Market Size Estimates and Forecasts to 2032 (USD Billion)
9.4.5 Chemical Manufacturing
9.4.5.1 Chemical Manufacturing Market Trends Analysis (2020-2032)
9.4.5.2 Chemical Manufacturing Market Size Estimates and Forecasts to 2032 (USD Billion)
9.4.6 Mining and Mineral Processing
9.4.6.1 Mining and Mineral Processing Market Trends Analysis (2020-2032)
9.4.6.2 Mining and Mineral Processing Market Size Estimates and Forecasts to 2032 (USD Billion)
9.4.7 Food and Beverage
9.4.7.1 Food and Beverage Market Trends Analysis (2020-2032)
9.4.7.2 Food and Beverage Market Size Estimates and Forecasts to 2032 (USD Billion)
9.4.8 Pulp and Paper
9.4.8.1 Pulp and Paper Market Trends Analysis (2020-2032)
9.4.8.2 Pulp and Paper Market Size Estimates and Forecasts to 2032 (USD Billion)
9.4.9 Others
9.4.9.1 Others Market Trends Analysis (2020-2032)
9.4.9.2 Others Market Size Estimates and Forecasts to 2032 (USD Billion)
10. Regional Analysis
10.1 Chapter Overview
10.2 North America
10.2.1 Trends Analysis
10.2.2 North America Water Treatment Chemicals Market Estimates and Forecasts, by Country (2020-2032) (USD Billion)
10.2.3 North America Water Treatment Chemicals Market Estimates and Forecasts, by Grade (2020-2032) (USD Billion)
10.2.4 North America Water Treatment Chemicals Market Estimates and Forecasts, by Application (2020-2032) (USD Billion)
10.2.5 North America Water Treatment Chemicals Market Estimates and Forecasts, by End-use Industry (2020-2032) (USD Billion)
10.2.6 USA
10.2.6.1 USA Water Treatment Chemicals Market Estimates and Forecasts, by Grade (2020-2032) (USD Billion)
10.2.6.2 USA Water Treatment Chemicals Market Estimates and Forecasts, by Application (2020-2032) (USD Billion)
10.2.6.3 USA Water Treatment Chemicals Market Estimates and Forecasts, by End-use Industry (2020-2032) (USD Billion)
10.2.7 Canada
10.2.7.1 Canada Water Treatment Chemicals Market Estimates and Forecasts, by Grade (2020-2032) (USD Billion)
10.2.7.2 Canada Water Treatment Chemicals Market Estimates and Forecasts, by Application (2020-2032) (USD Billion)
10.2.7.3 Canada Water Treatment Chemicals Market Estimates and Forecasts, by End-use Industry (2020-2032) (USD Billion)
10.2.8 Mexico
10.2.8.1 Mexico Water Treatment Chemicals Market Estimates and Forecasts, by Grade (2020-2032) (USD Billion)
10.2.8.2 Mexico Water Treatment Chemicals Market Estimates and Forecasts, by Application (2020-2032) (USD Billion)
10.2.8.3 Mexico Water Treatment Chemicals Market Estimates and Forecasts, by End-use Industry (2020-2032) (USD Billion)
10.3 Europe
10.3.1 Eastern Europe
10.3.1.1 Trends Analysis
10.3.1.2 Eastern Europe Water Treatment Chemicals Market Estimates and Forecasts, by Country (2020-2032) (USD Billion)
10.3.1.3 Eastern Europe Water Treatment Chemicals Market Estimates and Forecasts, by Grade (2020-2032) (USD Billion)
10.3.1.4 Eastern Europe Water Treatment Chemicals Market Estimates and Forecasts, by Application (2020-2032) (USD Billion)
10.3.1.5 Eastern Europe Water Treatment Chemicals Market Estimates and Forecasts, by End-use Industry (2020-2032) (USD Billion)
10.3.1.6 Poland
10.3.1.6.1 Poland Water Treatment Chemicals Market Estimates and Forecasts, by Grade (2020-2032) (USD Billion)
10.3.1.6.2 Poland Water Treatment Chemicals Market Estimates and Forecasts, by Application (2020-2032) (USD Billion)
10.3.1.6.3 Poland Water Treatment Chemicals Market Estimates and Forecasts, by End-use Industry (2020-2032) (USD Billion)
10.3.1.7 Romania
10.3.1.7.1 Romania Water Treatment Chemicals Market Estimates and Forecasts, by Grade (2020-2032) (USD Billion)
10.3.1.7.2 Romania Water Treatment Chemicals Market Estimates and Forecasts, by Application (2020-2032) (USD Billion)
10.3.1.7.3 Romania Water Treatment Chemicals Market Estimates and Forecasts, by End-use Industry (2020-2032) (USD Billion)
10.3.1.8 Hungary
10.3.1.8.1 Hungary Water Treatment Chemicals Market Estimates and Forecasts, by Grade (2020-2032) (USD Billion)
10.3.1.8.2 Hungary Water Treatment Chemicals Market Estimates and Forecasts, by Application (2020-2032) (USD Billion)
10.3.1.8.3 Hungary Water Treatment Chemicals Market Estimates and Forecasts, by End-use Industry (2020-2032) (USD Billion)
10.3.1.9 Turkey
10.3.1.9.1 Turkey Water Treatment Chemicals Market Estimates and Forecasts, by Grade (2020-2032) (USD Billion)
10.3.1.9.2 Turkey Water Treatment Chemicals Market Estimates and Forecasts, by Application (2020-2032) (USD Billion)
10.3.1.9.3 Turkey Water Treatment Chemicals Market Estimates and Forecasts, by End-use Industry (2020-2032) (USD Billion)
10.3.1.10 Rest of Eastern Europe
10.3.1.10.1 Rest of Eastern Europe Water Treatment Chemicals Market Estimates and Forecasts, by Grade (2020-2032) (USD Billion)
10.3.1.10.2 Rest of Eastern Europe Water Treatment Chemicals Market Estimates and Forecasts, by Application (2020-2032) (USD Billion)
10.3.1.10.3 Rest of Eastern Europe Water Treatment Chemicals Market Estimates and Forecasts, by End-use Industry (2020-2032) (USD Billion)
10.3.2 Western Europe
10.3.2.1 Trends Analysis
10.3.2.2 Western Europe Water Treatment Chemicals Market Estimates and Forecasts, by Country (2020-2032) (USD Billion)
10.3.2.3 Western Europe Water Treatment Chemicals Market Estimates and Forecasts, by Grade (2020-2032) (USD Billion)
10.3.2.4 Western Europe Water Treatment Chemicals Market Estimates and Forecasts, by Application (2020-2032) (USD Billion)
10.3.2.5 Western Europe Water Treatment Chemicals Market Estimates and Forecasts, by End-use Industry (2020-2032) (USD Billion)
10.3.2.6 Germany
10.3.2.6.1 Germany Water Treatment Chemicals Market Estimates and Forecasts, by Grade (2020-2032) (USD Billion)
10.3.2.6.2 Germany Water Treatment Chemicals Market Estimates and Forecasts, by Application (2020-2032) (USD Billion)
10.3.2.6.3 Germany Water Treatment Chemicals Market Estimates and Forecasts, by End-use Industry (2020-2032) (USD Billion)
10.3.2.7 France
10.3.2.7.1 France Water Treatment Chemicals Market Estimates and Forecasts, by Grade (2020-2032) (USD Billion)
10.3.2.7.2 France Water Treatment Chemicals Market Estimates and Forecasts, by Application (2020-2032) (USD Billion)
10.3.2.7.3 France Water Treatment Chemicals Market Estimates and Forecasts, by End-use Industry (2020-2032) (USD Billion)
10.3.2.8 UK
10.3.2.8.1 UK Water Treatment Chemicals Market Estimates and Forecasts, by Grade (2020-2032) (USD Billion)
10.3.2.8.2 UK Water Treatment Chemicals Market Estimates and Forecasts, by Application (2020-2032) (USD Billion)
10.3.2.8.3 UK Water Treatment Chemicals Market Estimates and Forecasts, by End-use Industry (2020-2032) (USD Billion)
10.3.2.9 Italy
10.3.2.9.1 Italy Water Treatment Chemicals Market Estimates and Forecasts, by Grade (2020-2032) (USD Billion)
10.3.2.9.2 Italy Water Treatment Chemicals Market Estimates and Forecasts, by Application (2020-2032) (USD Billion)
10.3.2.9.3 Italy Water Treatment Chemicals Market Estimates and Forecasts, by End-use Industry (2020-2032) (USD Billion)
10.3.2.10 Spain
10.3.2.10.1 Spain Water Treatment Chemicals Market Estimates and Forecasts, by Grade (2020-2032) (USD Billion)
10.3.2.10.2 Spain Water Treatment Chemicals Market Estimates and Forecasts, by Application (2020-2032) (USD Billion)
10.3.2.10.3 Spain Water Treatment Chemicals Market Estimates and Forecasts, by End-use Industry (2020-2032) (USD Billion)
10.3.2.11 Netherlands
10.3.2.11.1 Netherlands Water Treatment Chemicals Market Estimates and Forecasts, by Grade (2020-2032) (USD Billion)
10.3.2.11.2 Netherlands Water Treatment Chemicals Market Estimates and Forecasts, by Application (2020-2032) (USD Billion)
10.3.2.11.3 Netherlands Water Treatment Chemicals Market Estimates and Forecasts, by End-use Industry (2020-2032) (USD Billion)
10.3.2.12 Switzerland
10.3.2.12.1 Switzerland Water Treatment Chemicals Market Estimates and Forecasts, by Grade (2020-2032) (USD Billion)
10.3.2.12.2 Switzerland Water Treatment Chemicals Market Estimates and Forecasts, by Application (2020-2032) (USD Billion)
10.3.2.12.3 Switzerland Water Treatment Chemicals Market Estimates and Forecasts, by End-use Industry (2020-2032) (USD Billion)
10.3.2.13 Austria
10.3.2.13.1 Austria Water Treatment Chemicals Market Estimates and Forecasts, by Grade (2020-2032) (USD Billion)
10.3.2.13.2 Austria Water Treatment Chemicals Market Estimates and Forecasts, by Application (2020-2032) (USD Billion)
10.3.2.13.3 Austria Water Treatment Chemicals Market Estimates and Forecasts, by End-use Industry (2020-2032) (USD Billion)
10.3.2.14 Rest of Western Europe
10.3.2.14.1 Rest of Western Europe Water Treatment Chemicals Market Estimates and Forecasts, by Grade (2020-2032) (USD Billion)
10.3.2.14.2 Rest of Western Europe Water Treatment Chemicals Market Estimates and Forecasts, by Application (2020-2032) (USD Billion)
10.3.2.14.3 Rest of Western Europe Water Treatment Chemicals Market Estimates and Forecasts, by End-use Industry (2020-2032) (USD Billion)
10.4 Asia Pacific
10.4.1 Trends Analysis
10.4.2 Asia Pacific Water Treatment Chemicals Market Estimates and Forecasts, by Country (2020-2032) (USD Billion)
10.4.3 Asia Pacific Water Treatment Chemicals Market Estimates and Forecasts, by Grade (2020-2032) (USD Billion)
10.4.4 Asia Pacific Water Treatment Chemicals Market Estimates and Forecasts, by Application (2020-2032) (USD Billion)
10.4.5 Asia Pacific Water Treatment Chemicals Market Estimates and Forecasts, by End-use Industry (2020-2032) (USD Billion)
10.4.6 China
10.4.6.1 China Water Treatment Chemicals Market Estimates and Forecasts, by Grade (2020-2032) (USD Billion)
10.4.6.2 China Water Treatment Chemicals Market Estimates and Forecasts, by Application (2020-2032) (USD Billion)
10.4.6.3 China Water Treatment Chemicals Market Estimates and Forecasts, by End-use Industry (2020-2032) (USD Billion)
10.4.7 India
10.4.7.1 India Water Treatment Chemicals Market Estimates and Forecasts, by Grade (2020-2032) (USD Billion)
10.4.7.2 India Water Treatment Chemicals Market Estimates and Forecasts, by Application (2020-2032) (USD Billion)
10.4.7.3 India Water Treatment Chemicals Market Estimates and Forecasts, by End-use Industry (2020-2032) (USD Billion)
10.4.8 Japan
10.4.8.1 Japan Water Treatment Chemicals Market Estimates and Forecasts, by Grade (2020-2032) (USD Billion)
10.4.8.2 Japan Water Treatment Chemicals Market Estimates and Forecasts, by Application (2020-2032) (USD Billion)
10.4.8.3 Japan Water Treatment Chemicals Market Estimates and Forecasts, by End-use Industry (2020-2032) (USD Billion)
10.4.9 South Korea
10.4.9.1 South Korea Water Treatment Chemicals Market Estimates and Forecasts, by Grade (2020-2032) (USD Billion)
10.4.9.2 South Korea Water Treatment Chemicals Market Estimates and Forecasts, by Application (2020-2032) (USD Billion)
10.4.9.3 South Korea Water Treatment Chemicals Market Estimates and Forecasts, by End-use Industry (2020-2032) (USD Billion)
10.4.10 Vietnam
10.4.10.1 Vietnam Water Treatment Chemicals Market Estimates and Forecasts, by Grade (2020-2032) (USD Billion)
10.4.10.2 Vietnam Water Treatment Chemicals Market Estimates and Forecasts, by Application (2020-2032) (USD Billion)
10.4.10.3 Vietnam Water Treatment Chemicals Market Estimates and Forecasts, by End-use Industry (2020-2032) (USD Billion)
10.4.11 Singapore
10.4.11.1 Singapore Water Treatment Chemicals Market Estimates and Forecasts, by Grade (2020-2032) (USD Billion)
10.4.11.2 Singapore Water Treatment Chemicals Market Estimates and Forecasts, by Application (2020-2032) (USD Billion)
10.4.11.3 Singapore Water Treatment Chemicals Market Estimates and Forecasts, by End-use Industry (2020-2032) (USD Billion)
10.4.12 Australia
10.4.12.1 Australia Water Treatment Chemicals Market Estimates and Forecasts, by Grade (2020-2032) (USD Billion)
10.4.12.2 Australia Water Treatment Chemicals Market Estimates and Forecasts, by Application (2020-2032) (USD Billion)
10.4.12.3 Australia Water Treatment Chemicals Market Estimates and Forecasts, by End-use Industry (2020-2032) (USD Billion)
10.4.13 Rest of Asia Pacific
10.4.13.1 Rest of Asia Pacific Water Treatment Chemicals Market Estimates and Forecasts, by Grade (2020-2032) (USD Billion)
10.4.13.2 Rest of Asia Pacific Water Treatment Chemicals Market Estimates and Forecasts, by Application (2020-2032) (USD Billion)
10.4.13.3 Rest of Asia Pacific Water Treatment Chemicals Market Estimates and Forecasts, by End-use Industry (2020-2032) (USD Billion)
10.5 Middle East and Africa
10.5.1 Middle East
10.5.1.1 Trends Analysis
10.5.1.2 Middle East Water Treatment Chemicals Market Estimates and Forecasts, by Country (2020-2032) (USD Billion)
10.5.1.3 Middle East Water Treatment Chemicals Market Estimates and Forecasts, by Grade (2020-2032) (USD Billion)
10.5.1.4 Middle East Water Treatment Chemicals Market Estimates and Forecasts, by Application (2020-2032) (USD Billion)
10.5.1.5 Middle East Water Treatment Chemicals Market Estimates and Forecasts, by End-use Industry (2020-2032) (USD Billion)
10.5.1.6 UAE
10.5.1.6.1 UAE Water Treatment Chemicals Market Estimates and Forecasts, by Grade (2020-2032) (USD Billion)
10.5.1.6.2 UAE Water Treatment Chemicals Market Estimates and Forecasts, by Application (2020-2032) (USD Billion)
10.5.1.6.3 UAE Water Treatment Chemicals Market Estimates and Forecasts, by End-use Industry (2020-2032) (USD Billion)
10.5.1.7 Egypt
10.5.1.7.1 Egypt Water Treatment Chemicals Market Estimates and Forecasts, by Grade (2020-2032) (USD Billion)
10.5.1.7.2 Egypt Water Treatment Chemicals Market Estimates and Forecasts, by Application (2020-2032) (USD Billion)
10.5.1.7.3 Egypt Water Treatment Chemicals Market Estimates and Forecasts, by End-use Industry (2020-2032) (USD Billion)
10.5.1.8 Saudi Arabia
10.5.1.8.1 Saudi Arabia Water Treatment Chemicals Market Estimates and Forecasts, by Grade (2020-2032) (USD Billion)
10.5.1.8.2 Saudi Arabia Water Treatment Chemicals Market Estimates and Forecasts, by Application (2020-2032) (USD Billion)
10.5.1.8.3 Saudi Arabia Water Treatment Chemicals Market Estimates and Forecasts, by End-use Industry (2020-2032) (USD Billion)
10.5.1.9 Qatar
10.5.1.9.1 Qatar Water Treatment Chemicals Market Estimates and Forecasts, by Grade (2020-2032) (USD Billion)
10.5.1.9.2 Qatar Water Treatment Chemicals Market Estimates and Forecasts, by Application (2020-2032) (USD Billion)
10.5.1.9.3 Qatar Water Treatment Chemicals Market Estimates and Forecasts, by End-use Industry (2020-2032) (USD Billion)
10.5.1.10 Rest of Middle East
10.5.1.10.1 Rest of Middle East Water Treatment Chemicals Market Estimates and Forecasts, by Grade (2020-2032) (USD Billion)
10.5.1.10.2 Rest of Middle East Water Treatment Chemicals Market Estimates and Forecasts, by Application (2020-2032) (USD Billion)
10.5.1.10.3 Rest of Middle East Water Treatment Chemicals Market Estimates and Forecasts, by End-use Industry (2020-2032) (USD Billion)
10.5.2 Africa
10.5.2.1 Trends Analysis
10.5.2.2 Africa Water Treatment Chemicals Market Estimates and Forecasts, by Country (2020-2032) (USD Billion)
10.5.2.3 Africa Water Treatment Chemicals Market Estimates and Forecasts, by Grade (2020-2032) (USD Billion)
10.5.2.4 Africa Water Treatment Chemicals Market Estimates and Forecasts, by Application (2020-2032) (USD Billion)
10.5.2.5 Africa Water Treatment Chemicals Market Estimates and Forecasts, by End-use Industry (2020-2032) (USD Billion)
10.5.2.6 South Africa
10.5.2.6.1 South Africa Water Treatment Chemicals Market Estimates and Forecasts, by Grade (2020-2032) (USD Billion)
10.5.2.6.2 South Africa Water Treatment Chemicals Market Estimates and Forecasts, by Application (2020-2032) (USD Billion)
10.5.2.6.3 South Africa Water Treatment Chemicals Market Estimates and Forecasts, by End-use Industry (2020-2032) (USD Billion)
10.5.2.7 Nigeria
10.5.2.7.1 Nigeria Water Treatment Chemicals Market Estimates and Forecasts, by Grade (2020-2032) (USD Billion)
10.5.2.7.2 Nigeria Water Treatment Chemicals Market Estimates and Forecasts, by Application (2020-2032) (USD Billion)
10.5.2.7.3 Nigeria Water Treatment Chemicals Market Estimates and Forecasts, by End-use Industry (2020-2032) (USD Billion)
10.5.2.8 Rest of Africa
10.5.2.8.1 Rest of Africa Water Treatment Chemicals Market Estimates and Forecasts, by Grade (2020-2032) (USD Billion)
10.5.2.8.2 Rest of Africa Water Treatment Chemicals Market Estimates and Forecasts, by Application (2020-2032) (USD Billion)
10.5.2.8.3 Rest of Africa Water Treatment Chemicals Market Estimates and Forecasts, by End-use Industry (2020-2032) (USD Billion)
10.6 Latin America
10.6.1 Trends Analysis
10.6.2 Latin America Water Treatment Chemicals Market Estimates and Forecasts, by Country (2020-2032) (USD Billion)
10.6.3 Latin America Water Treatment Chemicals Market Estimates and Forecasts, by Grade (2020-2032) (USD Billion)
10.6.4 Latin America Water Treatment Chemicals Market Estimates and Forecasts, by Application (2020-2032) (USD Billion)
10.6.5 Latin America Water Treatment Chemicals Market Estimates and Forecasts, by End-use Industry (2020-2032) (USD Billion)
10.6.6 Brazil
10.6.6.1 Brazil Water Treatment Chemicals Market Estimates and Forecasts, by Grade (2020-2032) (USD Billion)
10.6.6.2 Brazil Water Treatment Chemicals Market Estimates and Forecasts, by Application (2020-2032) (USD Billion)
10.6.6.3 Brazil Water Treatment Chemicals Market Estimates and Forecasts, by End-use Industry (2020-2032) (USD Billion)
10.6.7 Argentina
10.6.7.1 Argentina Water Treatment Chemicals Market Estimates and Forecasts, by Grade (2020-2032) (USD Billion)
10.6.7.2 Argentina Water Treatment Chemicals Market Estimates and Forecasts, by Application (2020-2032) (USD Billion)
10.6.7.3 Argentina Water Treatment Chemicals Market Estimates and Forecasts, by End-use Industry (2020-2032) (USD Billion)
10.6.8 Colombia
10.6.8.1 Colombia Water Treatment Chemicals Market Estimates and Forecasts, by Grade (2020-2032) (USD Billion)
10.6.8.2 Colombia Water Treatment Chemicals Market Estimates and Forecasts, by Application (2020-2032) (USD Billion)
10.6.8.3 Colombia Water Treatment Chemicals Market Estimates and Forecasts, by End-use Industry (2020-2032) (USD Billion)
10.6.9 Rest of Latin America
10.6.9.1 Rest of Latin America Water Treatment Chemicals Market Estimates and Forecasts, by Grade (2020-2032) (USD Billion)
10.6.9.2 Rest of Latin America Water Treatment Chemicals Market Estimates and Forecasts, by Application (2020-2032) (USD Billion)
10.6.9.3 Rest of Latin America Water Treatment Chemicals Market Estimates and Forecasts, by End-use Industry (2020-2032) (USD Billion)
11. Company Profiles
11.1 Kemira OYJ
11.1.1 Company Overview
11.1.2 Financial
11.1.3 Products/ Services Offered
11.1.4 SWOT Analysis
11.2 Lanxess
11.2.1 Company Overview
11.2.2 Financial
11.2.3 Products/ Services Offered
11.2.4 SWOT Analysis
11.3 DuPont
11.3.1 Company Overview
11.3.2 Financial
11.3.3 Products/ Services Offered
11.3.4 SWOT Analysis
11.4 Akzo Nobel NV
11.4.1 Company Overview
11.4.2 Financial
11.4.3 Products/ Services Offered
11.4.4 SWOT Analysis
11.5 Solenis LLC
11.5.1 Company Overview
11.5.2 Financial
11.5.3 Products/ Services Offered
11.5.4 SWOT Analysis
11.6 Ecolab Inc
11.6.1 Company Overview
11.6.2 Financial
11.6.3 Products/ Services Offered
11.6.4 SWOT Analysis
11.7 Baker Hughes
11.7.1 Company Overview
11.7.2 Financial
11.7.3 Products/ Services Offered
11.7.4 SWOT Analysis
11.8 Suez SA
11.8.1 Company Overview
11.8.2 Financial
11.8.3 Products/ Services Offered
11.8.4 SWOT Analysis
11.9 Lonza Group
11.9.1 Company Overview
11.9.2 Financial
11.9.3 Products/ Services Offered
11.9.4 SWOT Analysis
11.10 LG Chem Ltd.
11.10.1 Company Overview
11.10.2 Financial
11.10.3 Products/ Services Offered
11.10.4 SWOT Analysis
12. Use Cases and Best Practices
13. Conclusion
An accurate research report requires proper strategizing as well as implementation. There are multiple factors involved in the completion of good and accurate research report and selecting the best methodology to compete the research is the toughest part. Since the research reports we provide play a crucial role in any company’s decision-making process, therefore we at SNS Insider always believe that we should choose the best method which gives us results closer to reality. This allows us to reach at a stage wherein we can provide our clients best and accurate investment to output ratio.
Each report that we prepare takes a timeframe of 350-400 business hours for production. Starting from the selection of titles through a couple of in-depth brain storming session to the final QC process before uploading our titles on our website we dedicate around 350 working hours. The titles are selected based on their current market cap and the foreseen CAGR and growth.
The 5 steps process:
Step 1: Secondary Research:
Secondary Research or Desk Research is as the name suggests is a research process wherein, we collect data through the readily available information. In this process we use various paid and unpaid databases which our team has access to and gather data through the same. This includes examining of listed companies’ annual reports, Journals, SEC filling etc. Apart from this our team has access to various associations across the globe across different industries. Lastly, we have exchange relationships with various university as well as individual libraries.

Step 2: Primary Research
When we talk about primary research, it is a type of study in which the researchers collect relevant data samples directly, rather than relying on previously collected data. This type of research is focused on gaining content specific facts that can be sued to solve specific problems. Since the collected data is fresh and first hand therefore it makes the study more accurate and genuine.
We at SNS Insider have divided Primary Research into 2 parts.
Part 1 wherein we interview the KOLs of major players as well as the upcoming ones across various geographic regions. This allows us to have their view over the market scenario and acts as an important tool to come closer to the accurate market numbers. As many as 45 paid and unpaid primary interviews are taken from both the demand and supply side of the industry to make sure we land at an accurate judgement and analysis of the market.
This step involves the triangulation of data wherein our team analyses the interview transcripts, online survey responses and observation of on filed participants. The below mentioned chart should give a better understanding of the part 1 of the primary interview.

Part 2: In this part of primary research the data collected via secondary research and the part 1 of the primary research is validated with the interviews from individual consultants and subject matter experts.
Consultants are those set of people who have at least 12 years of experience and expertise within the industry whereas Subject Matter Experts are those with at least 15 years of experience behind their back within the same space. The data with the help of two main processes i.e., FGDs (Focused Group Discussions) and IDs (Individual Discussions). This gives us a 3rd party nonbiased primary view of the market scenario making it a more dependable one while collation of the data pointers.
Step 3: Data Bank Validation
Once all the information is collected via primary and secondary sources, we run that information for data validation. At our intelligence centre our research heads track a lot of information related to the market which includes the quarterly reports, the daily stock prices, and other relevant information. Our data bank server gets updated every fortnight and that is how the information which we collected using our primary and secondary information is revalidated in real time.

Step 4: QA/QC Process
After all the data collection and validation our team does a final level of quality check and quality assurance to get rid of any unwanted or undesired mistakes. This might include but not limited to getting rid of the any typos, duplication of numbers or missing of any important information. The people involved in this process include technical content writers, research heads and graphics people. Once this process is completed the title gets uploader on our platform for our clients to read it.
Step 5: Final QC/QA Process:
This is the last process and comes when the client has ordered the study. In this process a final QA/QC is done before the study is emailed to the client. Since we believe in giving our clients a good experience of our research studies, therefore, to make sure that we do not lack at our end in any way humanly possible we do a final round of quality check and then dispatch the study to the client.
Key Segments:
By Type
Coagulants & Flocculants
pH Adjusters & Softeners
Biocides & Disinfectants
Scale Inhibitors & Dispersants
Corrosion Inhibitors
Chelating agents
Anti-foaming agents
Others
By Application
Boiler water treatment
Cooling water treatment
Raw water treatment
Water Desalination
Chemical processing
Power generation
Others
By End-use Industry
Residential
Commercial
Industrial
Power
Oil and Gas
Chemical Manufacturing
Mining and Mineral Processing
Food and Beverage
Pulp and Paper
Others
Request for Segment Customization as per your Business Requirement: Segment Customization Request
Regional Coverage:
North America
US
Canada
Mexico
Europe
Eastern Europe
Poland
Romania
Hungary
Turkey
Rest of Eastern Europe
Western Europe
Germany
France
UK
Italy
Spain
Netherlands
Switzerland
Austria
Rest of Western Europe
Asia Pacific
China
India
Japan
South Korea
Vietnam
Singapore
Australia
Rest of Asia Pacific
Middle East & Africa
Middle East
UAE
Egypt
Saudi Arabia
Qatar
Rest of Middle East
Africa
Nigeria
South Africa
Rest of Africa
Latin America
Brazil
Argentina
Colombia
Rest of Latin America
Request for Country Level Research Report: Country Level Customization Request
Available Customization
With the given market data, SNS Insider offers customization as per the company’s specific needs. The following customization options are available for the report:
Product Analysis
Criss-Cross segment analysis (e.g. Product X Application)
Product Matrix which gives a detailed comparison of product portfolio of each company
Geographic Analysis
Additional countries in any of the regions
Company Information
Detailed analysis and profiling of additional market players (Up to five)
Discover trends, growth drivers, and challenges in the global Medium Chain Triglycerides (MCT) market, including applications, key players, and forecast insights.
The Smart Textiles Market Size was USD 3.6 billion in 2023 and is expected to reach USD 26.1 billion by 2032 and grow at a CAGR of 25.0% by 2024-2032.
The Galacto-oligosaccharide (GOS) Market Size was valued at USD 1.10 Billion in 2023 and is expected to reach USD 2.37 Billion by 2032 and grow at a CAGR of 8.90% over the forecast period 2024-2032.
The Advanced Sintering Technologies Market Size was valued at USD 1.2 billion in 2023 and is expected to reach USD 2.2 billion by 2032 and grow at a CAGR of 7.3% over the forecast period 2024-2032.
The Advanced Elastomers Market size was USD 5.23 Billion in 2023 and is expected to reach USD 8.90 Billion by 2032, growing at a CAGR of 6.09 % from 2024-2032.
The Ethyl Acetate Market size was USD 5.39 Billion in 2023 and is expected to reach USD 9.59 Billion by 2032, growing at a CAGR of 6.62% from 2024 to 2032.

Hi! Click one of our member below to chat on Phone
© 2025 All Rights Reserved by SNS Insider Pvt Ltd


