Get More Information on Water Softening Systems Market - Request Sample Report
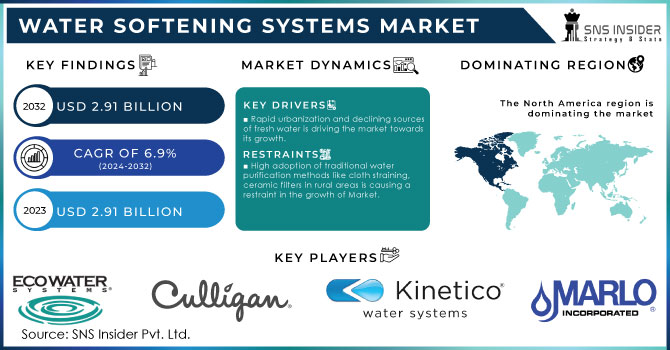
The Water Softening Systems Market size is expected to value at USD 2.91 billion in 2023 and is projected to reach USD 5.31 billion by 2032, with a growing CAGR of 6.9% over the forecast period 2024-2032.
The water softening systems market is experiencing significant growth, Rapid urbanization and the declining availability of fresh water are primary contributors to this trend. With more than 60% of the global GDP generated from urban areas, understanding the economic influence of these regions is critical. Urban centers are increasingly recognizing the importance of water softening systems as essential for ensuring the quality of water for residential, commercial, and industrial applications.
One of the key drivers behind the expansion of this market is the growing awareness of water quality issues among consumers. Hard water, which contains high levels of calcium and magnesium, can cause various problems, including scale buildup in plumbing and water-using appliances, as well as corrosion and performance degradation in industrial equipment. As consumers become more informed about the adverse effects of hard water, the demand for effective water softeners has surged, leading to increased sales and installations.
Technological advancements also play a crucial role in the market's growth. Innovations such as ion exchange resins, membrane filtration systems, and salt-free alternatives are making water softening more efficient and appealing to consumers. These advancements not only improve the effectiveness of water softening systems but also address concerns related to environmental impact, as many consumers seek more sustainable options. Moreover, stringent water quality standards enforced across various sectors including residential, commercial, and industrial are propelling the demand for water softening systems. These regulations necessitate the use of effective water treatment solutions, further enhancing market growth.
DRIVERS
The rising awareness of water quality issues, particularly concerning hard water, significantly drives the demand for water softening systems. Hard water, characterized by high levels of calcium and magnesium, can lead to several adverse effects on health and household appliances. Consumers are increasingly informed about these impacts, prompting them to seek effective solutions to enhance water quality in their homes.
Hard water can cause a range of health problems, such as skin irritation, dryness, and hair damage, making consumers more conscious of the water they use for daily activities. Additionally, hard water contributes to scale buildup in plumbing and appliances, reducing their efficiency and lifespan. For instance, water heaters, dishwashers, and washing machines are particularly affected, leading to costly repairs and replacements. As a result, consumers are recognizing the long-term financial benefits of investing in water softening systems to mitigate these issues. Moreover, health-conscious consumers are increasingly aware of the benefits of softened water for cooking and bathing. The desire for healthier lifestyles and improved well-being drives the demand for water softeners that can remove harmful minerals from the water supply. With a growing emphasis on water quality, manufacturers and service providers in the water treatment industry are responding by developing innovative and efficient water softening technologies. This increasing concern for water quality is a significant factor fueling the expansion of the water softening systems market, as consumers prioritize cleaner, safer, and more efficient water for their households.
The rising awareness of water quality issues has significantly impacted consumer preferences and choices regarding water treatment solutions. With the negative effects of hard water such as scale buildup, reduced appliance lifespan, and potential health risks consumers are increasingly seeking effective solutions to enhance their water quality. This growing concern has prompted the adoption of advanced water softening technologies designed to address these challenges while aligning with environmental values. Technological advancements have led to the development of innovative water softening systems, such as salt-free softeners and reverse osmosis units. Salt-free systems use a different mechanism to condition water, preventing scale formation without adding sodium to the water supply. This appeals particularly to health-conscious consumers and those concerned about sodium intake, as traditional salt-based systems can contribute to elevated sodium levels in drinking water. Additionally, salt-free systems often require less maintenance and generate less waste, further enhancing their appeal.
Reverse osmosis, on the other hand, not only softens water but also effectively removes a wide range of contaminants, including heavy metals, chlorine, and other impurities. This multi-functionality makes it an attractive choice for consumers who prioritize comprehensive water quality. Together, these innovations in water softening technology not only meet the rising demand for high-quality water but also resonate with environmentally conscious consumers. As more individuals recognize the importance of water quality for health and sustainability, the demand for advanced water treatment solutions is likely to continue to grow, driving further innovation in the sector.
RESTRAIN
As awareness of the detrimental effects of hard water on health and appliances grows, consumers are increasingly prioritizing water quality in their households. Hard water can lead to various issues, such as scale buildup in pipes and appliances, skin irritations, and decreased efficiency in soap and detergent use. This concern drives demand for water softening systems, as consumers seek effective solutions to improve their water quality. However, while the awareness is rising, the high installation and maintenance costs of these systems can be a significant barrier for many. The initial investment required for purchasing and installing water softeners can be steep, especially for families in low-income regions. Additionally, ongoing maintenance costs, including salt replenishment and system upkeep, may discourage potential buyers, limiting the adoption of water softening solutions despite the pressing need for improved water quality. Thus, addressing these financial concerns is essential for expanding market reach.
By Type
The salt-based type is dominating the market with a share of around 56.04% in 2023. This has been the most popular and commonly recognized type. By the help of ion exchange process, the systems use salt majorly sodium chloride in order to remove minerals from hard water which includes calcium and magnesium. Also, it prolongs the life of water-using appliances and is well-known for their efficiency in reducing hardness of water.
By Application
The Industrial application is dominating the market with a share of around 43.08% in 2023. Industries such as manufacturing, pharmaceuticals, food and beverage, need to deploy water-softening systems because large amount of water is required for the operations and these systems helps in removing the minerals that can lead to scaling and damage to machinery and equipment thus making it a primary factor in their dominance.
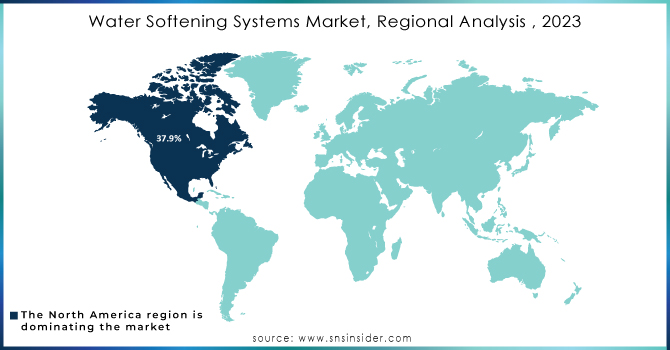
North America region is dominating the market with a share of around 37.9% of the total market. This dominance is because of its early adoption and high consciousness towards the environment. Chemicals and pollutants are affecting the water supply in the region because of evolving industrial and manufacturing operations. Almost 82% of homes are based on hard water regions, which is putting a pressure over the infrastructure. This is a key factor for the dominance of water softening systems in this region.
Need any customization research on Water Softening Systems Market - Enquiry Now
Some of the major key players of Water Softening Systems Market
Marlo Incorporated: (MARLO MGT Series Water Softener)
Kinetico Incorporated: (Kinetico Premier Series)
EcoWater Systems LLC: (EcoWater ESD 2752 Water Softener)
Culligan International Company: (Culligan High-Efficiency Water Softener)
General Electric Company: (GE SmartWater Water Softener)
Canature Environmental Products Co., Ltd: (Canature Whole House Water Softener)
Harvey Water Softeners Ltd: (Harvey TwinTec S4 Water Softener)
Pelican Water Systems: (Pelican Advantage Series)
BWT AG: (BWT Perla Silk Water Softener)
Evoqua Water Technologies: (Evoqua Ion Exchange Softener)
3M Purification Inc.: (3M Aqua-Pure Water Softener)
Pentair PLC: (Pentair Fleck 5600SXT)
A.O. Smith Corporation:(A.O. Smith Water Softening Systems)
Whirlpool Corporation (Whirlpool WHES40E Water Softener)
Vaillant Group: (Vaillant aquatec Soft VSC)
Honeywell International Inc.: (Honeywell Smart Home Water Softener)
Siemens AG: (Siemens AQUAtech Softening Systems)
WaterBoss Inc.: (WaterBoss 700 Water Softener)
Veolia Water Technologies: (Veolia Ionsoft Water Softener)
Hydrotech Water Softening Systems: (Hydrotech 89 Series)
In February 2023: A.O. Smith Corporation introduced Aquasana OptimH2O Whole House Water Softener, a new water softening system that is intended to remove more hardness minerals than prior systems.
In June 2023: Culligan Water, introduced the first AI WatereBot, Cullie. The water industry trailblazer innovated this technology by using ChatGpt's conversational abilities to enhance website interactions.
Report Attributes | Details |
---|---|
Market Size in 2023 | USD 2.91 Billion |
Market Size by 2032 | USD 5.31 Billion |
CAGR | CAGR of 6.9% From 2024 to 2032 |
Base Year | 2023 |
Forecast Period | 2024-2032 |
Historical Data | 2020-2022 |
Report Scope & Coverage | Market Size, Segments Analysis, Competitive Landscape, Regional Analysis, DROC & SWOT Analysis, Forecast Outlook |
Key Segments | • By Type (Salt Based, Salt Free) • By Application (Residential, Commercial, Industrial) • By Process (Ion Exchange, Distillation, Reverse Osmosis) |
Regional Analysis/Coverage | North America (US, Canada, Mexico), Europe (Eastern Europe [Poland, Romania, Hungary, Turkey, Rest of Eastern Europe] Western Europe] Germany, France, UK, Italy, Spain, Netherlands, Switzerland, Austria, Rest of Western Europe]), Asia Pacific (China, India, Japan, South Korea, Vietnam, Singapore, Australia, Rest of Asia Pacific), Middle East & Africa (Middle East [UAE, Egypt, Saudi Arabia, Qatar, Rest of Middle East], Africa [Nigeria, South Africa, Rest of Africa], Latin America (Brazil, Argentina, Colombia, Rest of Latin America) |
Company Profiles | Marlo Incorporated, Kinetico Incorporated, EcoWater Systems LLC, Culligan, International Company, General Electric Company, Canature Environmental Products Co., Ltd, Harvey Water Softeners Ltd, Pelican Water Systems, BWT AG, Evoqua Water Technologies,3M Purification Inc,Pentair PLC, A.O. Smith Corporation, Whirlpool Corporation , Vaillant Group, Honeywell International Inc, Siemens AG, WaterBoss Inc, Veolia Water Technologies, Hydrotech Water Softening Systems |
Key Drivers | • The rising awareness of hard water's detrimental effects on health and appliances is fueling consumer demand for water softening systems to enhance overall water quality. • Technological advancements in water softening, like salt-free systems and reverse osmosis, improve efficiency and cater to eco-conscious consumers seeking sustainable water treatment solutions. |
RESTRAINTS | • Growing awareness of the health risks and damage caused by hard water drives consumers to seek effective water softening solutions to enhance water quality. |
Ans: The Water Softening Systems Market is expected to grow at a CAGR of 6.9% Over the Forecast period of 2024-2032.
Ans: Water Softening Systems Market size was USD 2.91 Billion in 2023 and is expected to Reach USD 5.31 Billion by 2032.
Ans: Salt Based segmentation is the dominating segment By Type in the Water Softening Systems Market.
Ans: The rising awareness of hard water's detrimental effects on health and appliances is fueling consumer demand for water softening systems to enhance overall water quality.
Ans: North America is the dominating region in the Water Softening Systems Market.
TABLE OF CONTENTS
1. Introduction
1.1 Market Definition
1.2 Scope (Inclusion and Exclusions)
1.3 Research Assumptions
2. Executive Summary
2.1 Market Overview
2.2 Regional Synopsis
2.3 Competitive Summary
3. Research Methodology
3.1 Top-Down Approach
3.2 Bottom-up Approach
3.3. Data Validation
3.4 Primary Interviews
4. Market Dynamics Impact Analysis
4.1 Market Driving Factors Analysis
4.1.1 Drivers
4.1.2 Restraints
4.1.3 Opportunities
4.1.4 Challenges
4.2 PESTLE Analysis
4.3 Porter’s Five Forces Model
5. Statistical Insights and Trends Reporting
5.1 Manufacturing Output, by region, (2020-2023)
5.2 Utilization Rates, by region, (2020-2023)
5.3 Maintenance and Downtime Metrix
5.4 Technological Adoption Rates, by region
5.6 Export/Import Data, by region (2023)
6. Competitive Landscape
6.1 List of Major Companies, By Region
6.2 Market Share Analysis, By Region
6.3 Product Benchmarking
6.3.1 Product specifications and features
6.3.2 Pricing
6.4 Strategic Initiatives
6.4.1 Marketing and promotional activities
6.4.2 Distribution and supply chain strategies
6.4.3 Expansion plans and new product launches
6.4.4 Strategic partnerships and collaborations
6.5 Technological Advancements
6.6 Market Positioning and Branding
7. Water Softening Systems Market Segmentation, By Type
7.1 Chapter Overview
7.2 Salt Based
7.2.1 Salt Based Market Trends Analysis (2020-2032)
7.2.2 Salt Based Market Size Estimates and Forecasts to 2032 (USD Billion)
7.3 Salt Free
7.3.1 Salt Free Market Trends Analysis (2020-2032)
7.3.2 Salt Free Market Size Estimates and Forecasts to 2032 (USD Billion)
8. Water Softening Systems Market Segmentation, By Application
8.1 Chapter Overview
8.2 Residential
8.2.1 Residential Market Trends Analysis (2020-2032)
8.2.2 Residential Market Size Estimates and Forecasts to 2032 (USD Billion)
8.3 Commercial
8.3.1 Commercial Market Trends Analysis (2020-2032)
8.3.2 Commercial Market Size Estimates and Forecasts to 2032 (USD Billion)
8.4 Industrial
8.4.1 Industrial Market Trends Analysis (2020-2032)
8.4.2 Industrial Market Size Estimates and Forecasts to 2032 (USD Billion)
9. Water Softening Systems Market Segmentation, By Process
9.1 Chapter Overview
9.2 Ion Exchange
9.2.1 Ion Exchange Market Trends Analysis (2020-2032)
9.2.2 Ion Exchange Market Size Estimates and Forecasts to 2032 (USD Billion)
9.3 Distillation
9.3.1 Distillation Market Trends Analysis (2020-2032)
9.3.2 Distillation Market Size Estimates and Forecasts to 2032 (USD Billion)
9.4 Reverse Osmosis
9.4.1 Reverse Osmosis Market Trends Analysis (2020-2032)
9.4.2 Reverse Osmosis Market Size Estimates and Forecasts to 2032 (USD Billion)
10. Regional Analysis
10.1 Chapter Overview
10.2 North America
10.2.1 Trends Analysis
10.2.2 North America Water Softening Systems Market Estimates and Forecasts, by Country (2020-2032) (USD Billion)
10.2.3 North America Water Softening Systems Market Estimates and Forecasts, By Type (2020-2032) (USD Billion)
10.2.4 North America Water Softening Systems Market Estimates and Forecasts, By Application (2020-2032) (USD Billion)
10.2.5 North America Water Softening Systems Market Estimates and Forecasts, By Process (2020-2032) (USD Billion)
10.2.6 USA
10.2.6.1 USA Water Softening Systems Market Estimates and Forecasts, By Type (2020-2032) (USD Billion)
10.2.6.2 USA Water Softening Systems Market Estimates and Forecasts, By Application (2020-2032) (USD Billion)
10.2.6.3 USA Water Softening Systems Market Estimates and Forecasts, By Process (2020-2032) (USD Billion)
10.2.7 Canada
10.2.7.1 Canada Water Softening Systems Market Estimates and Forecasts, By Type (2020-2032) (USD Billion)
10.2.7.2 Canada Water Softening Systems Market Estimates and Forecasts, By Application (2020-2032) (USD Billion)
10.2.7.3 Canada Water Softening Systems Market Estimates and Forecasts, By Process (2020-2032) (USD Billion)
10.2.8 Mexico
10.2.8.1 Mexico Water Softening Systems Market Estimates and Forecasts, By Type (2020-2032) (USD Billion)
10.2.8.2 Mexico Water Softening Systems Market Estimates and Forecasts, By Application (2020-2032) (USD Billion)
10.2.8.3 Mexico Water Softening Systems Market Estimates and Forecasts, By Process (2020-2032) (USD Billion)
10.3 Europe
10.3.1 Eastern Europe
10.3.1.1 Trends Analysis
10.3.1.2 Eastern Europe Water Softening Systems Market Estimates and Forecasts, by Country (2020-2032) (USD Billion)
10.3.1.3 Eastern Europe Water Softening Systems Market Estimates and Forecasts, By Type (2020-2032) (USD Billion)
10.3.1.4 Eastern Europe Water Softening Systems Market Estimates and Forecasts, By Application (2020-2032) (USD Billion)
10.3.1.5 Eastern Europe Water Softening Systems Market Estimates and Forecasts, By Process (2020-2032) (USD Billion)
10.3.1.6 Poland
10.3.1.6.1 Poland Water Softening Systems Market Estimates and Forecasts, By Type (2020-2032) (USD Billion)
10.3.1.6.2 Poland Water Softening Systems Market Estimates and Forecasts, By Application (2020-2032) (USD Billion)
10.3.1.6.3 Poland Water Softening Systems Market Estimates and Forecasts, By Process (2020-2032) (USD Billion)
10.3.1.7 Romania
10.3.1.7.1 Romania Water Softening Systems Market Estimates and Forecasts, By Type (2020-2032) (USD Billion)
10.3.1.7.2 Romania Water Softening Systems Market Estimates and Forecasts, By Application (2020-2032) (USD Billion)
10.3.1.7.3 Romania Water Softening Systems Market Estimates and Forecasts, By Process (2020-2032) (USD Billion)
10.3.1.8 Hungary
10.3.1.8.1 Hungary Water Softening Systems Market Estimates and Forecasts, By Type (2020-2032) (USD Billion)
10.3.1.8.2 Hungary Water Softening Systems Market Estimates and Forecasts, By Application (2020-2032) (USD Billion)
10.3.1.8.3 Hungary Water Softening Systems Market Estimates and Forecasts, By Process (2020-2032) (USD Billion)
10.3.1.9 Turkey
10.3.1.9.1 Turkey Water Softening Systems Market Estimates and Forecasts, By Type (2020-2032) (USD Billion)
10.3.1.9.2 Turkey Water Softening Systems Market Estimates and Forecasts, By Application (2020-2032) (USD Billion)
10.3.1.9.3 Turkey Water Softening Systems Market Estimates and Forecasts, By Process (2020-2032) (USD Billion)
10.3.1.10 Rest of Eastern Europe
10.3.1.10.1 Rest of Eastern Europe Water Softening Systems Market Estimates and Forecasts, By Type (2020-2032) (USD Billion)
10.3.1.10.2 Rest of Eastern Europe Water Softening Systems Market Estimates and Forecasts, By Application (2020-2032) (USD Billion)
10.3.1.10.3 Rest of Eastern Europe Water Softening Systems Market Estimates and Forecasts, By Process (2020-2032) (USD Billion)
10.3.2 Western Europe
10.3.2.1 Trends Analysis
10.3.2.2 Western Europe Water Softening Systems Market Estimates and Forecasts, by Country (2020-2032) (USD Billion)
10.3.2.3 Western Europe Water Softening Systems Market Estimates and Forecasts, By Type (2020-2032) (USD Billion)
10.3.2.4 Western Europe Water Softening Systems Market Estimates and Forecasts, By Application (2020-2032) (USD Billion)
10.3.2.5 Western Europe Water Softening Systems Market Estimates and Forecasts, By Process (2020-2032) (USD Billion)
10.3.2.6 Germany
10.3.2.6.1 Germany Water Softening Systems Market Estimates and Forecasts, By Type (2020-2032) (USD Billion)
10.3.2.6.2 Germany Water Softening Systems Market Estimates and Forecasts, By Application (2020-2032) (USD Billion)
10.3.2.6.3 Germany Water Softening Systems Market Estimates and Forecasts, By Process (2020-2032) (USD Billion)
10.3.2.7 France
10.3.2.7.1 France Water Softening Systems Market Estimates and Forecasts, By Type (2020-2032) (USD Billion)
10.3.2.7.2 France Water Softening Systems Market Estimates and Forecasts, By Application (2020-2032) (USD Billion)
10.3.2.7.3 France Water Softening Systems Market Estimates and Forecasts, By Process (2020-2032) (USD Billion)
10.3.2.8 UK
10.3.2.8.1 UK Water Softening Systems Market Estimates and Forecasts, By Type (2020-2032) (USD Billion)
10.3.2.8.2 UK Water Softening Systems Market Estimates and Forecasts, By Application (2020-2032) (USD Billion)
10.3.2.8.3 UK Water Softening Systems Market Estimates and Forecasts, By Process (2020-2032) (USD Billion)
10.3.2.9 Italy
10.3.2.9.1 Italy Water Softening Systems Market Estimates and Forecasts, By Type (2020-2032) (USD Billion)
10.3.2.9.2 Italy Water Softening Systems Market Estimates and Forecasts, By Application (2020-2032) (USD Billion)
10.3.2.9.3 Italy Water Softening Systems Market Estimates and Forecasts, By Process (2020-2032) (USD Billion)
10.3.2.10 Spain
10.3.2.10.1 Spain Water Softening Systems Market Estimates and Forecasts, By Type (2020-2032) (USD Billion)
10.3.2.10.2 Spain Water Softening Systems Market Estimates and Forecasts, By Application (2020-2032) (USD Billion)
10.3.2.10.3 Spain Water Softening Systems Market Estimates and Forecasts, By Process (2020-2032) (USD Billion)
10.3.2.11 Netherlands
10.3.2.11.1 Netherlands Water Softening Systems Market Estimates and Forecasts, By Type (2020-2032) (USD Billion)
10.3.2.11.2 Netherlands Water Softening Systems Market Estimates and Forecasts, By Application (2020-2032) (USD Billion)
10.3.2.11.3 Netherlands Water Softening Systems Market Estimates and Forecasts, By Process (2020-2032) (USD Billion)
10.3.2.12 Switzerland
10.3.2.12.1 Switzerland Water Softening Systems Market Estimates and Forecasts, By Type (2020-2032) (USD Billion)
10.3.2.12.2 Switzerland Water Softening Systems Market Estimates and Forecasts, By Application (2020-2032) (USD Billion)
10.3.2.12.3 Switzerland Water Softening Systems Market Estimates and Forecasts, By Process (2020-2032) (USD Billion)
10.3.2.13 Austria
10.3.2.13.1 Austria Water Softening Systems Market Estimates and Forecasts, By Type (2020-2032) (USD Billion)
10.3.2.13.2 Austria Water Softening Systems Market Estimates and Forecasts, By Application (2020-2032) (USD Billion)
10.3.2.13.3 Austria Water Softening Systems Market Estimates and Forecasts, By Process (2020-2032) (USD Billion)
10.3.2.14 Rest of Western Europe
10.3.2.14.1 Rest of Western Europe Water Softening Systems Market Estimates and Forecasts, By Type (2020-2032) (USD Billion)
10.3.2.14.2 Rest of Western Europe Water Softening Systems Market Estimates and Forecasts, By Application (2020-2032) (USD Billion)
10.3.2.14.3 Rest of Western Europe Water Softening Systems Market Estimates and Forecasts, By Process (2020-2032) (USD Billion)
10.4 Asia-Pacific
10.4.1 Trends Analysis
10.4.2 Asia-Pacific Water Softening Systems Market Estimates and Forecasts, by Country (2020-2032) (USD Billion)
10.4.3 Asia-Pacific Water Softening Systems Market Estimates and Forecasts, By Type (2020-2032) (USD Billion)
10.4.4 Asia-Pacific Water Softening Systems Market Estimates and Forecasts, By Application (2020-2032) (USD Billion)
10.4.5 Asia-Pacific Water Softening Systems Market Estimates and Forecasts, By Process (2020-2032) (USD Billion)
10.4.6 China
10.4.6.1 China Water Softening Systems Market Estimates and Forecasts, By Type (2020-2032) (USD Billion)
10.4.6.2 China Water Softening Systems Market Estimates and Forecasts, By Application (2020-2032) (USD Billion)
10.4.6.3 China Water Softening Systems Market Estimates and Forecasts, By Process (2020-2032) (USD Billion)
10.4.7 India
10.4.7.1 India Water Softening Systems Market Estimates and Forecasts, By Type (2020-2032) (USD Billion)
10.4.7.2 India Water Softening Systems Market Estimates and Forecasts, By Application (2020-2032) (USD Billion)
10.4.7.3 India Water Softening Systems Market Estimates and Forecasts, By Process (2020-2032) (USD Billion)
10.4.8 Japan
10.4.8.1 Japan Water Softening Systems Market Estimates and Forecasts, By Type (2020-2032) (USD Billion)
10.4.8.2 Japan Water Softening Systems Market Estimates and Forecasts, By Application (2020-2032) (USD Billion)
10.4.8.3 Japan Water Softening Systems Market Estimates and Forecasts, By Process (2020-2032) (USD Billion)
10.4.9 South Korea
10.4.9.1 South Korea Water Softening Systems Market Estimates and Forecasts, By Type (2020-2032) (USD Billion)
10.4.9.2 South Korea Water Softening Systems Market Estimates and Forecasts, By Application (2020-2032) (USD Billion)
10.4.9.3 South Korea Water Softening Systems Market Estimates and Forecasts, By Process (2020-2032) (USD Billion)
10.4.10 Vietnam
10.4.10.1 Vietnam Water Softening Systems Market Estimates and Forecasts, By Type (2020-2032) (USD Billion)
10.4.10.2 Vietnam Water Softening Systems Market Estimates and Forecasts, By Application (2020-2032) (USD Billion)
10.4.10.3 Vietnam Water Softening Systems Market Estimates and Forecasts, By Process (2020-2032) (USD Billion)
10.4.11 Singapore
10.4.11.1 Singapore Water Softening Systems Market Estimates and Forecasts, By Type (2020-2032) (USD Billion)
10.4.11.2 Singapore Water Softening Systems Market Estimates and Forecasts, By Application (2020-2032) (USD Billion)
10.4.11.3 Singapore Water Softening Systems Market Estimates and Forecasts, By Process (2020-2032) (USD Billion)
10.4.12 Australia
10.4.12.1 Australia Water Softening Systems Market Estimates and Forecasts, By Type (2020-2032) (USD Billion)
10.4.12.2 Australia Water Softening Systems Market Estimates and Forecasts, By Application (2020-2032) (USD Billion)
10.4.12.3 Australia Water Softening Systems Market Estimates and Forecasts, By Process (2020-2032) (USD Billion)
10.4.13 Rest of Asia-Pacific
10.4.13.1 Rest of Asia-Pacific Water Softening Systems Market Estimates and Forecasts, By Type (2020-2032) (USD Billion)
10.4.13.2 Rest of Asia-Pacific Water Softening Systems Market Estimates and Forecasts, By Application (2020-2032) (USD Billion)
10.4.13.3 Rest of Asia-Pacific Water Softening Systems Market Estimates and Forecasts, By Process (2020-2032) (USD Billion)
10.5 Middle East and Africa
10.5.1 Middle East
10.5.1.1 Trends Analysis
10.5.1.2 Middle East Water Softening Systems Market Estimates and Forecasts, by Country (2020-2032) (USD Billion)
10.5.1.3 Middle East Water Softening Systems Market Estimates and Forecasts, By Type (2020-2032) (USD Billion)
10.5.1.4 Middle East Water Softening Systems Market Estimates and Forecasts, By Application (2020-2032) (USD Billion)
10.5.1.5 Middle East Water Softening Systems Market Estimates and Forecasts, By Process (2020-2032) (USD Billion)
10.5.1.6 UAE
10.5.1.6.1 UAE Water Softening Systems Market Estimates and Forecasts, By Type (2020-2032) (USD Billion)
10.5.1.6.2 UAE Water Softening Systems Market Estimates and Forecasts, By Application (2020-2032) (USD Billion)
10.5.1.6.3 UAE Water Softening Systems Market Estimates and Forecasts, By Process (2020-2032) (USD Billion)
10.5.1.7 Egypt
10.5.1.7.1 Egypt Water Softening Systems Market Estimates and Forecasts, By Type (2020-2032) (USD Billion)
10.5.1.7.2 Egypt Water Softening Systems Market Estimates and Forecasts, By Application (2020-2032) (USD Billion)
10.5.1.7.3 Egypt Water Softening Systems Market Estimates and Forecasts, By Process (2020-2032) (USD Billion)
10.5.1.8 Saudi Arabia
10.5.1.8.1 Saudi Arabia Water Softening Systems Market Estimates and Forecasts, By Type (2020-2032) (USD Billion)
10.5.1.8.2 Saudi Arabia Water Softening Systems Market Estimates and Forecasts, By Application (2020-2032) (USD Billion)
10.5.1.8.3 Saudi Arabia Water Softening Systems Market Estimates and Forecasts, By Process (2020-2032) (USD Billion)
10.5.1.9 Qatar
10.5.1.9.1 Qatar Water Softening Systems Market Estimates and Forecasts, By Type (2020-2032) (USD Billion)
10.5.1.9.2 Qatar Water Softening Systems Market Estimates and Forecasts, By Application (2020-2032) (USD Billion)
10.5.1.9.3 Qatar Water Softening Systems Market Estimates and Forecasts, By Process (2020-2032) (USD Billion)
10.5.1.10 Rest of Middle East
10.5.1.10.1 Rest of Middle East Water Softening Systems Market Estimates and Forecasts, By Type (2020-2032) (USD Billion)
10.5.1.10.2 Rest of Middle East Water Softening Systems Market Estimates and Forecasts, By Application (2020-2032) (USD Billion)
10.5.1.10.3 Rest of Middle East Water Softening Systems Market Estimates and Forecasts, By Process (2020-2032) (USD Billion)
10.5.2 Africa
10.5.2.1 Trends Analysis
10.5.2.2 Africa Water Softening Systems Market Estimates and Forecasts, by Country (2020-2032) (USD Billion)
10.5.2.3 Africa Water Softening Systems Market Estimates and Forecasts, By Type (2020-2032) (USD Billion)
10.5.2.4 Africa Water Softening Systems Market Estimates and Forecasts, By Application (2020-2032) (USD Billion)
10.5.2.5 Africa Water Softening Systems Market Estimates and Forecasts, By Process (2020-2032) (USD Billion)
10.5.2.6 South Africa
10.5.2.6.1 South Africa Water Softening Systems Market Estimates and Forecasts, By Type (2020-2032) (USD Billion)
10.5.2.6.2 South Africa Water Softening Systems Market Estimates and Forecasts, By Application (2020-2032) (USD Billion)
10.5.2.6.3 South Africa Water Softening Systems Market Estimates and Forecasts, By Process (2020-2032) (USD Billion)
10.5.2.7 Nigeria
10.5.2.7.1 Nigeria Water Softening Systems Market Estimates and Forecasts, By Type (2020-2032) (USD Billion)
10.5.2.7.2 Nigeria Water Softening Systems Market Estimates and Forecasts, By Application (2020-2032) (USD Billion)
10.5.2.7.3 Nigeria Water Softening Systems Market Estimates and Forecasts, By Process (2020-2032) (USD Billion)
10.5.2.8 Rest of Africa
10.5.2.8.1 Rest of Africa Water Softening Systems Market Estimates and Forecasts, By Type (2020-2032) (USD Billion)
10.5.2.8.2 Rest of Africa Water Softening Systems Market Estimates and Forecasts, By Application (2020-2032) (USD Billion)
10.5.2.8.3 Rest of Africa Water Softening Systems Market Estimates and Forecasts, By Process (2020-2032) (USD Billion)
10.6 Latin America
10.6.1 Trends Analysis
10.6.2 Latin America Water Softening Systems Market Estimates and Forecasts, by Country (2020-2032) (USD Billion)
10.6.3 Latin America Water Softening Systems Market Estimates and Forecasts, By Type (2020-2032) (USD Billion)
10.6.4 Latin America Water Softening Systems Market Estimates and Forecasts, By Application (2020-2032) (USD Billion)
10.6.5 Latin America Water Softening Systems Market Estimates and Forecasts, By Process (2020-2032) (USD Billion)
10.6.6 Brazil
10.6.6.1 Brazil Water Softening Systems Market Estimates and Forecasts, By Type (2020-2032) (USD Billion)
10.6.6.2 Brazil Water Softening Systems Market Estimates and Forecasts, By Application (2020-2032) (USD Billion)
10.6.6.3 Brazil Water Softening Systems Market Estimates and Forecasts, By Process (2020-2032) (USD Billion)
10.6.7 Argentina
10.6.7.1 Argentina Water Softening Systems Market Estimates and Forecasts, By Type (2020-2032) (USD Billion)
10.6.7.2 Argentina Water Softening Systems Market Estimates and Forecasts, By Application (2020-2032) (USD Billion)
10.6.7.3 Argentina Water Softening Systems Market Estimates and Forecasts, By Process (2020-2032) (USD Billion)
10.6.8 Colombia
10.6.8.1 Colombia Water Softening Systems Market Estimates and Forecasts, By Type (2020-2032) (USD Billion)
10.6.8.2 Colombia Water Softening Systems Market Estimates and Forecasts, By Application (2020-2032) (USD Billion)
10.6.8.3 Colombia Water Softening Systems Market Estimates and Forecasts, By Process (2020-2032) (USD Billion)
10.6.9 Rest of Latin America
10.6.9.1 Rest of Latin America Water Softening Systems Market Estimates and Forecasts, By Type (2020-2032) (USD Billion)
10.6.9.2 Rest of Latin America Water Softening Systems Market Estimates and Forecasts, By Application (2020-2032) (USD Billion)
10.6.9.3 Rest of Latin America Water Softening Systems Market Estimates and Forecasts, By Process (2020-2032) (USD Billion)
11. Company Profiles
11.1 Marlo Incorporated
11.1.1 Company Overview
11.1.2 Financial
11.1.3 Products/ Services Offered
11.1.4 SWOT Analysis
11.2 Kinetico Incorporated
11.2.1 Company Overview
11.2.2 Financial
11.2.3 Products/ Services Offered
11.2.4 SWOT Analysis
11.3 EcoWater Systems LLC
11.3.1 Company Overview
11.3.2 Financial
11.3.3 Products/ Services Offered
11.3.4 SWOT Analysis
11.4 Culligan
11.4.1 Company Overview
11.4.2 Financial
11.4.3 Products/ Services Offered
11.4.4 SWOT Analysis
11.5 International Company
11.5.1 Company Overview
11.5.2 Financial
11.5.3 Products/ Services Offered
11.5.4 SWOT Analysis
11.6 General Electric Company
11.6.1 Company Overview
11.6.2 Financial
11.6.3 Products/ Services Offered
11.6.4 SWOT Analysis
11.7 Canature Environmental Products Co., Ltd
11.7.1 Company Overview
11.7.2 Financial
11.7.3 Products/ Services Offered
11.7.4 SWOT Analysis
11.8 P Harvey Water Softeners Ltd
11.8.1 Company Overview
11.8.2 Financial
11.8.3 Products/ Services Offered
11.8.4 SWOT Analysis
11.9 Pelican Water Systems
11.9.1 Company Overview
11.9.2 Financial
11.9.3 Products/ Services Offered
11.9.4 SWOT Analysis
11.10 BWT AG
11.10.1 Company Overview
11.10.2 Financial
11.10.3 Products/ Services Offered
11.10.4 SWOT Analysis
12. Use Cases and Best Practices
13. Conclusion
An accurate research report requires proper strategizing as well as implementation. There are multiple factors involved in the completion of good and accurate research report and selecting the best methodology to compete the research is the toughest part. Since the research reports we provide play a crucial role in any company’s decision-making process, therefore we at SNS Insider always believe that we should choose the best method which gives us results closer to reality. This allows us to reach at a stage wherein we can provide our clients best and accurate investment to output ratio.
Each report that we prepare takes a timeframe of 350-400 business hours for production. Starting from the selection of titles through a couple of in-depth brain storming session to the final QC process before uploading our titles on our website we dedicate around 350 working hours. The titles are selected based on their current market cap and the foreseen CAGR and growth.
The 5 steps process:
Step 1: Secondary Research:
Secondary Research or Desk Research is as the name suggests is a research process wherein, we collect data through the readily available information. In this process we use various paid and unpaid databases which our team has access to and gather data through the same. This includes examining of listed companies’ annual reports, Journals, SEC filling etc. Apart from this our team has access to various associations across the globe across different industries. Lastly, we have exchange relationships with various university as well as individual libraries.
Step 2: Primary Research
When we talk about primary research, it is a type of study in which the researchers collect relevant data samples directly, rather than relying on previously collected data. This type of research is focused on gaining content specific facts that can be sued to solve specific problems. Since the collected data is fresh and first hand therefore it makes the study more accurate and genuine.
We at SNS Insider have divided Primary Research into 2 parts.
Part 1 wherein we interview the KOLs of major players as well as the upcoming ones across various geographic regions. This allows us to have their view over the market scenario and acts as an important tool to come closer to the accurate market numbers. As many as 45 paid and unpaid primary interviews are taken from both the demand and supply side of the industry to make sure we land at an accurate judgement and analysis of the market.
This step involves the triangulation of data wherein our team analyses the interview transcripts, online survey responses and observation of on filed participants. The below mentioned chart should give a better understanding of the part 1 of the primary interview.
Part 2: In this part of primary research the data collected via secondary research and the part 1 of the primary research is validated with the interviews from individual consultants and subject matter experts.
Consultants are those set of people who have at least 12 years of experience and expertise within the industry whereas Subject Matter Experts are those with at least 15 years of experience behind their back within the same space. The data with the help of two main processes i.e., FGDs (Focused Group Discussions) and IDs (Individual Discussions). This gives us a 3rd party nonbiased primary view of the market scenario making it a more dependable one while collation of the data pointers.
Step 3: Data Bank Validation
Once all the information is collected via primary and secondary sources, we run that information for data validation. At our intelligence centre our research heads track a lot of information related to the market which includes the quarterly reports, the daily stock prices, and other relevant information. Our data bank server gets updated every fortnight and that is how the information which we collected using our primary and secondary information is revalidated in real time.
Step 4: QA/QC Process
After all the data collection and validation our team does a final level of quality check and quality assurance to get rid of any unwanted or undesired mistakes. This might include but not limited to getting rid of the any typos, duplication of numbers or missing of any important information. The people involved in this process include technical content writers, research heads and graphics people. Once this process is completed the title gets uploader on our platform for our clients to read it.
Step 5: Final QC/QA Process:
This is the last process and comes when the client has ordered the study. In this process a final QA/QC is done before the study is emailed to the client. Since we believe in giving our clients a good experience of our research studies, therefore, to make sure that we do not lack at our end in any way humanly possible we do a final round of quality check and then dispatch the study to the client.
Key Segments
By Type
Salt Based
Salt Free
By Application
Residential
Commercial
Industrial
By Process
Ion Exchange
Distillation
Reverse Osmosis
Request for Segment Customization as per your Business Requirement: Segment Customization Request
Regional Coverage
North America
US
Canada
Mexico
Europe
Eastern Europe
Poland
Romania
Hungary
Turkey
Rest of Eastern Europe
Western Europe
Germany
France
UK
Italy
Spain
Netherlands
Switzerland
Austria
Rest of Western Europe
Asia Pacific
China
India
Japan
South Korea
Vietnam
Singapore
Australia
Rest of Asia Pacific
Middle East & Africa
Middle East
UAE
Egypt
Saudi Arabia
Qatar
Rest of the Middle East
Africa
Nigeria
South Africa
Rest of Africa
Latin America
Brazil
Argentina
Colombia
Rest of Latin America
Request for Country Level Research Report: Country Level Customization Request
Available Customization
With the given market data, SNS Insider offers customization as per the company’s specific needs. The following customization options are available for the report:
Product Analysis
Criss-Cross segment analysis (e.g. Product X Application)
Product Matrix which gives a detailed comparison of product portfolio of each company
Geographic Analysis
Additional countries in any of the regions
Company Information
Detailed analysis and profiling of additional market players (Up to five)
The Oilfield Equipment Market Size was esteemed at USD 125.97 billion in 2023 and is supposed to arrive at USD 173.86 billion by 2031 with a growing CAGR of 4.11% over the forecast period 2024-2031.
The Ductless Heating and cooling Systems Market Size was esteemed at USD 116.11 billion in 2023 and is supposed to arrive at USD 230.81 billion by 2031 with a growing CAGR of 8.97% over the forecast period 2024-2031.
The Logistics Robots Market size was valued at USD 8.39 billion in 2023 and is expected to reach USD 33.08 billion by 2032 and grow at a CAGR of 16.47% over the forecast period 2024-2032.
The Air conditioning System Market size was valued at USD 116.50 Billion in 2023. It is expected to grow to USD 285.65 Billion by 2032 and grow at a CAGR of 10.50 % over the forecast period of 2024-2032.
The Stone Crushing Equipment Market Size was valued at USD 6.34 billion in 2023 and is estimated to reach USD 12.46 billion by 2032 with a growing CAGR of 7.8% over the forecast period 2024-2032.
The Diaphragm Pump Market size was valued at USD 6.41 billion in 2023 and is expected to grow to USD 9.1 billion by 2031 and grow at a CAGR of 4.35 % over the forecast period of 2024-2031.
Hi! Click one of our member below to chat on Phone