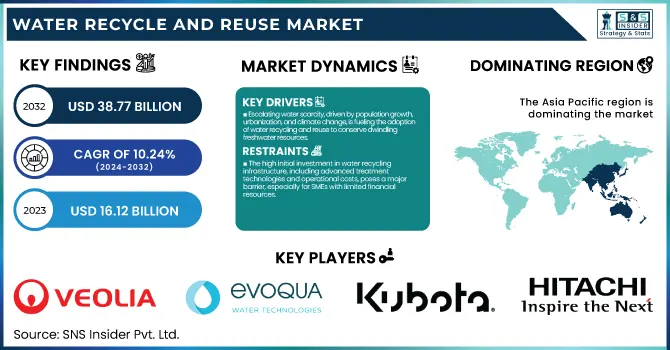
The Water Recycle and Reuse Market Size was esteemed at USD 16.12 billion in 2023 and is supposed to arrive at USD 38.77 billion by 2032 with a growing CAGR of 10.24% over the forecast period 2024-2032. The Water Recycle and Reuse Market report offers a distinctive focus on technological advancements, highlighting the integration of IoT and smart water management systems that enhance real-time monitoring and efficiency. It also emphasizes the growing adoption of membrane filtration technologies, such as reverse osmosis and ultrafiltration, which are pivotal in producing high-quality recycled water. Additionally, the report sheds light on the increasing implementation of circular economy principles, promoting closed-loop water systems to minimize waste and environmental impact. These insights underscore the market's response to escalating water scarcity and the need for sustainable water management solutions.
To Get more information on Water Recycle and Reuse Market - Request Free Sample Report
Drivers
Escalating water scarcity, driven by population growth, urbanization, and climate change, is fueling the adoption of water recycling and reuse to conserve dwindling freshwater resources.
Escalating water scarcity is a critical global challenge driven by rapid population growth, urbanization, and climate change. With cities growing larger and larger, urbanization has only added to the problem of growing demand for water and the creation of wastewater. Climate change compounds the crisis by changing patterns of precipitation, spurring extended periods of drought, and reducing supplies of freshwater. As a result, it has established the need for sustainable water management solutions, for example, water recycling and reuse. Advanced treatment technologies allow for the reclamation and reuse of wastewater by industries, municipalities, and agriculture, reducing downstream dependency on conventional sources. Countries that experience chronic water shortages countries in the Middle East, California, and parts of Asia are investing in large-scale recycling systems to help alleviate water stress.
Restraint
The high initial investment in water recycling infrastructure, including advanced treatment technologies and operational costs, poses a major barrier, especially for SMEs with limited financial resources.
The high initial investment required for water recycling and reuse systems remains a major challenge, particularly for small and medium-sized enterprises (SMEs). Building treatment facilities, pipelines, and new filtration technologies like reverse osmosis and ultrafiltration require significant capital expenditure. Moreover, the financial burden is exacerbated by operational costs such as energy consumption and maintenance. The reluctance to adopt these systems in many industries is due to long payback periods and uncertainty over return on investment. Large organizations can write off these costs, whereas SMEs often live hand to mouth, with limited access to funding. Government incentives and subsidies can step in to ease this burden, but regulations and the absence of a standardized policy framework across regions can delay the initiation of solutions. The upfront financial commitment required to deploy water recycling infrastructure, though, continues to inhibit widespread adoption, particularly in cost-sensitive markets, despite the long-term water conservation benefits and regulatory compliance incentives.
Opportunities
Industries like manufacturing, power generation, and agriculture are adopting water recycling to reduce costs, meet regulations, and enhance sustainability.
Industries such as manufacturing, power generation, and agriculture are among the largest consumers of water, making efficient water management critical for sustainability and cost reduction. Water recycling and reuse solutions present a pathway to reduce reliance on freshwater sources and mitigate wastewater disposal. In the manufacturing sector, advanced filtration and treatment technologies facilitate process water reuse which reduces operational costs and enables adherence to strict environmental regulations. Thermal energy plants use recycled water to help cool the plants, easing the pressure on municipal water systems. Likewise, treated wastewater is increasingly repurposed for irrigation, conserving freshwater resources and improving crop resilience in arid regions, particularly in agriculture. Regulatory pressures and corporate sustainability initiatives are driving industries to develop closed-loop water systems through innovative treatment solutions like membrane filtration, reverse osmosis, and advanced oxidation. Not only does this improve environmental stewardship but it also develops long-term operational efficiency.
Challenges
Regulatory variability creates compliance challenges for companies, requiring adaptable solutions to meet differing water recycling standards across regions.
Regulatory variability in the Water Recycle and Reuse Market presents a significant challenge for companies navigating multiple jurisdictions. There are various water quality standards, treatment requirements, and compliance protocols in different countries and even regions within a country. It also makes it much more challenging to adopt standardized recycling technologies and operating procedures, unnecessarily driving up costs and administration for businesses. For instance, in some countries, strict water treatment before reuse is required, while in others, guidelines are more lenient, making it difficult for companies to develop systems that can be used across the board. Additionally, changes in regulation and environmental policies are constantly evolving, and businesses must adapt accordingly to stay compliant. These discrepancies can delay adoption rates for corporations, and businesses need flexible water treatment solutions backed by legal expertise to navigate this issue. All possible, but they would require some degree of collaboration between governments and industry stakeholders to ensure that regulations are harmonized and that best practices are shared, to pave the way for cross-border initiatives to use treated wastewater sustainably.
By Equipment
The Filtration segment dominated with a market share of over 38% in 2023, owing to its instrumental role in removing impurities and maintaining water quality before reuse. Common filtration technologies such as reverse osmosis (RO), ultrafiltration (UF), and activated carbon filtration punctuate the industrial, municipal, and commercial landscapes. These systems include physical, chemical, and biological processes that reduce dissolved solids, microorganisms, chemicals, or any other industrial contaminant to allow the reuse of water for manufacturing, irrigation, and portable applications. The increasing focus on sustainable water management, strict environment legislation, and seamless filtration replacement with advanced membrane techniques are some of the key factors driving filtration demand. The need is clear: with industries and municipalities prioritizing water conservation, high-efficiency filtration systems will continue to be the best solution for effective and low-energy cost treatment of water.
By Capacity
The >100,001 L segment dominated with a market share of over 34% in 2023, due to its widespread adoption in large-scale industrial facilities, municipal water treatment plants, and commercial establishments. These systems play a vital role in handling large quantities of waste water, making sure that you can efficiently reuse the water from these systems without crossing the line that is defined by stringent environmental regulations. Large-scale water recycling is essential in industries including, but not limited to, power generation, pharmaceuticals, and chemicals to maximize resource utilization and minimize freshwater dependency. Increasing urbanization and growing population have further increased the demand for municipal wastewater treatment, which is boosting this segment as well. As governments tighten up water conservation rules globally, investments are being made in large-capacity treatment plants.
By End-use industry
The Industrial segment dominated with a market share of over 48% in 2023, due to its extensive water usage and stringent regulatory requirements. Sectors like manufacturing, power generation, oil & gas, and chemicals need substantial amounts of water for their operations, cooling, and processing as the threat of water scarcity increases and the costs of wastewater disposal rise, industries are increasingly adding advanced water recycling technologies such as membrane filtration, reverse osmosis and UV disinfection to their infrastructures. Various government regulations and sustainability measures are also forcing industries to provide efficient water management solutions. The movement toward lowering freshwater consumption, lessening environmental impact, and lowering expenditure also helps explain why the industrial sector holds a leading proportion of the market size and is one of the biggest players augmenting demand for water recycling solutions.
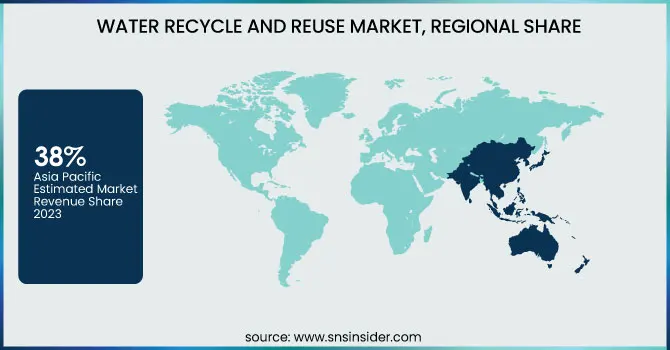
Asia-Pacific region dominated with a market share of over 38% in 2023, owing to rapid industrialization, rising urbanization, and high-water consumption in major countries (e.g. India, China, Japan) in the region. Leading adopters include China, India, and Japan where rising water scarcity and the implementation of increasingly tough government regulations to encourage sustainable water management are driving growth. Growing demand from the textile, pharmaceutical, power generation, and manufacturing industries have also driven the market. Many governments in the region encourage wastewater treatment and reuse through policies, subsidies and investment programs. Egypt’s Water Pollution Prevention Action Plan and India’s National Water Mission are examples of efforts to increase water sustainability. In addition, membrane filtration, reverse osmosis, and UV disinfection technology have made water recycling systems more efficient.
North America is the fastest-growing region in the Water Recycle and Reuse Market, driven by increasing water scarcity concerns, stringent environmental regulations, and growing investments in advanced water treatment technologies. North America (the U.S. and Canada) reigning on top of the growth as regulations in both be paired with sustainable water management. Government initiatives, including the U.S. EPA’s Water Reuse Action Plan, are accelerating the adoption of water recycling solutions across industries and municipalities. Moreover, new developments in membrane filtration, reverse osmosis, and UV disinfection are improving water reuse sustainability. Market growth is further driven by the increasing need for clean water in industries such as manufacturing, agriculture and municipal utilities. As climate change and population growth increase pressure on freshwater resources, industries and governments are responding with innovative wastewater treatment and recycling systems.
Get Customized Report as per Your Business Requirement - Enquiry Now
Some of the major key players in the Water Recycle and Reuse Market
Veolia Water Technologies (Water treatment plants, Membrane filtration)
Evoqua Water Technologies (UV disinfection, Electro-deionization)
Kubota Corporation (Membrane bioreactors, Sludge treatment systems)
SUEZ Water Technologies & Solutions (Reverse osmosis systems, Ultrafiltration)
Hitachi Ltd. (Industrial wastewater treatment, Smart water management)
Fluence Corporation Limited (Decentralized water treatment, MABR systems)
Siemens Energy (Water purification, Zero liquid discharge systems)
Dow Chemical Company (Ion exchange resins, Reverse osmosis membranes)
Alfa Laval (Wastewater separation technology, Heat exchangers)
Melbourne Water (Water recycling infrastructure, Stormwater harvesting)
Pentair (Water softeners, Filtration systems)
Xylem Inc. (Advanced oxidation, Smart water analytics)
Aquatech International (Desalination, Zero liquid discharge)
Toray Industries (Membrane filtration, Nanofiltration)
Mitsubishi Chemical Aqua Solutions (Biological treatment, Water purification)
BASF (Chemical treatment solutions, Water reuse additives)
OriginClear (Modular water treatment, Electro-coagulation)
Ovivo Inc. (Clarifiers, Membrane filtration systems)
IDE Technologies (Thermal desalination, Brine concentration)
Ecolab (Industrial water recycling, Smart monitoring solutions)
Suppliers for (Advanced water treatment solutions, including membrane-based recycling and zero liquid discharge (ZLD) systems) on the Water Recycle and Reuse Market
Veolia Water Technologies
SUEZ Water Technologies & Solutions
Ecolab (Nalco Water)
Evoqua Water Technologies
Pentair
Kurita Water Industries Ltd.
Aquatech International
Thermax Limited
Xylem Inc.
Hitachi Zosen Corporation
Recent Development
In July 2024: Xylem has committed USD 50 million to drive innovation in water technology, focusing on decarbonization, water quality, and scarcity solutions. This investment strengthens its leadership and fosters collaboration to tackle global water challenges.
In February 2024: Ovivo acquired E2metrix, a Quebec-based company specializing in electro-technologies for removing PFAS and other contaminants from water. This acquisition enhances Ovivo’s capabilities in sustainable water treatment solutions.
| Report Attributes | Details |
|---|---|
| Market Size in 2023 | USD 16.12 Billion |
| Market Size by 2032 | USD 38.77 Billion |
| CAGR | CAGR of 10.24% From 2024 to 2032 |
| Base Year | 2023 |
| Forecast Period | 2024-2032 |
| Historical Data | 2020-2022 |
| Report Scope & Coverage | Market Size, Segments Analysis, Competitive Landscape, Regional Analysis, DROC & SWOT Analysis, Forecast Outlook |
| Key Segments | • By Equipment (Filtration, Machinery, Tanks, Pipes & Drains, Others) • By Capacity (<25,000L, 25,001 TO 50,000L, 50,001L TO 100,000L, 100,001L) • By End-use Industry (Industrial, Commercial, Residential) |
| Regional Analysis/Coverage | North America (US, Canada, Mexico), Europe (Eastern Europe [Poland, Romania, Hungary, Turkey, Rest of Eastern Europe] Western Europe] Germany, France, UK, Italy, Spain, Netherlands, Switzerland, Austria, Rest of Western Europe]), Asia Pacific (China, India, Japan, South Korea, Vietnam, Singapore, Australia, Rest of Asia Pacific), Middle East & Africa (Middle East [UAE, Egypt, Saudi Arabia, Qatar, Rest of Middle East], Africa [Nigeria, South Africa, Rest of Africa], Latin America (Brazil, Argentina, Colombia, Rest of Latin America) |
| Company Profiles | Veolia Water Technologies, Evoqua Water Technologies, Kubota Corporation, SUEZ Water Technologies & Solutions, Hitachi Ltd., Fluence Corporation Limited, Siemens Energy, Dow Chemical Company, Alfa Laval, Melbourne Water, Pentair, Xylem Inc., Aquatech International, Toray Industries, Mitsubishi Chemical Aqua Solutions, BASF, OriginClear, Ovivo Inc., IDE Technologies, Ecolab. |
Ans: The Water Recycle and Reuse Market is expected to grow at a CAGR of 10.24% during 2024-2032.
Ans: The Water Recycle and Reuse Market was USD 16.12 billion in 2023 and is expected to Reach USD 38.77 billion by 2032.
Ans: Escalating water scarcity, driven by population growth, urbanization, and climate change, is fueling the adoption of water recycling and reuse to conserve dwindling freshwater resources.
Ans: The “Filtration” segment dominated the Water Recycle and Reuse Market.
Ans: Asia-Pacific dominated the Water Recycle and Reuse Market in 2023.
TABLE OF CONTENTS:
1. Introduction
1.1 Market Definition
1.2 Scope (Inclusion and Exclusions)
1.3 Research Assumptions
2. Executive Summary
2.1 Market Overview
2.2 Regional Synopsis
2.3 Competitive Summary
3. Research Methodology
3.1 Top-Down Approach
3.2 Bottom-up Approach
3.3. Data Validation
3.4 Primary Interviews
4. Market Dynamics
4.1 Market Analysis
4.1.1 Drivers
4.1.2 Restraints
4.1.3 Opportunities
4.1.4 Challenges
4.2 PESTLE Analysis
4.3 Porter’s Five Forces Model
5. Statistical Insights and Trends Reporting
5.1 Water Recycling Output, by Region (2020-2023)
5.2 Utilization Rates of Recycled Water, by Region (2020-2023)
5.3 Infrastructure Maintenance and Downtime Metrics
5.4 Technological Adoption Rates in Water Recycling, by Region
5.5 Export/Import Data of Recycled Water and Related Equipment, by Region (2023)
6. Competitive Landscape
6.1 List of Major Companies, By Region
6.2 Market Share Analysis, By Region
6.3 Product Benchmarking
6.3.1 Product specifications and features
6.3.2 Pricing
6.4 Strategic Initiatives
6.4.1 Marketing and promotional activities
6.4.2 Distribution and Supply Chain Strategies
6.4.3 Expansion plans and new product launches
6.4.4 Strategic partnerships and collaborations
6.5 Technological Advancements
6.6 Market Positioning and Branding
7. Water Recycle and Reuse Market Segmentation, By Equipment
7.1 Chapter Overview
7.2 Filtration
7.2.1 Filtration Market Trends Analysis (2020-2032)
7.2.2 Filtration Market Size Estimates and Forecasts to 2032 (USD Billion)
7.3 Machinery
7.3.1 Machinery Market Trends Analysis (2020-2032)
7.3.2 Machinery Market Size Estimates and Forecasts to 2032 (USD Billion)
7.4 Tanks
7.4.1 Tanks Market Trends Analysis (2020-2032)
7.4.2 Tanks Market Size Estimates and Forecasts to 2032 (USD Billion)
7.5 Pipes & Drains
7.5.1 Pipes & Drains Market Trends Analysis (2020-2032)
7.5.2 Pipes & Drains Market Size Estimates and Forecasts to 2032 (USD Billion)
7.6 Others
7.6.1 Others Market Trends Analysis (2020-2032)
7.6.2 Others Market Size Estimates and Forecasts to 2032 (USD Billion)
8. Water Recycle and Reuse Market Segmentation, By Capacity
8.1 Chapter Overview
8.2 <25,000L
8.2.1 <25,000L Market Trends Analysis (2020-2032)
8.2.2 <25,000L Market Size Estimates and Forecasts to 2032 (USD Billion)
8.3 25,001 TO 50,000 L
8.3.1 25,001 TO 50,000 L Market Trends Analysis (2020-2032)
8.3.2 25,001 TO 50,000 L Market Size Estimates and Forecasts to 2032 (USD Billion)
8.4 50,001 L TO 100,000 L
8.3.1 50,001 L TO 100,000 L Market Trends Analysis (2020-2032)
8.3.2 50,001 L TO 100,000 L Market Size Estimates and Forecasts to 2032 (USD Billion)
8.5 100,001 L
8.3.1 100,001 L Market Trends Analysis (2020-2032)
8.3.2 100,001 L Market Size Estimates and Forecasts to 2032 (USD Billion)
9. Water Recycle and Reuse Market Segmentation, By End-use industry
9.1 Chapter Overview
9.2 Industrial
9.2.1 Industrial Market Trends Analysis (2020-2032)
9.2.2 Industrial Market Size Estimates and Forecasts to 2032 (USD Billion)
9.3 Commercial
9.3.1 Commercial Market Trends Analysis (2020-2032)
9.3.2 Commercial Market Size Estimates and Forecasts to 2032 (USD Billion)
9.4 Residential
9.4.1 Residential Market Trends Analysis (2020-2032)
9.4.2 Residential Market Size Estimates and Forecasts to 2032 (USD Billion)
10. Regional Analysis
10.1 Chapter Overview
10.2 North America
10.2.1 Trends Analysis
10.2.2 North America Water Recycle and Reuse Market Estimates and Forecasts, by Country (2020-2032) (USD Billion)
10.2.3 North America Water Recycle and Reuse Market Estimates and Forecasts, By Equipment (2020-2032) (USD Billion)
10.2.4 North America Water Recycle and Reuse Market Estimates and Forecasts, By Capacity (2020-2032) (USD Billion)
10.2.5 North America Water Recycle and Reuse Market Estimates and Forecasts, By End-use industry (2020-2032) (USD Billion)
10.2.6 USA
10.2.6.1 USA Water Recycle and Reuse Market Estimates and Forecasts, By Equipment (2020-2032) (USD Billion)
10.2.6.2 USA Water Recycle and Reuse Market Estimates and Forecasts, By Capacity (2020-2032) (USD Billion)
10.2.6.3 USA Water Recycle and Reuse Market Estimates and Forecasts, By End-use industry (2020-2032) (USD Billion)
10.2.7 Canada
10.2.7.1 Canada Water Recycle and Reuse Market Estimates and Forecasts, By Equipment (2020-2032) (USD Billion)
10.2.7.2 Canada Water Recycle and Reuse Market Estimates and Forecasts, By Capacity (2020-2032) (USD Billion)
10.2.7.3 Canada Water Recycle and Reuse Market Estimates and Forecasts, By End-use industry (2020-2032) (USD Billion)
10.2.8 Mexico
10.2.8.1 Mexico Water Recycle and Reuse Market Estimates and Forecasts, By Equipment (2020-2032) (USD Billion)
10.2.8.2 Mexico Water Recycle and Reuse Market Estimates and Forecasts, By Capacity (2020-2032) (USD Billion)
10.2.8.3 Mexico Water Recycle and Reuse Market Estimates and Forecasts, By End-use industry (2020-2032) (USD Billion)
10.3 Europe
10.3.1 Eastern Europe
10.3.1.1 Trends Analysis
10.3.1.2 Eastern Europe Water Recycle and Reuse Market Estimates and Forecasts, by Country (2020-2032) (USD Billion)
10.3.1.3 Eastern Europe Water Recycle and Reuse Market Estimates and Forecasts, By Equipment (2020-2032) (USD Billion)
10.3.1.4 Eastern Europe Water Recycle and Reuse Market Estimates and Forecasts, By Capacity (2020-2032) (USD Billion)
10.3.1.5 Eastern Europe Water Recycle and Reuse Market Estimates and Forecasts, By End-use industry (2020-2032) (USD Billion)
10.3.1.6 Poland
10.3.1.6.1 Poland Water Recycle and Reuse Market Estimates and Forecasts, By Equipment (2020-2032) (USD Billion)
10.3.1.6.2 Poland Water Recycle and Reuse Market Estimates and Forecasts, By Capacity (2020-2032) (USD Billion)
10.3.1.6.3 Poland Water Recycle and Reuse Market Estimates and Forecasts, By End-use industry (2020-2032) (USD Billion)
10.3.1.7 Romania
10.3.1.7.1 Romania Water Recycle and Reuse Market Estimates and Forecasts, By Equipment (2020-2032) (USD Billion)
10.3.1.7.2 Romania Water Recycle and Reuse Market Estimates and Forecasts, By Capacity (2020-2032) (USD Billion)
10.3.1.7.3 Romania Water Recycle and Reuse Market Estimates and Forecasts, By End-use industry (2020-2032) (USD Billion)
10.3.1.8 Hungary
10.3.1.8.1 Hungary Water Recycle and Reuse Market Estimates and Forecasts, By Equipment (2020-2032) (USD Billion)
10.3.1.8.2 Hungary Water Recycle and Reuse Market Estimates and Forecasts, By Capacity (2020-2032) (USD Billion)
10.3.1.8.3 Hungary Water Recycle and Reuse Market Estimates and Forecasts, By End-use industry (2020-2032) (USD Billion)
10.3.1.9 Turkey
10.3.1.9.1 Turkey Water Recycle and Reuse Market Estimates and Forecasts, By Equipment (2020-2032) (USD Billion)
10.3.1.9.2 Turkey Water Recycle and Reuse Market Estimates and Forecasts, By Capacity (2020-2032) (USD Billion)
10.3.1.9.3 Turkey Water Recycle and Reuse Market Estimates and Forecasts, By End-use industry (2020-2032) (USD Billion)
10.3.1.10 Rest of Eastern Europe
10.3.1.10.1 Rest of Eastern Europe Water Recycle and Reuse Market Estimates and Forecasts, By Equipment (2020-2032) (USD Billion)
10.3.1.10.2 Rest of Eastern Europe Water Recycle and Reuse Market Estimates and Forecasts, By Capacity (2020-2032) (USD Billion)
10.3.1.10.3 Rest of Eastern Europe Water Recycle and Reuse Market Estimates and Forecasts, By End-use industry (2020-2032) (USD Billion)
10.3.2 Western Europe
10.3.2.1 Trends Analysis
10.3.2.2 Western Europe Water Recycle and Reuse Market Estimates and Forecasts, by Country (2020-2032) (USD Billion)
10.3.2.3 Western Europe Water Recycle and Reuse Market Estimates and Forecasts, By Equipment (2020-2032) (USD Billion)
10.3.2.4 Western Europe Water Recycle and Reuse Market Estimates and Forecasts, By Capacity (2020-2032) (USD Billion)
10.3.2.5 Western Europe Water Recycle and Reuse Market Estimates and Forecasts, By End-use industry (2020-2032) (USD Billion)
10.3.2.6 Germany
10.3.2.6.1 Germany Water Recycle and Reuse Market Estimates and Forecasts, By Equipment (2020-2032) (USD Billion)
10.3.2.6.2 Germany Water Recycle and Reuse Market Estimates and Forecasts, By Capacity (2020-2032) (USD Billion)
10.3.2.6.3 Germany Water Recycle and Reuse Market Estimates and Forecasts, By End-use industry (2020-2032) (USD Billion)
10.3.2.7 France
10.3.2.7.1 France Water Recycle and Reuse Market Estimates and Forecasts, By Equipment (2020-2032) (USD Billion)
10.3.2.7.2 France Water Recycle and Reuse Market Estimates and Forecasts, By Capacity (2020-2032) (USD Billion)
10.3.2.7.3 France Water Recycle and Reuse Market Estimates and Forecasts, By End-use industry (2020-2032) (USD Billion)
10.3.2.8 UK
10.3.2.8.1 UK Water Recycle and Reuse Market Estimates and Forecasts, By Equipment (2020-2032) (USD Billion)
10.3.2.8.2 UK Water Recycle and Reuse Market Estimates and Forecasts, By Capacity (2020-2032) (USD Billion)
10.3.2.8.3 UK Water Recycle and Reuse Market Estimates and Forecasts, By End-use industry (2020-2032) (USD Billion)
10.3.2.9 Italy
10.3.2.9.1 Italy Water Recycle and Reuse Market Estimates and Forecasts, By Equipment (2020-2032) (USD Billion)
10.3.2.9.2 Italy Water Recycle and Reuse Market Estimates and Forecasts, By Capacity (2020-2032) (USD Billion)
10.3.2.9.3 Italy Water Recycle and Reuse Market Estimates and Forecasts, By End-use industry (2020-2032) (USD Billion)
10.3.2.10 Spain
10.3.2.10.1 Spain Water Recycle and Reuse Market Estimates and Forecasts, By Equipment (2020-2032) (USD Billion)
10.3.2.10.2 Spain Water Recycle and Reuse Market Estimates and Forecasts, By Capacity (2020-2032) (USD Billion)
10.3.2.10.3 Spain Water Recycle and Reuse Market Estimates and Forecasts, By End-use industry (2020-2032) (USD Billion)
10.3.2.11 Netherlands
10.3.2.11.1 Netherlands Water Recycle and Reuse Market Estimates and Forecasts, By Equipment (2020-2032) (USD Billion)
10.3.2.11.2 Netherlands Water Recycle and Reuse Market Estimates and Forecasts, By Capacity (2020-2032) (USD Billion)
10.3.2.11.3 Netherlands Water Recycle and Reuse Market Estimates and Forecasts, By End-use industry (2020-2032) (USD Billion)
10.3.2.12 Switzerland
10.3.2.12.1 Switzerland Water Recycle and Reuse Market Estimates and Forecasts, By Equipment (2020-2032) (USD Billion)
10.3.2.12.2 Switzerland Water Recycle and Reuse Market Estimates and Forecasts, By Capacity (2020-2032) (USD Billion)
10.3.2.12.3 Switzerland Water Recycle and Reuse Market Estimates and Forecasts, By End-use industry (2020-2032) (USD Billion)
10.3.2.13 Austria
10.3.2.13.1 Austria Water Recycle and Reuse Market Estimates and Forecasts, By Equipment (2020-2032) (USD Billion)
10.3.2.13.2 Austria Water Recycle and Reuse Market Estimates and Forecasts, By Capacity (2020-2032) (USD Billion)
10.3.2.13.3 Austria Water Recycle and Reuse Market Estimates and Forecasts, By End-use industry (2020-2032) (USD Billion)
10.3.2.14 Rest of Western Europe
10.3.2.14.1 Rest of Western Europe Water Recycle and Reuse Market Estimates and Forecasts, By Equipment (2020-2032) (USD Billion)
10.3.2.14.2 Rest of Western Europe Water Recycle and Reuse Market Estimates and Forecasts, By Capacity (2020-2032) (USD Billion)
10.3.2.14.3 Rest of Western Europe Water Recycle and Reuse Market Estimates and Forecasts, By End-use industry (2020-2032) (USD Billion)
10.4 Asia-Pacific
10.4.1 Trends Analysis
10.4.2 Asia-Pacific Water Recycle and Reuse Market Estimates and Forecasts, by Country (2020-2032) (USD Billion)
10.4.3 Asia-Pacific Water Recycle and Reuse Market Estimates and Forecasts, By Equipment (2020-2032) (USD Billion)
10.4.4 Asia-Pacific Water Recycle and Reuse Market Estimates and Forecasts, By Capacity (2020-2032) (USD Billion)
10.4.5 Asia-Pacific Water Recycle and Reuse Market Estimates and Forecasts, By End-use industry (2020-2032) (USD Billion)
10.4.6 China
10.4.6.1 China Water Recycle and Reuse Market Estimates and Forecasts, By Equipment (2020-2032) (USD Billion)
10.4.6.2 China Water Recycle and Reuse Market Estimates and Forecasts, By Capacity (2020-2032) (USD Billion)
10.4.6.3 China Water Recycle and Reuse Market Estimates and Forecasts, By End-use industry (2020-2032) (USD Billion)
10.4.7 India
10.4.7.1 India Water Recycle and Reuse Market Estimates and Forecasts, By Equipment (2020-2032) (USD Billion)
10.4.7.2 India Water Recycle and Reuse Market Estimates and Forecasts, By Capacity (2020-2032) (USD Billion)
10.4.7.3 India Water Recycle and Reuse Market Estimates and Forecasts, By End-use industry (2020-2032) (USD Billion)
10.4.8 Japan
10.4.8.1 Japan Water Recycle and Reuse Market Estimates and Forecasts, By Equipment (2020-2032) (USD Billion)
10.4.8.2 Japan Water Recycle and Reuse Market Estimates and Forecasts, By Capacity (2020-2032) (USD Billion)
10.4.8.3 Japan Water Recycle and Reuse Market Estimates and Forecasts, By End-use industry (2020-2032) (USD Billion)
10.4.9 South Korea
10.4.9.1 South Korea Water Recycle and Reuse Market Estimates and Forecasts, By Equipment (2020-2032) (USD Billion)
10.4.9.2 South Korea Water Recycle and Reuse Market Estimates and Forecasts, By Capacity (2020-2032) (USD Billion)
10.4.9.3 South Korea Water Recycle and Reuse Market Estimates and Forecasts, By End-use industry (2020-2032) (USD Billion)
10.4.10 Vietnam
10.4.10.1 Vietnam Water Recycle and Reuse Market Estimates and Forecasts, By Equipment (2020-2032) (USD Billion)
10.4.10.2 Vietnam Water Recycle and Reuse Market Estimates and Forecasts, By Capacity (2020-2032) (USD Billion)
10.4.10.3 Vietnam Water Recycle and Reuse Market Estimates and Forecasts, By End-use industry (2020-2032) (USD Billion)
10.4.11 Singapore
10.4.11.1 Singapore Water Recycle and Reuse Market Estimates and Forecasts, By Equipment (2020-2032) (USD Billion)
10.4.11.2 Singapore Water Recycle and Reuse Market Estimates and Forecasts, By Capacity (2020-2032) (USD Billion)
10.4.11.3 Singapore Water Recycle and Reuse Market Estimates and Forecasts, By End-use industry (2020-2032) (USD Billion)
10.4.12 Australia
10.4.12.1 Australia Water Recycle and Reuse Market Estimates and Forecasts, By Equipment (2020-2032) (USD Billion)
10.4.12.2 Australia Water Recycle and Reuse Market Estimates and Forecasts, By Capacity (2020-2032) (USD Billion)
10.4.12.3 Australia Water Recycle and Reuse Market Estimates and Forecasts, By End-use industry (2020-2032) (USD Billion)
10.4.13 Rest of Asia-Pacific
10.4.13.1 Rest of Asia-Pacific Water Recycle and Reuse Market Estimates and Forecasts, By Equipment (2020-2032) (USD Billion)
10.4.13.2 Rest of Asia-Pacific Water Recycle and Reuse Market Estimates and Forecasts, By Capacity (2020-2032) (USD Billion)
10.4.13.3 Rest of Asia-Pacific Water Recycle and Reuse Market Estimates and Forecasts, By End-use industry (2020-2032) (USD Billion)
10.5 Middle East and Africa
10.5.1 Middle East
10.5.1.1 Trends Analysis
10.5.1.2 Middle East Water Recycle and Reuse Market Estimates and Forecasts, by Country (2020-2032) (USD Billion)
10.5.1.3 Middle East Water Recycle and Reuse Market Estimates and Forecasts, By Equipment (2020-2032) (USD Billion)
10.5.1.4 Middle East Water Recycle and Reuse Market Estimates and Forecasts, By Capacity (2020-2032) (USD Billion)
10.5.1.5 Middle East Water Recycle and Reuse Market Estimates and Forecasts, By End-use industry (2020-2032) (USD Billion)
10.5.1.6 UAE
10.5.1.6.1 UAE Water Recycle and Reuse Market Estimates and Forecasts, By Equipment (2020-2032) (USD Billion)
10.5.1.6.2 UAE Water Recycle and Reuse Market Estimates and Forecasts, By Capacity (2020-2032) (USD Billion)
10.5.1.6.3 UAE Water Recycle and Reuse Market Estimates and Forecasts, By End-use industry (2020-2032) (USD Billion)
10.5.1.7 Egypt
10.5.1.7.1 Egypt Water Recycle and Reuse Market Estimates and Forecasts, By Equipment (2020-2032) (USD Billion)
10.5.1.7.2 Egypt Water Recycle and Reuse Market Estimates and Forecasts, By Capacity (2020-2032) (USD Billion)
10.5.1.7.3 Egypt Water Recycle and Reuse Market Estimates and Forecasts, By End-use industry (2020-2032) (USD Billion)
10.5.1.8 Saudi Arabia
10.5.1.8.1 Saudi Arabia Water Recycle and Reuse Market Estimates and Forecasts, By Equipment (2020-2032) (USD Billion)
10.5.1.8.2 Saudi Arabia Water Recycle and Reuse Market Estimates and Forecasts, By Capacity (2020-2032) (USD Billion)
10.5.1.8.3 Saudi Arabia Water Recycle and Reuse Market Estimates and Forecasts, By End-use industry (2020-2032) (USD Billion)
10.5.1.9 Qatar
10.5.1.9.1 Qatar Water Recycle and Reuse Market Estimates and Forecasts, By Equipment (2020-2032) (USD Billion)
10.5.1.9.2 Qatar Water Recycle and Reuse Market Estimates and Forecasts, By Capacity (2020-2032) (USD Billion)
10.5.1.9.3 Qatar Water Recycle and Reuse Market Estimates and Forecasts, By End-use industry (2020-2032) (USD Billion)
10.5.1.10 Rest of Middle East
10.5.1.10.1 Rest of Middle East Water Recycle and Reuse Market Estimates and Forecasts, By Equipment (2020-2032) (USD Billion)
10.5.1.10.2 Rest of Middle East Water Recycle and Reuse Market Estimates and Forecasts, By Capacity (2020-2032) (USD Billion)
10.5.1.10.3 Rest of Middle East Water Recycle and Reuse Market Estimates and Forecasts, By End-use industry (2020-2032) (USD Billion)
10.5.2 Africa
10.5.2.1 Trends Analysis
10.5.2.2 Africa Water Recycle and Reuse Market Estimates and Forecasts, by Country (2020-2032) (USD Billion)
10.5.2.3 Africa Water Recycle and Reuse Market Estimates and Forecasts, By Equipment (2020-2032) (USD Billion)
10.5.2.4 Africa Water Recycle and Reuse Market Estimates and Forecasts, By Capacity (2020-2032) (USD Billion)
10.5.2.5 Africa Water Recycle and Reuse Market Estimates and Forecasts, By End-use industry (2020-2032) (USD Billion)
10.5.2.6 South Africa
10.5.2.6.1 South Africa Water Recycle and Reuse Market Estimates and Forecasts, By Equipment (2020-2032) (USD Billion)
10.5.2.6.2 South Africa Water Recycle and Reuse Market Estimates and Forecasts, By Capacity (2020-2032) (USD Billion)
10.5.2.6.3 South Africa Water Recycle and Reuse Market Estimates and Forecasts, By End-use industry (2020-2032) (USD Billion)
10.5.2.7 Nigeria
10.5.2.7.1 Nigeria Water Recycle and Reuse Market Estimates and Forecasts, By Equipment (2020-2032) (USD Billion)
10.5.2.7.2 Nigeria Water Recycle and Reuse Market Estimates and Forecasts, By Capacity (2020-2032) (USD Billion)
10.5.2.7.3 Nigeria Water Recycle and Reuse Market Estimates and Forecasts, By End-use industry (2020-2032) (USD Billion)
10.5.2.8 Rest of Africa
10.5.2.8.1 Rest of Africa Water Recycle and Reuse Market Estimates and Forecasts, By Equipment (2020-2032) (USD Billion)
10.5.2.8.2 Rest of Africa Water Recycle and Reuse Market Estimates and Forecasts, By Capacity (2020-2032) (USD Billion)
10.5.2.8.3 Rest of Africa Water Recycle and Reuse Market Estimates and Forecasts, By End-use industry (2020-2032) (USD Billion)
10.6 Latin America
10.6.1 Trends Analysis
10.6.2 Latin America Water Recycle and Reuse Market Estimates and Forecasts, by Country (2020-2032) (USD Billion)
10.6.3 Latin America Water Recycle and Reuse Market Estimates and Forecasts, By Equipment (2020-2032) (USD Billion)
10.6.4 Latin America Water Recycle and Reuse Market Estimates and Forecasts, By Capacity (2020-2032) (USD Billion)
10.6.5 Latin America Water Recycle and Reuse Market Estimates and Forecasts, By End-use industry (2020-2032) (USD Billion)
10.6.6 Brazil
10.6.6.1 Brazil Water Recycle and Reuse Market Estimates and Forecasts, By Equipment (2020-2032) (USD Billion)
10.6.6.2 Brazil Water Recycle and Reuse Market Estimates and Forecasts, By Capacity (2020-2032) (USD Billion)
10.6.6.3 Brazil Water Recycle and Reuse Market Estimates and Forecasts, By End-use industry (2020-2032) (USD Billion)
10.6.7 Argentina
10.6.7.1 Argentina Water Recycle and Reuse Market Estimates and Forecasts, By Equipment (2020-2032) (USD Billion)
10.6.7.2 Argentina Water Recycle and Reuse Market Estimates and Forecasts, By Capacity (2020-2032) (USD Billion)
10.6.7.3 Argentina Water Recycle and Reuse Market Estimates and Forecasts, By End-use industry (2020-2032) (USD Billion)
10.6.8 Colombia
10.6.8.1 Colombia Water Recycle and Reuse Market Estimates and Forecasts, By Equipment (2020-2032) (USD Billion)
10.6.8.2 Colombia Water Recycle and Reuse Market Estimates and Forecasts, By Capacity (2020-2032) (USD Billion)
10.6.8.3 Colombia Water Recycle and Reuse Market Estimates and Forecasts, By End-use industry (2020-2032) (USD Billion)
10.6.9 Rest of Latin America
10.6.9.1 Rest of Latin America Water Recycle and Reuse Market Estimates and Forecasts, By Equipment (2020-2032) (USD Billion)
10.6.9.2 Rest of Latin America Water Recycle and Reuse Market Estimates and Forecasts, By Capacity (2020-2032) (USD Billion)
10.6.9.3 Rest of Latin America Water Recycle and Reuse Market Estimates and Forecasts, By End-use industry (2020-2032) (USD Billion)
11. Company Profiles
11.1 Siemens Energy (Germany)
11.1.1 Company Overview
11.1.2 Financial
11.1.3 Products/ Services Offered
11.1.4 SWOT Analysis
11.2 Melbourne Water (Australia)
11.2.1 Company Overview
11.2.2 Financial
11.2.3 Products/ Services Offered
11.2.4 SWOT Analysis
11.3 Hitachi Ltd. (Japan)
11.3.1 Company Overview
11.3.2 Financial
11.3.3 Products/ Services Offered
11.3.4 SWOT Analysis
11.4 Evoqua Water Technologies (US)
11.4.1 Company Overview
11.4.2 Financial
11.4.3 Products/ Services Offered
11.4.4 SWOT Analysis
11.5 Veolia Water Technologies (France)
11.5.1 Company Overview
11.5.2 Financial
11.5.3 Products/ Services Offered
11.5.4 SWOT Analysis
11.6 Dow Chemical Company (US)
11.6.1 Company Overview
11.6.2 Financial
11.6.3 Products/ Services Offered
11.6.4 SWOT Analysis
11.7 SUEZ Water Technologies & Solutions (France)
11.7.1 Company Overview
11.7.2 Financial
11.7.3 Products/ Services Offered
11.7.4 SWOT Analysis
11.8 Kubota Corporation (Japan)
11.8.1 Company Overview
11.8.2 Financial
11.8.3 Products/ Services Offered
11.8.4 SWOT Analysis
11.9 Alfa Laval (Sweden)
11.9.1 Company Overview
11.9.2 Financial
11.9.3 Products/ Services Offered
11.9.4 SWOT Analysis
11.10 Fluence Corporation Limited (US)
11.10.1 Company Overview
11.10.2 Financial
11.10.3 Products/ Services Offered
11.10.4 SWOT Analysis
12. Use Cases and Best Practices
13. Conclusion
An accurate research report requires proper strategizing as well as implementation. There are multiple factors involved in the completion of good and accurate research report and selecting the best methodology to compete the research is the toughest part. Since the research reports we provide play a crucial role in any company’s decision-making process, therefore we at SNS Insider always believe that we should choose the best method which gives us results closer to reality. This allows us to reach at a stage wherein we can provide our clients best and accurate investment to output ratio.
Each report that we prepare takes a timeframe of 350-400 business hours for production. Starting from the selection of titles through a couple of in-depth brain storming session to the final QC process before uploading our titles on our website we dedicate around 350 working hours. The titles are selected based on their current market cap and the foreseen CAGR and growth.
The 5 steps process:
Step 1: Secondary Research:
Secondary Research or Desk Research is as the name suggests is a research process wherein, we collect data through the readily available information. In this process we use various paid and unpaid databases which our team has access to and gather data through the same. This includes examining of listed companies’ annual reports, Journals, SEC filling etc. Apart from this our team has access to various associations across the globe across different industries. Lastly, we have exchange relationships with various university as well as individual libraries.

Step 2: Primary Research
When we talk about primary research, it is a type of study in which the researchers collect relevant data samples directly, rather than relying on previously collected data. This type of research is focused on gaining content specific facts that can be sued to solve specific problems. Since the collected data is fresh and first hand therefore it makes the study more accurate and genuine.
We at SNS Insider have divided Primary Research into 2 parts.
Part 1 wherein we interview the KOLs of major players as well as the upcoming ones across various geographic regions. This allows us to have their view over the market scenario and acts as an important tool to come closer to the accurate market numbers. As many as 45 paid and unpaid primary interviews are taken from both the demand and supply side of the industry to make sure we land at an accurate judgement and analysis of the market.
This step involves the triangulation of data wherein our team analyses the interview transcripts, online survey responses and observation of on filed participants. The below mentioned chart should give a better understanding of the part 1 of the primary interview.

Part 2: In this part of primary research the data collected via secondary research and the part 1 of the primary research is validated with the interviews from individual consultants and subject matter experts.
Consultants are those set of people who have at least 12 years of experience and expertise within the industry whereas Subject Matter Experts are those with at least 15 years of experience behind their back within the same space. The data with the help of two main processes i.e., FGDs (Focused Group Discussions) and IDs (Individual Discussions). This gives us a 3rd party nonbiased primary view of the market scenario making it a more dependable one while collation of the data pointers.
Step 3: Data Bank Validation
Once all the information is collected via primary and secondary sources, we run that information for data validation. At our intelligence centre our research heads track a lot of information related to the market which includes the quarterly reports, the daily stock prices, and other relevant information. Our data bank server gets updated every fortnight and that is how the information which we collected using our primary and secondary information is revalidated in real time.

Step 4: QA/QC Process
After all the data collection and validation our team does a final level of quality check and quality assurance to get rid of any unwanted or undesired mistakes. This might include but not limited to getting rid of the any typos, duplication of numbers or missing of any important information. The people involved in this process include technical content writers, research heads and graphics people. Once this process is completed the title gets uploader on our platform for our clients to read it.
Step 5: Final QC/QA Process:
This is the last process and comes when the client has ordered the study. In this process a final QA/QC is done before the study is emailed to the client. Since we believe in giving our clients a good experience of our research studies, therefore, to make sure that we do not lack at our end in any way humanly possible we do a final round of quality check and then dispatch the study to the client.
Key Segments
By Equipment
Filtration
Machinery
Tanks
Pipes & Drains
Others
By Capacity
<25,000L
25,001 TO 50,000 L
50,001 L TO 100,000 L
>100,001 L
By End-use industry
Industrial
Commercial
Residential
Request for Segment Customization as per your Business Requirement: Segment Customization Request
Regional Coverage:
North America
US
Canada
Mexico
Europe
Eastern Europe
Poland
Romania
Hungary
Turkey
Rest of Eastern Europe
Western Europe
Germany
France
UK
Italy
Spain
Netherlands
Switzerland
Austria
Rest of Western Europe
Asia Pacific
China
India
Japan
South Korea
Vietnam
Singapore
Australia
Rest of Asia Pacific
Middle East & Africa
Middle East
UAE
Egypt
Saudi Arabia
Qatar
Rest of Middle East
Africa
Nigeria
South Africa
Rest of Africa
Latin America
Brazil
Argentina
Colombia
Rest of Latin America
Request for Country Level Research Report: Country Level Customization Request
Available Customization
With the given market data, SNS Insider offers customization as per the company’s specific needs. The following customization options are available for the report:
Detailed Volume Analysis
Criss-Cross segment analysis (e.g. Product X Application)
Competitive Product Benchmarking
Geographic Analysis
Additional countries in any of the regions
Customized Data Representation
Detailed analysis and profiling of additional market players
The Metal Stamping Market Size was valued at USD 224.77 Billion in 2023 and is expected to reach USD 318.20 Billion by 2032 and grow at a CAGR of 3.99% over the forecast period 2024-2032.
The Piling Machine Market size was valued at USD 5.31 Billion in 2023. It is expected to grow to USD 7.48 Billion by 2032 and grow at a CAGR of 3.89% over the forecast period of 2024-2032.
The Laser Welding Machine Market Size was estimated at USD 1.75 billion in 2023 and is expected to arrive at USD 2.66 billion by 2032 with a growing CAGR of 4.74% over the forecast period 2024-2032.
Oilfield Equipment Market was esteemed at USD 109.20 billion in 2023 and is supposed to arrive at USD 146.15 billion by 2032, at a CAGR of 3.29% from 2024-2032.
Plastic Injection Molding Machine Market was valued at USD 11.91 Bn in 2023 and is expected to reach USD 17.16 Bn by 2032, at a CAGR of 4.14% from 2024-2032.
The Concrete Equipment Market size was valued at USD 18.66 billion in 2023. It is expected to grow to USD 24.97 billion by 2032 and grow at a CAGR of 3.29% over the forecast period of 2024-2032.

Hi! Click one of our member below to chat on Phone
© 2025 All Rights Reserved by SNS Insider Pvt Ltd


