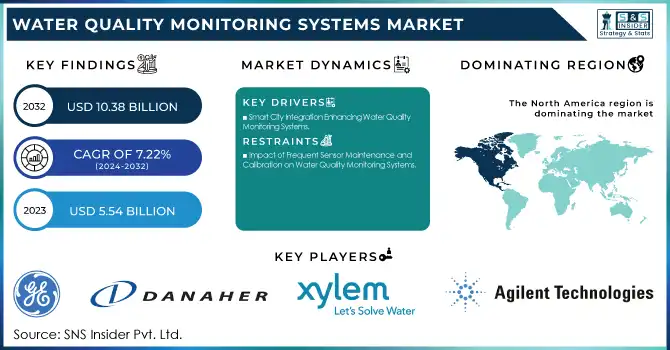
The Water Quality Monitoring Systems Market Size was valued at USD 5.54 billion in 2023 and is expected to reach USD 10.38 billion by 2032 and grow at a CAGR of 7.22% over the forecast period 2024-2032. These systems are mainly employed to monitor the quality of the water in advance to avoid the risk of using polluted water because of an illness caused by using unhealthy water. Moreover, technological advancements that include the incorporation of artificial intelligence, Internet of Things, and smart sensors have stepped up the monitoring process.
To Get more information on Water Quality Monitoring Systems Market - Request Free Sample Report
Another major boost for adoption in this industry is the focus on social responsibility and sustainability, considering that many companies have made commitments to reducing their environmental impact, while also improving water conservation. Regional advancements in technology and rising awareness about water quality issues are also contributing to market growth, particularly in emerging economies.
Drivers:
Smart City Integration Enhancing Water Quality Monitoring Systems
Growing smart city initiatives with emphasis on integrated infrastructure coupled with sustainable urban management is propelling the demand of advanced water quality monitoring system. Smart water management is the way forward and IoT systems, real-time data collection, predictive analytics and better decision making are some of the key highlights in managing smart urban water resources. As cities become smart ecosystems, it has become more than imperative to ensure efficient, scalable, and eco-friendly solutions to monitor water quality. IoT, AI, and sensor technologies are revolutionizing water conservation, quality assurance, and regulatory compliance across sprawling cities. With 840,000 miles of digital network infrastructure, companies such as Spectrum Enterprise are uniquely placed to drive these smart city initiatives forward. Spectrum, in addition, pledged to spend USD 25 billion to increase its capacity in five years, which should facilitate the deployment of water quality monitoring systems. This growth in smart city infrastructure is a key factor accelerating the global demand for advanced water monitoring solutions.
Restraints:
Impact of Frequent Sensor Maintenance and Calibration on Water Quality Monitoring Systems
Frequent maintenance and calibration of sensors in water quality monitoring systems are critical to ensuring their accuracy and reliability. Over time, sensors can drift or become less responsive, necessitating regular recalibration to maintain precision in measuring key water quality parameters such as pH, turbidity, and chemical concentrations. Additionally, these systems often require periodic maintenance to replace worn-out or malfunctioning components, which can result in operational downtime. Depending on the sensor, downtime could account for additional costs such as sensor replacement, labor, and system diagnostics apart from disrupting the constant monitoring process. For municipalities or industries who depend on real-time data, these problems can hinder water quality monitoring initiatives, resulting in delayed corrective actions as well as increased total cost of ownership (TCO).
Opportunities:
Revolutionizing Water Quality Monitoring through IoT and AI Advancements.
Advancements in IoT (Internet of Things) and AI (Artificial Intelligence) are transforming the water quality monitoring systems market by enabling more efficient, precise, and cost-effective solutions. Devices that involve smart sensors or connected monitoring stations that record real-time measurements of different water quality parameters, including pH, turbidity, chemical concentrations or temperature. The data is sent wirelessly to the central systems to be monitored on an ongoing basis. This process is enhanced with AI by analyzing the vast amounts of data created through the process and detecting patterns, trends, and anomalies with machine-learning algorithms. Therefore, AI helps in predicting incoming problems like contamination events, and equipment failure before they happen, which facilitates pre-emptive interventions. One promising, AI-powered method for such water testing takes advantage of the power of a smartphone camera to capture color changes in the water as it reacts; these changes are then interpreted. The model created by the technique produced remarkable accuracy, with R² values of 0.868 for freshwater samples and 0.978 for saltwater samples. Additionally, the method achieves low root-mean-square-error values, underscoring its precision. This technological integration reduces the reliance on manual testing, lowers labor costs, and improves resource management, contributing to more sustainable water management practices.
Challenges:
Ensuring Sensor Accuracy and Overcoming Maintenance Challenges in Water Quality Monitoring
Ensuring the accuracy and reliability of sensors in water quality monitoring is crucial for obtaining precise data. Over time, sensors may degrade, causing them to lose sensitivity of key metrics such as pH and turbidity. They need to be calibrated and maintained periodically to ensure reliable operation, which translates into operational downtime and extra costs incurred in repairs and replacements. Maintaining these sensors has been a significant hurdle for this continuous process, decreasing the efficacy of overall water quality management systems.
By Type
The sensors segment held the dominant share of around 55% in the Water Quality Monitoring Systems market in 2023, Due to the increasing adoption of advanced sensor technologies for the real-time monitoring of different water quality parameters such as pH, conductivity, turbidity, dissolved oxygen, and chemical concentrations. These sensors offer high accuracy, ease of installation, and cost-effectiveness, making them indispensable in both industrial and municipal water quality management. Their ability to provide continuous data allows for early detection of contamination and more efficient resource management. With the increasing demand for automation and smart water management systems, sensor technologies are becoming integral to ensuring reliable, real-time water quality monitoring, further propelling market growth in this segment.
The Data Acquisition Systems (DAS) segment is expected to be the fastest-growing in the Water Quality Monitoring Systems market over the forecast period (2024-2032). This growth can be described to the rising demand for real-time collection, storage, and analysis of water quality parameters. DAS combines sensors, communication networks, and analytic tools to facilitate real-time monitoring that promotes more efficient water use. The ability of DAS to aggregate voluminous data into predictive analytics for decision-making capabilities is driving rapid adoption of DAS technologies, and as industries and municipalities alike turn toward increasingly reliable, automated systems for water quality monitoring, the market continues to see an upwards growth trajectory.
By Application
In 2023, the Utility segment accounted for the largest revenue share of around 43% in the Water Quality Monitoring Systems market. This dominance is fueled by the growing need from municipalities and utility companies for reliable, real-time quality monitoring of water during its journey through distribution networks and treatment plants. In terms of meeting regulations, utilities are pouring money into new water quality monitoring systems that help them not only guarantee safe to drink water, but also ensure compliance and detect possible contamination events. Furthermore, the increasing emphasis on sustainable water management and the need for optimized resource utilization have also led to the widespread acceptance of such systems. As urbanization and water scarcity concerns rise, the utility sector's reliance on water quality monitoring technology is expected to continue driving market growth.
The Residential segment is expected to be the fastest-growing in the Water Quality Monitoring Systems market over the forecast period from 2024 to 2032. To continue as consumers become more informed on water quality and the demand for safe, clean water rises in households. Due to the increasing awareness among homeowners regarding drinking water contaminants, water quality monitoring systems are also being adopted to target health and safety of families until 2023. Furthermore, the growing trend towards smart house technologies and evolving IoT-based systems are anticipated to make water quality monitoring systems affordable and accessible for residential consumers. This trend is expected to fuel the market's expansion in the coming years.
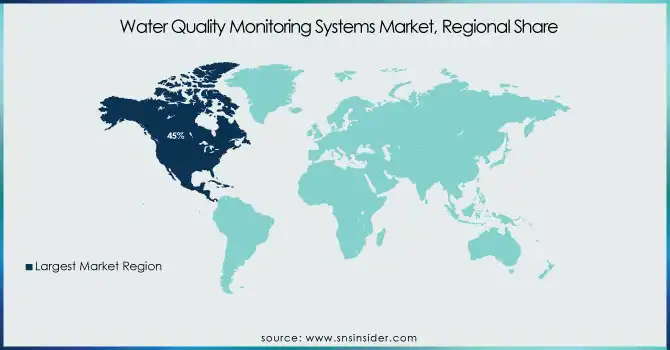
In 2023, North America dominated the Water Quality Monitoring Systems market, holding a significant revenue share of around 45%, due to significant demand by industries, municipalities, and governments for sophisticated water management systems to address increasing concerns on water pollution and resources management. One of the benefits of the region is that it has established infrastructure, much higher technology adaptation and a growing focus on environmental sustainability. A major driver of market growth is the regulatory policies in the U.S. and the significant financial contributions made to water quality monitoring technologies. Moreover, Canada’s dedication to sustainable management of water reinforces the region’s excellence within the global market. As smart city initiatives and stricter environmental regulations take hold, North America is expected to maintain its dominant position in the coming years.
The Asia-Pacific region is the fastest-growing market for Water Quality Monitoring Systems during the forecast period from 2024 to 2032, driven by Increased awareness about the impact of environmental pollution on human health, along with the fast adoption of digital technologies such as Internet of Things (IoT) and Artificial Intelligence (AI), is boosting the need for accurate water quality monitoring solutions. Asia is growing as a hub for smart water management systems with countries like China, India, and Japan investing heavily on smart water management systems. In this dynamic region the demand for better water management practices and regulatory compliance drive market growth.
Get Customized Report as per Your Business Requirement - Enquiry Now
Some of the Major key Players in Water Quality Monitoring Systems Market along with their product:
General Electric Company (USA) [Products: Power generation, water treatment systems, industrial equipment]
Danaher Corporation (USA) [Products: Life sciences, diagnostics, water quality, industrial tools]
Xylem (USA) [Products: Water treatment solutions, pumps, water quality testing instruments]
Agilent Technologies, Inc. (USA) [Products: Analytical instruments, life sciences, diagnostics, chemical analysis]
Teledyne Technologies Incorporated (USA) [Products: Electronic instruments, imaging systems, water quality testing]
HORIBA, Ltd. (Japan) [Products: Analytical instruments, automotive testing equipment, water quality measurement]
Emerson Electric Co. (USA) [Products: Industrial automation, process control systems, environmental solutions]
Siemens (Germany) [Products: Automation, industrial control systems, water treatment solutions]
Evoqua Water Technologies LLC (USA) [Products: Water filtration, treatment, and wastewater management solutions]
Pentair (USA) [Products: Water filtration, fluid management systems, industrial water treatment]
Rockwell Automation (USA) [Products: Industrial automation, control systems, software solutions]
ABB Ltd. (Switzerland) [Products: Robotics, industrial automation, water treatment systems]
Schneider Electric (France) [Products: Energy management, automation, water treatment solutions]
IDE Technologies (Israel) [Products: Desalination, water treatment systems, industrial filtration]
Veolia (France) [Products: Water management, waste management, energy services, environmental solutions]
Trimble (USA) [Products: Water management software, geographic information systems (GIS), remote sensing equipment]
Badger Meter (USA) [Products: Water metering systems, flow measurement, remote monitoring solutions]
List of Suppliers who provide raw material and Component in Water Quality Monitoring Systems Market:
Honeywell International Inc.
Thermo Fisher Scientific Inc.
Endress+Hauser
Emerson Electric Co.
SUEZ Water Technologies & Solutions
Xylem Inc.
Ruggedcom (Siemens)
Ametek Inc.
Horiba Ltd.
YSI Inc. (A Danaher Company)
On January 3, 2024, Badger Meter (NYSE: BMI) acquired remote water monitoring hardware and software from Trimble (NASDAQ: TRMB), including Telog RTUs and Trimble Unity software, enhancing real-time data collection for water and environmental monitoring.
On August 23, 2024, Siemens introduced its Water Quality Analytics as a Service (WQAaaS) for UK water utilities, offering real-time water quality data and insights to enhance maintenance and support digital transformation during AMP8, including sensor installation, data connectivity, and analytical insights from treatment works to customer taps.
| Report Attributes | Details |
|---|---|
| Market Size in 2023 | USD 5.54 Billion |
| Market Size by 2032 | USD 10.38 Billion |
| CAGR | CAGR of 7.22 % From 2024 to 2032 |
| Base Year | 2023 |
| Forecast Period | 2024-2032 |
| Historical Data | 2020-2022 |
| Report Scope & Coverage | Market Size, Segments Analysis, Competitive Landscape, Regional Analysis, DROC & SWOT Analysis, Forecast Outlook |
| Key Segments | • By Type (Sensors [Ph, Dissolved Oxygen Sensors, Temperature Sensors, Turbidity Sensors, Total Organic Carbon (TOC) Analyzer, Conductivity Sensors, Others],Data Acquisition Systems, Data Analysis and Visualization Tools) • By Application(Utility, Industrial, Commercial, Residential, Laboratories, Government Buildings, Others) |
| Regional Analysis/Coverage | North America (US, Canada, Mexico), Europe (Eastern Europe [Poland, Romania, Hungary, Turkey, Rest of Eastern Europe] Western Europe] Germany, France, UK, Italy, Spain, Netherlands, Switzerland, Austria, Rest of Western Europe]), Asia Pacific (China, India, Japan, South Korea, Vietnam, Singapore, Australia, Rest of Asia Pacific), Middle East & Africa (Middle East [UAE, Egypt, Saudi Arabia, Qatar, Rest of Middle East], Africa [Nigeria, South Africa, Rest of Africa], Latin America (Brazil, Argentina, Colombia, Rest of Latin America) |
| Company Profiles | General Electric Company (USA), Danaher Corporation (USA), Xylem (USA), Agilent Technologies, Inc. (USA), Teledyne Technologies Incorporated (USA), HORIBA, Ltd. (Japan), Emerson Electric Co. (USA), Siemens (Germany), Evoqua Water Technologies LLC (USA), Pentair (USA), Rockwell Automation (USA), ABB Ltd. (Switzerland), Schneider Electric (France), IDE Technologies (Israel), Veolia (France),Trimble (USA),Badger Meter (USA) |
Ans: The Water Quality Monitoring Market grow at a CAGR of 7.22% over the forecast period of 2024-2032.
Ans: The Power Quality Equipment Market Size was valued at USD 5.54 billion in 2023 and is expected to reach USD 10.38 billion by 2032.
Ans: The major growth factor of the Water Quality Monitoring Systems Market is the increasing demand for real-time water quality data driven by environmental concerns, regulatory requirements, and the adoption of smart technologies like IoT and AI.
Ans: The Sensors segment dominated the Water Quality Monitoring Market.
Ans: North America dominated the Water Quality Monitoring Systems Market in 2023.
1. Introduction
1.1 Market Definition
1.2 Scope (Inclusion and Exclusions)
1.3 Research Assumptions
2. Executive Summary
2.1 Market Overview
2.2 Regional Synopsis
2.3 Competitive Summary
3. Research Methodology
3.1 Top-Down Approach
3.2 Bottom-up Approach
3.3. Data Validation
3.4 Primary Interviews
4. Market Dynamics Impact Analysis
4.1 Market Driving Factors Analysis
4.1.2 Drivers
4.1.2 Restraints
4.1.3 Opportunities
4.1.4 Challenges
4.2 PESTLE Analysis
4.3 Porter’s Five Forces Model
5. Statistical Insights and Trends Reporting
5.1 Consumer Behaviour
5.2 Technological Innovations by Region
5.3 Social Responsibility and Sustainability
6. Competitive Landscape
6.1 List of Major Companies, By Region
6.2 Market Share Analysis, By Region
6.3 Product Benchmarking
6.3.1 Product specifications and features
6.3.2 Pricing
6.4 Strategic Initiatives
6.4.1 Marketing and promotional activities
6.4.2 Distribution and supply chain strategies
6.4.3 Expansion plans and new product launches
6.4.4 Strategic partnerships and collaborations
6.5 Technological Advancements
6.6 Market Positioning and Branding
7. Water Quality Monitoring Systems Market Segmentation, by Type
7.1 Chapter Overview
7.2 Sensors
7.2.1 Sensors Market Trends Analysis (2020-2032)
7.2.2 Sensors Market Size Estimates and Forecasts to 2032 (USD Billion)
7.2.3 pH
7.2.3.1 pH Market Trends Analysis (2020-2032)
7.2.3.2 pH Market Size Estimates and Forecasts to 2032 (USD Billion)
Dissolved Oxygen Sensors
Temperature Sensors
Turbidity Sensors
Total Organic Carbon (TOC) Analyzer
Conductivity Sensors
Others
7.2.4 Dissolved Oxygen Sensors
7.2.4.1 Dissolved Oxygen Sensors Market Trends Analysis (2020-2032)
7.2.4.2 Dissolved Oxygen Sensors Market Size Estimates and Forecasts to 2032 (USD Billion)
7.2.5 Temperature Sensors
7.2.5.1 Temperature Sensors Market Trends Analysis (2020-2032)
7.2.5.2 Temperature Sensors Market Size Estimates and Forecasts to 2032 (USD Billion)
7.2.6 Turbidity Sensors
7.2.6.1 Turbidity Sensors Market Trends Analysis (2020-2032)
7.2.6.2 Turbidity Sensors Market Size Estimates and Forecasts to 2032 (USD Billion)
7.2.7 Total Organic Carbon (TOC) Analyzer
7.2.7.1 Total Organic Carbon (TOC) Analyzer Market Trends Analysis (2020-2032)
7.2.7.2 Total Organic Carbon (TOC) Analyzer Market Size Estimates and Forecasts to 2032 (USD Billion)
7.2.8 Conductivity Sensors
7.2.8.1 Conductivity Sensors Market Trends Analysis (2020-2032)
7.2.8.2 Conductivity Sensors Market Size Estimates and Forecasts to 2032 (USD Billion)
7.2 Others
7.2.1 Others Market Trends Analysis (2020-2032)
7.2.2 Others Market Size Estimates and Forecasts to 2032 (USD Billion)
7.3 Data Acquisition Systems
7.3.1 Data Acquisition Systems Market Trends Analysis (2020-2032)
7.3.2 Data Acquisition Systems Market Size Estimates and Forecasts to 2032 (USD Billion)
7.4 Data Analysis and Visualization Tools
7.4.1 Data Analysis and Visualization Tools Market Trends Analysis (2020-2032)
7.4.2 Data Analysis and Visualization Tools Market Size Estimates and Forecasts to 2032 (USD Billion)
8. Water Quality Monitoring Systems Market Segmentation, by Application
8.1 Chapter Overview
8.2 Utility
8.2.1 Utility Market Trends Analysis (2020-2032)
8.2.2 Utility Market Size Estimates and Forecasts to 2032 (USD Billion)
8.3 Industrial
8.3.1Industrial Market Trends Analysis (2020-2032)
8.3.2 Industrial Market Size Estimates and Forecasts to 2032 (USD Billion)
8.4 Commercial
8.4.1Commercial Market Trends Analysis (2020-2032)
8.4.2 Commercial Market Size Estimates and Forecasts to 2032 (USD Billion)
8.5 Residential
8.5.1 Residential Market Trends Analysis (2020-2032)
8.5.2 Residential Market Size Estimates and Forecasts to 2032 (USD Billion)
8.6 Laboratories
8.6.1 Laboratories Market Trends Analysis (2020-2032)
8.6.2 Laboratories Market Size Estimates and Forecasts to 2032 (USD Billion)
8.7 Government Buildings
8.7.1 Government Buildings Market Trends Analysis (2020-2032)
8.7.2 Government Buildings Market Size Estimates and Forecasts to 2032 (USD Billion)
8.8 Others
8.8.1 Others Market Trends Analysis (2020-2032)
8.8.2 Others Market Size Estimates and Forecasts to 2032 (USD Billion)
9. Regional Analysis
9.1 Chapter Overview
9.2 North America
9.2.1 Trends Analysis
9.2.2 North America Water Quality Monitoring Systems Market Estimates and Forecasts, by Country (2020-2032) (USD Billion)
9.2.3 North America Water Quality Monitoring Systems Market Estimates and Forecasts, by Type (2020-2032) (USD Billion)
9.2.4 North America Water Quality Monitoring Systems Market Estimates and Forecasts, by Application (2020-2032) (USD Billion)
9.2.5 USA
9.2.5.1 USA Water Quality Monitoring Systems Market Estimates and Forecasts, by Type (2020-2032) (USD Billion)
9.2.5.2 USA Water Quality Monitoring Systems Market Estimates and Forecasts, by Application (2020-2032) (USD Billion)
9.2.6 Canada
9.2.6.1 Canada Water Quality Monitoring Systems Market Estimates and Forecasts, by Type (2020-2032) (USD Billion)
9.2.6.2 Canada Water Quality Monitoring Systems Market Estimates and Forecasts, by Application (2020-2032) (USD Billion)
9.2.7 Mexico
9.2.7.1 Mexico Water Quality Monitoring Systems Market Estimates and Forecasts, by Type (2020-2032) (USD Billion)
9.2.7.2 Mexico Water Quality Monitoring Systems Market Estimates and Forecasts, by Application (2020-2032) (USD Billion)
9.3 Europe
9.3.1 Eastern Europe
9.3.1.1 Trends Analysis
9.3.1.2 Eastern Europe Water Quality Monitoring Systems Market Estimates and Forecasts, by Country (2020-2032) (USD Billion)
9.3.1.3 Eastern Europe Water Quality Monitoring Systems Market Estimates and Forecasts, by Type (2020-2032) (USD Billion)
9.3.1.4 Eastern Europe Water Quality Monitoring Systems Market Estimates and Forecasts, by Application (2020-2032) (USD Billion)
9.3.1.5 Poland
9.3.1.5.1 Poland Water Quality Monitoring Systems Market Estimates and Forecasts, by Type (2020-2032) (USD Billion)
9.3.1.5.2 Poland Water Quality Monitoring Systems Market Estimates and Forecasts, by Application (2020-2032) (USD Billion)
9.3.1.6 Romania
9.3.1.6.1 Romania Water Quality Monitoring Systems Market Estimates and Forecasts, by Type (2020-2032) (USD Billion)
9.3.1.6.2 Romania Water Quality Monitoring Systems Market Estimates and Forecasts, by Application (2020-2032) (USD Billion)
9.3.1.7 Hungary
9.3.1.7.1 Hungary Water Quality Monitoring Systems Market Estimates and Forecasts, by Type (2020-2032) (USD Billion)
9.3.1.7.2 Hungary Water Quality Monitoring Systems Market Estimates and Forecasts, by Application (2020-2032) (USD Billion)
9.3.1.8 Turkey
9.3.1.8.1 Turkey Water Quality Monitoring Systems Market Estimates and Forecasts, by Type (2020-2032) (USD Billion)
9.3.1.8.2 Turkey Water Quality Monitoring Systems Market Estimates and Forecasts, by Application (2020-2032) (USD Billion)
9.3.1.9 Rest of Eastern Europe
9.3.1.9.1 Rest of Eastern Europe Water Quality Monitoring Systems Market Estimates and Forecasts, by Type (2020-2032) (USD Billion)
9.3.1.9.2 Rest of Eastern Europe Water Quality Monitoring Systems Market Estimates and Forecasts, by Application (2020-2032) (USD Billion)
9.3.2 Western Europe
9.3.2.1 Trends Analysis
9.3.2.2 Western Europe Water Quality Monitoring Systems Market Estimates and Forecasts, by Country (2020-2032) (USD Billion)
9.3.2.3 Western Europe Water Quality Monitoring Systems Market Estimates and Forecasts, by Type (2020-2032) (USD Billion)
9.3.2.4 Western Europe Water Quality Monitoring Systems Market Estimates and Forecasts, by Application (2020-2032) (USD Billion)
9.3.2.5 Germany
9.3.2.5.1 Germany Water Quality Monitoring Systems Market Estimates and Forecasts, by Type (2020-2032) (USD Billion)
9.3.2.5.2 Germany Water Quality Monitoring Systems Market Estimates and Forecasts, by Application (2020-2032) (USD Billion)
9.3.2.6 France
9.3.2.6.1 France Water Quality Monitoring Systems Market Estimates and Forecasts, by Type (2020-2032) (USD Billion)
9.3.2.6.2 France Water Quality Monitoring Systems Market Estimates and Forecasts, by Application (2020-2032) (USD Billion)
9.3.2.7 UK
9.3.2.7.1 UK Water Quality Monitoring Systems Market Estimates and Forecasts, by Type (2020-2032) (USD Billion)
9.3.2.7.2 UK Water Quality Monitoring Systems Market Estimates and Forecasts, by Application (2020-2032) (USD Billion)
9.3.2.8 Italy
9.3.2.8.1 Italy Water Quality Monitoring Systems Market Estimates and Forecasts, by Type (2020-2032) (USD Billion)
9.3.2.8.2 Italy Water Quality Monitoring Systems Market Estimates and Forecasts, by Application (2020-2032) (USD Billion)
9.3.2.9 Spain
9.3.2.9.1 Spain Water Quality Monitoring Systems Market Estimates and Forecasts, by Type (2020-2032) (USD Billion)
9.3.2.9.2 Spain Water Quality Monitoring Systems Market Estimates and Forecasts, by Application (2020-2032) (USD Billion)
9.3.2.10 Netherlands
9.3.2.10.1 Netherlands Water Quality Monitoring Systems Market Estimates and Forecasts, by Type (2020-2032) (USD Billion)
9.3.2.10.2 Netherlands Water Quality Monitoring Systems Market Estimates and Forecasts, by Application (2020-2032) (USD Billion)
9.3.2.11 Switzerland
9.3.2.11.1 Switzerland Water Quality Monitoring Systems Market Estimates and Forecasts, by Type (2020-2032) (USD Billion)
9.3.2.11.2 Switzerland Water Quality Monitoring Systems Market Estimates and Forecasts, by Application (2020-2032) (USD Billion)
9.3.2.12 Austria
9.3.2.12.1 Austria Water Quality Monitoring Systems Market Estimates and Forecasts, by Type (2020-2032) (USD Billion)
9.3.2.12.2 Austria Water Quality Monitoring Systems Market Estimates and Forecasts, by Application (2020-2032) (USD Billion)
9.3.2.13 Rest of Western Europe
9.3.2.13.1 Rest of Western Europe Water Quality Monitoring Systems Market Estimates and Forecasts, by Type (2020-2032) (USD Billion)
9.3.2.13.2 Rest of Western Europe Water Quality Monitoring Systems Market Estimates and Forecasts, by Application (2020-2032) (USD Billion)
9.4 Asia Pacific
9.4.1 Trends Analysis
9.4.2 Asia Pacific Water Quality Monitoring Systems Market Estimates and Forecasts, by Country (2020-2032) (USD Billion)
9.4.3 Asia Pacific Water Quality Monitoring Systems Market Estimates and Forecasts, by Type (2020-2032) (USD Billion)
9.4.4 Asia Pacific Water Quality Monitoring Systems Market Estimates and Forecasts, by Application (2020-2032) (USD Billion)
9.4.5 China
9.4.5.1 China Water Quality Monitoring Systems Market Estimates and Forecasts, by Type (2020-2032) (USD Billion)
9.4.5.2 China Water Quality Monitoring Systems Market Estimates and Forecasts, by Application (2020-2032) (USD Billion)
9.4.6 India
9.4.5.1 India Water Quality Monitoring Systems Market Estimates and Forecasts, by Type (2020-2032) (USD Billion)
9.4.5.2 India Water Quality Monitoring Systems Market Estimates and Forecasts, by Application (2020-2032) (USD Billion)
9.4.5 Japan
9.4.5.1 Japan Water Quality Monitoring Systems Market Estimates and Forecasts, by Type (2020-2032) (USD Billion)
9.4.5.2 Japan Water Quality Monitoring Systems Market Estimates and Forecasts, by Application (2020-2032) (USD Billion)
9.4.6 South Korea
9.4.6.1 South Korea Water Quality Monitoring Systems Market Estimates and Forecasts, by Type (2020-2032) (USD Billion)
9.4.6.2 South Korea Water Quality Monitoring Systems Market Estimates and Forecasts, by Application (2020-2032) (USD Billion)
9.4.7 Vietnam
9.4.7.1 Vietnam Water Quality Monitoring Systems Market Estimates and Forecasts, by Type (2020-2032) (USD Billion)
9.2.7.2 Vietnam Water Quality Monitoring Systems Market Estimates and Forecasts, by Application (2020-2032) (USD Billion)
9.4.8 Singapore
9.4.8.1 Singapore Water Quality Monitoring Systems Market Estimates and Forecasts, by Type (2020-2032) (USD Billion)
9.4.8.2 Singapore Water Quality Monitoring Systems Market Estimates and Forecasts, by Application (2020-2032) (USD Billion)
9.4.9 Australia
9.4.9.1 Australia Water Quality Monitoring Systems Market Estimates and Forecasts, by Type (2020-2032) (USD Billion)
9.4.9.2 Australia Water Quality Monitoring Systems Market Estimates and Forecasts, by Application (2020-2032) (USD Billion)
9.4.10 Rest of Asia Pacific
9.4.10.1 Rest of Asia Pacific Water Quality Monitoring Systems Market Estimates and Forecasts, by Type (2020-2032) (USD Billion)
9.4.10.2 Rest of Asia Pacific Water Quality Monitoring Systems Market Estimates and Forecasts, by Application (2020-2032) (USD Billion)
9.5 Middle East and Africa
9.5.1 Middle East
9.5.1.1 Trends Analysis
9.5.1.2 Middle East Water Quality Monitoring Systems Market Estimates and Forecasts, by Country (2020-2032) (USD Billion)
9.5.1.3 Middle East Water Quality Monitoring Systems Market Estimates and Forecasts, by Type (2020-2032) (USD Billion)
9.5.1.4 Middle East Water Quality Monitoring Systems Market Estimates and Forecasts, by Application (2020-2032) (USD Billion)
9.5.1.5 UAE
9.5.1.5.1 UAE Water Quality Monitoring Systems Market Estimates and Forecasts, by Type (2020-2032) (USD Billion)
9.5.1.5.2 UAE Water Quality Monitoring Systems Market Estimates and Forecasts, by Application (2020-2032) (USD Billion)
9.5.1.6 Egypt
9.5.1.6.1 Egypt Water Quality Monitoring Systems Market Estimates and Forecasts, by Type (2020-2032) (USD Billion)
9.5.1.6.2 Egypt Water Quality Monitoring Systems Market Estimates and Forecasts, by Application (2020-2032) (USD Billion)
9.5.1.7 Saudi Arabia
9.5.1.7.1 Saudi Arabia Water Quality Monitoring Systems Market Estimates and Forecasts, by Type (2020-2032) (USD Billion)
9.5.1.7.2 Saudi Arabia Water Quality Monitoring Systems Market Estimates and Forecasts, by Application (2020-2032) (USD Billion)
9.5.1.8 Qatar
9.5.1.8.1 Qatar Water Quality Monitoring Systems Market Estimates and Forecasts, by Type (2020-2032) (USD Billion)
9.5.1.8.2 Qatar Water Quality Monitoring Systems Market Estimates and Forecasts, by Application (2020-2032) (USD Billion)
9.5.1.9 Rest of Middle East
9.5.1.9.1 Rest of Middle East Water Quality Monitoring Systems Market Estimates and Forecasts, by Type (2020-2032) (USD Billion)
9.5.1.9.2 Rest of Middle East Water Quality Monitoring Systems Market Estimates and Forecasts, by Application (2020-2032) (USD Billion)
9.5.2 Africa
9.5.2.1 Trends Analysis
9.5.2.2 Africa Water Quality Monitoring Systems Market Estimates and Forecasts, by Country (2020-2032) (USD Billion)
9.5.2.3 Africa Water Quality Monitoring Systems Market Estimates and Forecasts, by Type (2020-2032) (USD Billion)
9.5.2.4 Africa Water Quality Monitoring Systems Market Estimates and Forecasts, by Application (2020-2032) (USD Billion)
9.5.2.5 South Africa
9.5.2.5.1 South Africa Water Quality Monitoring Systems Market Estimates and Forecasts, by Type (2020-2032) (USD Billion)
9.5.2.5.2 South Africa Water Quality Monitoring Systems Market Estimates and Forecasts, by Application (2020-2032) (USD Billion)
9.5.2.6 Nigeria
9.5.2.6.1 Nigeria Water Quality Monitoring Systems Market Estimates and Forecasts, by Type (2020-2032) (USD Billion)
9.5.2.6.2 Nigeria Water Quality Monitoring Systems Market Estimates and Forecasts, by Application (2020-2032) (USD Billion)
9.5.2.7 Rest of Africa
9.5.2.7.1 Rest of Africa Water Quality Monitoring Systems Market Estimates and Forecasts, by Type (2020-2032) (USD Billion)
9.5.2.7.2 Rest of Africa Water Quality Monitoring Systems Market Estimates and Forecasts, by Application (2020-2032) (USD Billion)
9.6 Latin America
9.6.1 Trends Analysis
9.6.2 Latin America Water Quality Monitoring Systems Market Estimates and Forecasts, by Country (2020-2032) (USD Billion)
9.6.3 Latin America Water Quality Monitoring Systems Market Estimates and Forecasts, by Type (2020-2032) (USD Billion)
9.6.4 Latin America Water Quality Monitoring Systems Market Estimates and Forecasts, by Application (2020-2032) (USD Billion)
9.6.5 Brazil
9.6.5.1 Brazil Water Quality Monitoring Systems Market Estimates and Forecasts, by Type (2020-2032) (USD Billion)
9.6.5.2 Brazil Water Quality Monitoring Systems Market Estimates and Forecasts, by Application (2020-2032) (USD Billion)
9.6.6 Argentina
9.6.6.1 Argentina Water Quality Monitoring Systems Market Estimates and Forecasts, by Type (2020-2032) (USD Billion)
9.6.6.2 Argentina Water Quality Monitoring Systems Market Estimates and Forecasts, by Application (2020-2032) (USD Billion)
9.6.7 Colombia
9.6.7.1 Colombia Water Quality Monitoring Systems Market Estimates and Forecasts, by Type (2020-2032) (USD Billion)
9.6.7.2 Colombia Water Quality Monitoring Systems Market Estimates and Forecasts, by Application (2020-2032) (USD Billion)
9.6.8 Rest of Latin America
9.6.8.1 Rest of Latin America Water Quality Monitoring Systems Market Estimates and Forecasts, by Type (2020-2032) (USD Billion)
9.6.8.2 Rest of Latin America Water Quality Monitoring Systems Market Estimates and Forecasts, by Application (2020-2032) (USD Billion)
10. Company Profiles
10.1 General Electric Company
10.1.1 Company Overview
10.1.2 Financial
10.1.3 Products/ Services Offered
10.1.4 SWOT Analysis
10.2 Danaher Corporation
10.2.1 Company Overview
10.2.2 Financial
10.2.3 Products/ Services Offered
10.2.4 SWOT Analysis
10.3 Xylem
10.3.1 Company Overview
10.3.2 Financial
10.3.3 Products/ Services Offered
10.3.4 SWOT Analysis
10.4 Agilent Technologies, Inc.
10.4.1 Company Overview
10.4.2 Financial
10.4.3 Products/ Services Offered
10.4.4 SWOT Analysis
10.5 Teledyne Technologies Incorporated
10.5.1 Company Overview
10.5.2 Financial
10.5.3 Products/ Services Offered
10.5.4 SWOT Analysis
10.6 HORIBA, Ltd.
10.6.1 Company Overview
10.6.2 Financial
10.6.3 Products/ Services Offered
10.6.4 SWOT Analysis
10.7 Emerson Electric Co.
10.7.1 Company Overview
10.7.2 Financial
10.7.3 Products/ Services Offered
10.7.4 SWOT Analysis
10.8 Siemens
10.8.1 Company Overview
10.8.2 Financial
10.8.3 Products/ Services Offered
10.8.4 SWOT Analysis
10.9 Evoqua Water Technologies LLC
10.9.1 Company Overview
10.9.2 Financial
10.9.3 Products/ Services Offered
10.9.4 SWOT Analysis
10.10 Pentair
10.10.1 Company Overview
10.10.2 Financial
10.10.3 Products/ Services Offered
10.10.4 SWOT Analysis
11. Use Cases and Best Practices
12. Conclusion
An accurate research report requires proper strategizing as well as implementation. There are multiple factors involved in the completion of good and accurate research report and selecting the best methodology to compete the research is the toughest part. Since the research reports we provide play a crucial role in any company’s decision-making process, therefore we at SNS Insider always believe that we should choose the best method which gives us results closer to reality. This allows us to reach at a stage wherein we can provide our clients best and accurate investment to output ratio.
Each report that we prepare takes a timeframe of 350-400 business hours for production. Starting from the selection of titles through a couple of in-depth brain storming session to the final QC process before uploading our titles on our website we dedicate around 350 working hours. The titles are selected based on their current market cap and the foreseen CAGR and growth.
The 5 steps process:
Step 1: Secondary Research:
Secondary Research or Desk Research is as the name suggests is a research process wherein, we collect data through the readily available information. In this process we use various paid and unpaid databases which our team has access to and gather data through the same. This includes examining of listed companies’ annual reports, Journals, SEC filling etc. Apart from this our team has access to various associations across the globe across different industries. Lastly, we have exchange relationships with various university as well as individual libraries.

Step 2: Primary Research
When we talk about primary research, it is a type of study in which the researchers collect relevant data samples directly, rather than relying on previously collected data. This type of research is focused on gaining content specific facts that can be sued to solve specific problems. Since the collected data is fresh and first hand therefore it makes the study more accurate and genuine.
We at SNS Insider have divided Primary Research into 2 parts.
Part 1 wherein we interview the KOLs of major players as well as the upcoming ones across various geographic regions. This allows us to have their view over the market scenario and acts as an important tool to come closer to the accurate market numbers. As many as 45 paid and unpaid primary interviews are taken from both the demand and supply side of the industry to make sure we land at an accurate judgement and analysis of the market.
This step involves the triangulation of data wherein our team analyses the interview transcripts, online survey responses and observation of on filed participants. The below mentioned chart should give a better understanding of the part 1 of the primary interview.

Part 2: In this part of primary research the data collected via secondary research and the part 1 of the primary research is validated with the interviews from individual consultants and subject matter experts.
Consultants are those set of people who have at least 12 years of experience and expertise within the industry whereas Subject Matter Experts are those with at least 15 years of experience behind their back within the same space. The data with the help of two main processes i.e., FGDs (Focused Group Discussions) and IDs (Individual Discussions). This gives us a 3rd party nonbiased primary view of the market scenario making it a more dependable one while collation of the data pointers.
Step 3: Data Bank Validation
Once all the information is collected via primary and secondary sources, we run that information for data validation. At our intelligence centre our research heads track a lot of information related to the market which includes the quarterly reports, the daily stock prices, and other relevant information. Our data bank server gets updated every fortnight and that is how the information which we collected using our primary and secondary information is revalidated in real time.

Step 4: QA/QC Process
After all the data collection and validation our team does a final level of quality check and quality assurance to get rid of any unwanted or undesired mistakes. This might include but not limited to getting rid of the any typos, duplication of numbers or missing of any important information. The people involved in this process include technical content writers, research heads and graphics people. Once this process is completed the title gets uploader on our platform for our clients to read it.
Step 5: Final QC/QA Process:
This is the last process and comes when the client has ordered the study. In this process a final QA/QC is done before the study is emailed to the client. Since we believe in giving our clients a good experience of our research studies, therefore, to make sure that we do not lack at our end in any way humanly possible we do a final round of quality check and then dispatch the study to the client.
By Type
Sensors
pH
Dissolved Oxygen Sensors
Turbidity Sensors
Conductivity Sensors
Others
Data Acquisition Systems
Data Analysis and Visualization Tools
By Application
Utility
Industrial
Commercial
Residential
Laboratories
Government Buildings
Others
Request for Segment Customization as per your Business Requirement: Segment Customization Request
Regional Coverage:
North America
US
Canada
Mexico
Europe
Eastern Europe
Poland
Romania
Hungary
Turkey
Rest of Eastern Europe
Western Europe
Germany
France
UK
Italy
Spain
Netherlands
Switzerland
Austria
Rest of Western Europe
Asia Pacific
China
India
Japan
South Korea
Vietnam
Singapore
Australia
Rest of Asia Pacific
Middle East & Africa
Middle East
UAE
Egypt
Saudi Arabia
Qatar
Rest of Middle East
Africa
Nigeria
South Africa
Rest of Africa
Latin America
Brazil
Argentina
Colombia
Rest of Latin America
Request for Country Level Research Report: Country Level Customization Request
Available Customization
With the given market data, SNS Insider offers customization as per the company’s specific needs. The following customization options are available for the report:
Detailed Volume Analysis
Criss-Cross segment analysis (e.g. Product X Application)
Competitive Product Benchmarking
Geographic Analysis
Additional countries in any of the regions
Customized Data Representation
Detailed analysis and profiling of additional market players
The Printed Circuit Board Market was valued at 75.85 billion in 2023 and is projected to reach USD 117.53 Billion by 2032, growing at a CAGR of 4.99 % from 2024 to 2032.
Pin Insertion Machine market was worth USD 216.67 million in 2023 and will reach USD 368.81 million by 2032, growing at a CAGR of 6.15 % during the forecast period 2024-2032.
The Power Management IC Market Size was valued at USD 36.63 Billion in 2023 and is expected to grow at a CAGR of 5.5% to reach USD 58.91 Billion by 2032.
The Wifi 6E Chipset Market Size was valued at USD 7.82 billion in 2023 and is expected to grow at a CAGR of 23.07% to reach USD 50.32 billion by 2032.
The Timing Devices Market Size was valued at USD 5.50 billion in 2023 and is expected to grow at a CAGR of 6.94% to reach USD 10.03 billion by 2032.
The InGaAs Photodiode Sensors Market Size was valued at USD 225 Million in 2023 and is expected to grow at 8.11% CAGR to reach USD 452.70 Million by 2032.

Hi! Click one of our member below to chat on Phone
© 2025 All Rights Reserved by SNS Insider Pvt Ltd


