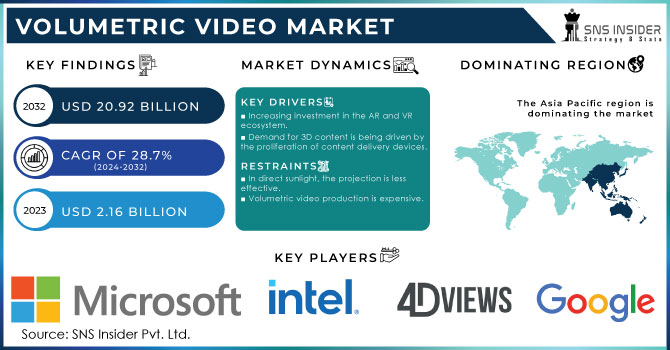
The Volumetric Video Market Size was valued at USD 2.6 billion in 2023 and is expected to reach USD 24.23 billion by 2032, growing at a CAGR of 28.15% over the forecast period 2024-2032. Some significant factors propelling the growth of the market are the rising demand for immersive experiences across entertainment, education, and healthcare sectors; and further advancements in capture technology like 3D cameras and AI-enabled video processing.
Get more information on Volumetric Video Market - Request Sample Report
Regulatory and ethical issues are also still evolving, particularly around privacy, data capture, and the sharing of immersive content. Potential regulatory impacts may have an effect on production as well as usage, enabling industry standards and policies to govern video content across sectors. Moreover, strategic collaborations and technological advancements are further fueling market growth and propelling use cases in diverse industries.
Drivers:
Rising Demand for Immersive Experiences Drives the Need for Volumetric Video in AR/VR Technologies.
The growing demand for immersive experiences across industries like entertainment, gaming, and education is a major driver for the volumetric video market. With the widespread adoption of augmented reality (AR) and virtual reality (VR) technologies, there is an increasing need to create more lifelike, interactive environments. Volumetric video allows users to experience 3D content in real-time, offering a level of realism that traditional 2D video cannot provide. In sectors like gaming, users can engage with environments and characters more deeply, while in education and training, this technology helps in creating interactive simulations. As the desire for more engaging and personalized experiences increases, volumetric video plays a key role in shaping the future of AR/VR applications.
Restraints:
Overcoming Infrastructure Challenges in the Volumetric Video Market for Enhanced Adoption.
volumetric video requires a high level of infrastructure from the cutting-edge hardware and specialized software to the colossal computational power needed to capture, process, and render volumetric content. Creating and rendering volumetric content usually requires a lot of cameras, sensors, and processing units, which makes the whole process expensive. Moreover, the real-time processing and rendering of 3D content require high-performance computing resources, thus driving the need for high-performance computing solutions in this domain. Acquiring and maintaining this is a complex piece of infrastructure and can be a significant barrier to entry for many businesses (especially small and medium-sized businesses). This high initial investment and ongoing out-laying further slow the adoption and scalability of such volumetric video technology.
Opportunity:
Advancements in 5G technology are driving the growth of the volumetric video market by enabling faster streaming and real-time immersive experiences.
The expansion of volumetric video market is tremendously attributed to the rollout of 5G technology. 5G’s high-bandwidth capabilities and ultra-low latency also mean that high-resolution, data-heavy volumetric video content can be streamed more rapidly than ever. With this network enhancement, Live provides collision-free, real-time interaction most in-demand by augmented and virtual reality (AR/VR), gaming, and live events applications. Drive Enhanced Experiences: The continuation of the 5G networks will allow businesses to deliver audiences immersive and interactive experiences. Moreover, this opens up so many avenues for volumetric video technologies to find applications across various industry verticals.
Challenges:
Overcoming Complex Data Processing Challenges in the Volumetric Video Market
Volumetric video technology generates vast amounts of data from 3D captures, requiring significant computational power to process, store, and render high-quality video. This demand for high-performance processing units and storage infrastructure can lead to increased costs and latency issues. Challenges that can slow down real-time rendering and interactive capability include complexity with the evolving technology and content, ultimately impeding the scalability of volumetric video applications. The requirement for specific hardware and software raises the entry barrier for many companies; demanding a considerable investment in infrastructure.
By Volumetric Capture
The hardware segment dominated the volumetric video market in 2023, capturing around 40% of the revenue share. The market is generally dominated by volumetric video capture system, as there are an increasing number of high-quality capture hardware such as camera, sensors, and computing equipment for volumetric video production. These devices create a real-time rendering of high-resolution images that meets the immersive experience demanded by sectors such as entertainment, gaming, and education. The evolution of technology continues to drive such hardware innovations, which in turn is expanding the range of capabilities offered by versatile volumetric video systems, ultimately helping boost market growth.
The service segment is the fastest growing in the volumetric video market over the forecast period from 2024 to 2032. The need for specialized burnt services such as video production, post-production, cloud storage, and real-time streaming are what are driving this growth, as they are needed to enable all the various workflows necessary to create volumetric video content. The demand for volumetric video production, integration and distribution will grow as more industries embrace immersive technologies for entertainment, education and training, and are looking for end to end solutions and service providers with expertise.
By Delivery Platforms
The AR/VR HMDs (Head-Mounted Displays) segment dominated the volumetric video market with the largest share of around 41% in 2023. The increasing adoption across diverse industries (gaming, entertainment, healthcare, education, etc.) for AR/VR devices is driving this dominance. Such immersive experiences require HMD to enable users to interact with volumetric content as the volumetric content needs to be presented in three dimensional interactive and realistic manner. With the demand for high quality, immersive experiences showing no signs of slowing down, AR/VR HMDs will make up a huge percentage of the market and will aid in future growth.
The smartphones segment is poised for the fastest growth in the volumetric video market over the forecast period from 2024 to 2032. As smartphone, technology continues to advance, with improved camera capabilities, processing power, and display technology, the demand for immersive experiences is rising. Volumetric video can be seamlessly integrated into smartphones, offering consumers real-time, interactive experiences across various applications, such as entertainment, gaming, and education. This trend is expected to drive adoption, making smartphones a key platform for delivering volumetric video content to a broader audience.
By Application
The sports, events, and entertainment segment dominated the volumetric video market in 2023, accounting for around 41% of the revenue share. This growth is driven by the increasing demand for immersive and interactive experiences in live sports broadcasts, entertainment events, and other media content. Volumetric video enables viewers to experience events from multiple angles, enhancing engagement and realism. As the adoption of AR/VR technologies expands, especially in entertainment and sports, volumetric video is poised to revolutionize how audiences interact with live events, fueling the segment's dominance in the market.
The signage and advertisement segment is expected to be the fastest growing in the volumetric video market from 2024 to 2032. This growth is fueled by the increasing demand for more dynamic, interactive, and immersive advertising experiences. Volumetric video allows advertisers to create 3D, interactive content that can be displayed across various platforms, enhancing consumer engagement. This technology is gaining traction as it enables brands to deliver more personalized and memorable advertisements, providing an edge in highly competitive markets. As businesses strive for innovative marketing strategies, the adoption of volumetric video in advertising is expected to accelerate significantly.
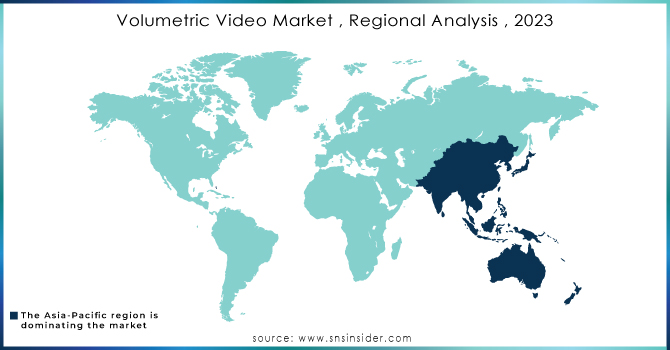
North America dominates the volumetric video market, holding a 34% share in 2023. This is due to the region’s leadership in technological advancements, substantial investment in research and development, and a thriving entertainment industry. The demand for immersive content in sectors such as gaming, healthcare, and education further fuels growth. Additionally, the presence of major players, alongside the rapid adoption of AR/VR technologies and the rollout of 5G networks, provides a strong foundation for market expansion. North America's well-established infrastructure and innovation ecosystem continue to support the region's leadership in volumetric video.
The Asia-Pacific region is expected to be the fastest-growing segment in the volumetric video market during the forecast period from 2024 to 2032. The growth is attributed to the rising investment in AR/VR technologies and the growing demand for immersive content across sectors such as entertainment, gaming, and education, along with the rapid rollout of 5G infrastructure. Moreover, key drivers facilitating the deployment of the volumetric video technologies include the region's growing consumer base, especially in countries such as China, Japan, and India. Strong government initiatives and technological advancements also back the growth of the Asia-Pacific market.
Get Customized Report as per your Business Requirement - Request For Customized Report
Some of the Major players in Volumetric Video Market along with their product:
Microsoft Corporation (USA) [Azure Cloud, Mixed Reality solutions, volumetric video rendering]
Intel Corporation (USA) [Processors, 3D camera solutions, AI for volumetric capture]
Google LLC (USA) [AR/VR solutions, software tools for volumetric video]
Meta Platforms (USA) [Oculus VR, volumetric capture technology for immersive experiences]
8i Co. (New Zealand) [Volumetric video production tools and platforms]
Sony Corporation (Japan) [Cameras, 360-degree video capture, VR solutions]
Unity Technologies (USA) [Real-time 3D rendering and development platform for volumetric video]
4Dviews (France) [Volumetric capture systems for 3D video production]
8i (New Zealand) [Volumetric video content creation and distribution platform]
Alphabet (USA) [Google AR/VR tools, volumetric video encoding, and playback]
Canon (Japan) [Cameras and imaging technology for 3D volumetric capture]
Capturing Reality (Slovakia) [Photogrammetry software for creating 3D models from volumetric video]
Coretec Group (USA) [Technologies for advanced volumetric video display and capture]
Dimension (UK) [Volumetric video and holographic content creation]
Evercoast (USA) [Volumetric video production and software for immersive media experiences]
IO Industries (Canada) [Cameras and systems for high-resolution volumetric video capture]
Mark Roberts Motion Control (UK) [Camera motion control systems for volumetric video applications]
Metastage (USA) [Volumetric capture studio and software services]
Mod Tech Labs (USA) [3D scanning, motion capture, and volumetric video solutions]
Scatter (USA) [Volumetric video technology for capturing and viewing immersive content]
Sony Corporation (Japan) [Cameras for volumetric video production]
Stereolabs (USA) [3D cameras and sensors for immersive volumetric video experiences]
Unity Technologies (USA) [Volumetric video development and real-time rendering platform]
Verizon Communications (USA) [5G infrastructure to support volumetric video streaming]
Vividq (UK) [Holographic and volumetric video solutions for AR and VR]
List of Suppliers that provide raw materials and components for the volumetric video market:
Intel Corporation
NVIDIA Corporation
Qualcomm
Sony Corporation
Canon
Microsoft Corporation
Panasonic Corporation
Vicon Motion Systems
GoPro
Red Digital Cinema
Himax Technologies
Lytro
Oculus (Meta Platforms)
ARHT Media
Vuzix Corporation
On May 22, 2024, Microsoft introduced 'Volumetric Apps' at the Microsoft Build 2024 event, to connect Windows and Meta Quest for advanced functionality like positioning windows in a 3D space and touching. To enable experiences like Apple Vision Pro, this is the intention of the feature.
On August 9, 2024, , Intel broadcast technology lead Courtney Willock spoke about how Intel is backing Olympic Broadcasting Services (OBS) for the Olympics this summer, specifically AI-generated clipping, production virtualization and volumetric capture and AR tech.
Report Attributes | Details |
Market Size in 2023 | USD 2.6 Billion |
Market Size by 2032 | USD 24.23 Billion |
CAGR | CAGR of 28.15 % From 2024 to 2032 |
Base Year | 2023 |
Forecast Period | 2024-2032 |
Historical Data | 2020-2022 |
Report Scope & Coverage | Market Size, Segments Analysis, Competitive Landscape, Regional Analysis, DROC & SWOT Analysis, Forecast Outlook |
Key Segments | • By Volumetric Capture (Hardware, Software, Service) • By Delivery Platforms (Projectors, AR/VR HMDs, Smartphones, Volumetric Displays) • By Application (Sports, events, & entertainment, Medical, Education & training, Signage & advertisement, Others) |
Regional Analysis/Coverage | North America (US, Canada, Mexico), Europe (Eastern Europe [Poland, Romania, Hungary, Turkey, Rest of Eastern Europe] Western Europe] Germany, France, UK, Italy, Spain, Netherlands, Switzerland, Austria, Rest of Western Europe]), Asia Pacific (China, India, Japan, South Korea, Vietnam, Singapore, Australia, Rest of Asia Pacific), Middle East & Africa (Middle East [UAE, Egypt, Saudi Arabia, Qatar, Rest of Middle East], Africa [Nigeria, South Africa, Rest of Africa], Latin America (Brazil, Argentina, Colombia, Rest of Latin America) |
Company Profiles | Microsoft, Intel, Google, Meta, 8i, Sony, Unity Technologies, 4Dviews, Alphabet, Canon, Capturing Reality, Coretec Group, Dimension, Evercoast, IO Industries, Mark Roberts Motion Control, Metastage, Mod Tech Labs, Scatter, Stereolabs, Verizon Communications, and Vividq. |
Ans: The Volumetric Video Market is expected to grow at a CAGR of 28.15 % during 2024-2032.
Ans: The Volumetric Video Market was USD 2.6 billion in 2023 and is expected to Reach USD 24.23billion by 2032.
Ans: Key drivers of the Volumetric Video Market include the rising demand for immersive experiences, advancements in AR/VR, and the growth of 5G and interactive media applications.
Ans: The “Hardware” segment dominated the Volumetric Video Market.
Ans: North America dominated the Volumetric Video Market in 2023
1. Introduction
1.1 Market Definition
1.2 Scope (Inclusion and Exclusions)
1.3 Research Assumptions
2. Executive Summary
2.1 Market Overview
2.2 Regional Synopsis
2.3 Competitive Summary
3. Research Methodology
3.1 Top-Down Approach
3.2 Bottom-up Approach
3.3. Data Validation
3.4 Primary Interviews
4. Market Dynamics Impact Analysis
4.1 Market Driving Factors Analysis
4.1.1 Drivers
4.1.2 Restraints
4.1.3 Opportunities
4.1.4 Challenges
4.2 PESTLE Analysis
4.3 Porter’s Five Forces Model
5. Statistical Insights and Trends Reporting
5.1 Technological Trends
5.2 Regulatory and Ethical Considerations
5.3 Regulatory Impact: Effects of regulations on production and usage.
6. Competitive Landscape
6.1 List of Major Companies, By Region
6.2 Market Share Analysis, By Region
6.3 Product Benchmarking
6.3.1 Product specifications and features
6.3.2 Pricing
6.4 Strategic Initiatives
6.4.1 Marketing and promotional activities
6.4.2 Distribution and supply chain strategies
6.4.3 Expansion plans and new product launches
6.4.4 Strategic partnerships and collaborations
6.5 Technological Advancements
6.6 Market Positioning and Branding
7. Volumetric Video Market Segmentation, by Volumetric Capture
7.1 Chapter Overview
7.2 Hardware
7.2.1 Hardware Market Trends Analysis (2020-2032)
7.2.2 Hardware Market Size Estimates and Forecasts to 2032 (USD Billion)
7.3 Software
7.3.1 Software Market Trends Analysis (2020-2032)
7.3.2 Software Market Size Estimates and Forecasts to 2032 (USD Billion)
7.4 Service
7.4.1 Service Market Trends Analysis (2020-2032)
7.4.2 Service Market Size Estimates and Forecasts to 2032 (USD Billion)
8. Volumetric Video Market Segmentation, by Delivery Platforms
8.1 Chapter Overview
8.2 Laser Guidance
8.2.1 Projectors Market Trends Analysis (2020-2032)
8.2.2 Projectors Market Size Estimates and Forecasts to 2032 (USD Billion)
8.3 AR/VR HMDs
8.3.1 AR/VR HMDs Market Trends Analysis (2020-2032)
8.3.2 AR/VR HMDs Market Size Estimates and Forecasts to 2032 (USD Billion)
8.4 Smartphones
8.4.1 Smartphones Market Trends Analysis (2020-2032)
8.4.2 Smartphones Market Size Estimates and Forecasts to 2032 (USD Billion)
8.5 Volumetric Displays
8.5.1 Volumetric Displays Market Trends Analysis (2020-2032)
8.5.2 Volumetric Displays Market Size Estimates and Forecasts to 2032 (USD Billion)
9. Volumetric Video Market Segmentation, by Application
9.1 Chapter Overview
9.2 Sports, events, & entertainment
9.2.1 Sports, events, & entertainment Market Trends Analysis (2020-2032)
9.2.2 Sports, events, & entertainment Market Size Estimates and Forecasts to 2032 (USD Billion)
9.3 Medical
9.3.1 Medical Market Trends Analysis (2020-2032)
9.3.2 Medical Market Size Estimates and Forecasts to 2032 (USD Billion)
9.4 Education & training
9.4.1 Education & training Market Trends Analysis (2020-2032)
9.4.2 Education & training Market Size Estimates and Forecasts to 2032 (USD Billion)
9.5 Signage & advertisement
9.5.1 Signage & advertisement Market Trends Analysis (2020-2032)
9.5.2 Signage & advertisement Market Size Estimates and Forecasts to 2032 (USD Billion)
9.6 Others
9.6.1 Others Market Trends Analysis (2020-2032)
9.6.2 Others Market Size Estimates and Forecasts to 2032 (USD Billion)
10. Regional Analysis
10.1 Chapter Overview
10.2 North America
10.2.1 Trends Analysis
10.2.2 North America Volumetric Video Market Estimates and Forecasts, by Country (2020-2032) (USD Billion)
10.2.3 North America Volumetric Video Market Estimates and Forecasts, by Volumetric Capture (2020-2032) (USD Billion)
10.2.4 North America Volumetric Video Market Estimates and Forecasts, by Delivery Platforms (2020-2032) (USD Billion)
10.2.5 North America Volumetric Video Market Estimates and Forecasts, by Application (2020-2032) (USD Billion)
10.2.6 USA
10.2.6.1 USA Volumetric Video Market Estimates and Forecasts, by Volumetric Capture (2020-2032) (USD Billion)
10.2.6.2 USA Volumetric Video Market Estimates and Forecasts, by Delivery Platforms (2020-2032) (USD Billion)
10.2.6.3 USA Volumetric Video Market Estimates and Forecasts, by Application (2020-2032) (USD Billion)
10.2.7 Canada
10.2.7.1 Canada Volumetric Video Market Estimates and Forecasts, by Volumetric Capture (2020-2032) (USD Billion)
10.2.7.2 Canada Volumetric Video Market Estimates and Forecasts, by Delivery Platforms (2020-2032) (USD Billion)
10.2.7.3 Canada Volumetric Video Market Estimates and Forecasts, by Application (2020-2032) (USD Billion)
10.2.8 Mexico
10.2.8.1 Mexico Volumetric Video Market Estimates and Forecasts, by Volumetric Capture (2020-2032) (USD Billion)
10.2.8.2 Mexico Volumetric Video Market Estimates and Forecasts, by Delivery Platforms (2020-2032) (USD Billion)
10.2.8.3 Mexico Volumetric Video Market Estimates and Forecasts, by Application (2020-2032) (USD Billion)
10.3 Europe
10.3.1 Eastern Europe
10.3.1.1 Trends Analysis
10.3.1.2 Eastern Europe Volumetric Video Market Estimates and Forecasts, by Country (2020-2032) (USD Billion)
10.3.1.3 Eastern Europe Volumetric Video Market Estimates and Forecasts, by Volumetric Capture (2020-2032) (USD Billion)
10.3.1.4 Eastern Europe Volumetric Video Market Estimates and Forecasts, by Delivery Platforms (2020-2032) (USD Billion)
10.3.1.5 Eastern Europe Volumetric Video Market Estimates and Forecasts, by Application (2020-2032) (USD Billion)
10.3.1.6 Poland
10.3.1.6.1 Poland Volumetric Video Market Estimates and Forecasts, by Volumetric Capture (2020-2032) (USD Billion)
10.3.1.6.2 Poland Volumetric Video Market Estimates and Forecasts, by Delivery Platforms (2020-2032) (USD Billion)
10.3.1.6.3 Poland Volumetric Video Market Estimates and Forecasts, by Application (2020-2032) (USD Billion)
10.3.1.7 Romania
10.3.1.7.1 Romania Volumetric Video Market Estimates and Forecasts, by Volumetric Capture (2020-2032) (USD Billion)
10.3.1.7.2 Romania Volumetric Video Market Estimates and Forecasts, by Delivery Platforms (2020-2032) (USD Billion)
10.3.1.7.3 Romania Volumetric Video Market Estimates and Forecasts, by Application (2020-2032) (USD Billion)
10.3.1.8 Hungary
10.3.1.8.1 Hungary Volumetric Video Market Estimates and Forecasts, by Volumetric Capture (2020-2032) (USD Billion)
10.3.1.8.2 Hungary Volumetric Video Market Estimates and Forecasts, by Delivery Platforms (2020-2032) (USD Billion)
10.3.1.8.3 Hungary Volumetric Video Market Estimates and Forecasts, by Application (2020-2032) (USD Billion)
10.3.1.9 Turkey
10.3.1.9.1 Turkey Volumetric Video Market Estimates and Forecasts, by Volumetric Capture (2020-2032) (USD Billion)
10.3.1.9.2 Turkey Volumetric Video Market Estimates and Forecasts, by Delivery Platforms (2020-2032) (USD Billion)
10.3.1.9.3 Turkey Volumetric Video Market Estimates and Forecasts, by Application (2020-2032) (USD Billion)
10.3.1.10 Rest of Eastern Europe
10.3.1.10.1 Rest of Eastern Europe Volumetric Video Market Estimates and Forecasts, by Volumetric Capture (2020-2032) (USD Billion)
10.3.1.10.2 Rest of Eastern Europe Volumetric Video Market Estimates and Forecasts, by Delivery Platforms (2020-2032) (USD Billion)
10.3.1.10.3 Rest of Eastern Europe Volumetric Video Market Estimates and Forecasts, by Application (2020-2032) (USD Billion)
10.3.2 Western Europe
10.3.2.1 Trends Analysis
10.3.2.2 Western Europe Volumetric Video Market Estimates and Forecasts, by Country (2020-2032) (USD Billion)
10.3.2.3 Western Europe Volumetric Video Market Estimates and Forecasts, by Volumetric Capture (2020-2032) (USD Billion)
10.3.2.4 Western Europe Volumetric Video Market Estimates and Forecasts, by Delivery Platforms (2020-2032) (USD Billion)
10.3.2.5 Western Europe Volumetric Video Market Estimates and Forecasts, by Application (2020-2032) (USD Billion)
10.3.2.6 Germany
10.3.2.6.1 Germany Volumetric Video Market Estimates and Forecasts, by Volumetric Capture (2020-2032) (USD Billion)
10.3.2.6.2 Germany Volumetric Video Market Estimates and Forecasts, by Delivery Platforms (2020-2032) (USD Billion)
10.3.2.6.3 Germany Volumetric Video Market Estimates and Forecasts, by Application (2020-2032) (USD Billion)
10.3.2.7 France
10.3.2.7.1 France Volumetric Video Market Estimates and Forecasts, by Volumetric Capture (2020-2032) (USD Billion)
10.3.2.7.2 France Volumetric Video Market Estimates and Forecasts, by Delivery Platforms (2020-2032) (USD Billion)
10.3.2.7.3 France Volumetric Video Market Estimates and Forecasts, by Application (2020-2032) (USD Billion)
10.3.2.8 UK
10.3.2.8.1 UK Volumetric Video Market Estimates and Forecasts, by Volumetric Capture (2020-2032) (USD Billion)
10.3.2.8.2 UK Volumetric Video Market Estimates and Forecasts, by Delivery Platforms (2020-2032) (USD Billion)
10.3.2.8.3 UK Volumetric Video Market Estimates and Forecasts, by Application (2020-2032) (USD Billion)
10.3.2.9 Italy
10.3.2.9.1 Italy Volumetric Video Market Estimates and Forecasts, by Volumetric Capture (2020-2032) (USD Billion)
10.3.2.9.2 Italy Volumetric Video Market Estimates and Forecasts, by Delivery Platforms (2020-2032) (USD Billion)
10.3.2.9.3 Italy Volumetric Video Market Estimates and Forecasts, by Application (2020-2032) (USD Billion)
10.3.2.10 Spain
10.3.2.10.1 Spain Volumetric Video Market Estimates and Forecasts, by Volumetric Capture (2020-2032) (USD Billion)
10.3.2.10.2 Spain Volumetric Video Market Estimates and Forecasts, by Delivery Platforms (2020-2032) (USD Billion)
10.3.2.10.3 Spain Volumetric Video Market Estimates and Forecasts, by Application (2020-2032) (USD Billion)
10.3.2.11 Netherlands
10.3.2.11.1 Netherlands Volumetric Video Market Estimates and Forecasts, by Volumetric Capture (2020-2032) (USD Billion)
10.3.2.11.2 Netherlands Volumetric Video Market Estimates and Forecasts, by Delivery Platforms (2020-2032) (USD Billion)
10.3.2.11.3 Netherlands Volumetric Video Market Estimates and Forecasts, by Application (2020-2032) (USD Billion)
10.3.2.12 Switzerland
10.3.2.12.1 Switzerland Volumetric Video Market Estimates and Forecasts, by Volumetric Capture (2020-2032) (USD Billion)
10.3.2.12.2 Switzerland Volumetric Video Market Estimates and Forecasts, by Delivery Platforms (2020-2032) (USD Billion)
10.3.2.12.3 Switzerland Volumetric Video Market Estimates and Forecasts, by Application (2020-2032) (USD Billion)
10.3.2.13 Austria
10.3.2.13.1 Austria Volumetric Video Market Estimates and Forecasts, by Volumetric Capture (2020-2032) (USD Billion)
10.3.2.13.2 Austria Volumetric Video Market Estimates and Forecasts, by Delivery Platforms (2020-2032) (USD Billion)
10.3.2.13.3 Austria Volumetric Video Market Estimates and Forecasts, by Application (2020-2032) (USD Billion)
10.3.2.14 Rest of Western Europe
10.3.2.14.1 Rest of Western Europe Volumetric Video Market Estimates and Forecasts, by Volumetric Capture (2020-2032) (USD Billion)
10.3.2.14.2 Rest of Western Europe Volumetric Video Market Estimates and Forecasts, by Delivery Platforms (2020-2032) (USD Billion)
10.3.2.14.3 Rest of Western Europe Volumetric Video Market Estimates and Forecasts, by Application (2020-2032) (USD Billion)
10.4 Asia-Pacific
10.4.1 Trends Analysis
10.4.2 Asia-Pacific Volumetric Video Market Estimates and Forecasts, by Country (2020-2032) (USD Billion)
10.4.3 Asia-Pacific Volumetric Video Market Estimates and Forecasts, by Volumetric Capture (2020-2032) (USD Billion)
10.4.4 Asia-Pacific Volumetric Video Market Estimates and Forecasts, by Delivery Platforms (2020-2032) (USD Billion)
10.4.5 Asia-Pacific Volumetric Video Market Estimates and Forecasts, by Application (2020-2032) (USD Billion)
10.4.6 China
10.4.6.1 China Volumetric Video Market Estimates and Forecasts, by Volumetric Capture (2020-2032) (USD Billion)
10.4.6.2 China Volumetric Video Market Estimates and Forecasts, by Delivery Platforms (2020-2032) (USD Billion)
10.4.6.3 China Volumetric Video Market Estimates and Forecasts, by Application (2020-2032) (USD Billion)
10.4.7 India
10.4.7.1 India Volumetric Video Market Estimates and Forecasts, by Volumetric Capture (2020-2032) (USD Billion)
10.4.7.2 India Volumetric Video Market Estimates and Forecasts, by Delivery Platforms (2020-2032) (USD Billion)
10.4.7.3 India Volumetric Video Market Estimates and Forecasts, by Application (2020-2032) (USD Billion)
10.4.8 Japan
10.4.8.1 Japan Volumetric Video Market Estimates and Forecasts, by Volumetric Capture (2020-2032) (USD Billion)
10.4.8.2 Japan Volumetric Video Market Estimates and Forecasts, by Delivery Platforms (2020-2032) (USD Billion)
10.4.8.3 Japan Volumetric Video Market Estimates and Forecasts, by Application (2020-2032) (USD Billion)
10.4.9 South Korea
10.4.9.1 South Korea Volumetric Video Market Estimates and Forecasts, by Volumetric Capture (2020-2032) (USD Billion)
10.4.9.2 South Korea Volumetric Video Market Estimates and Forecasts, by Delivery Platforms (2020-2032) (USD Billion)
10.4.9.3 South Korea Volumetric Video Market Estimates and Forecasts, by Application (2020-2032) (USD Billion)
10.4.10 Vietnam
10.4.10.1 Vietnam Volumetric Video Market Estimates and Forecasts, by Volumetric Capture (2020-2032) (USD Billion)
10.4.10.2 Vietnam Volumetric Video Market Estimates and Forecasts, by Delivery Platforms (2020-2032) (USD Billion)
10.4.10.3 Vietnam Volumetric Video Market Estimates and Forecasts, by Application (2020-2032) (USD Billion)
10.4.11 Singapore
10.4.11.1 Singapore Volumetric Video Market Estimates and Forecasts, by Volumetric Capture (2020-2032) (USD Billion)
10.4.11.2 Singapore Volumetric Video Market Estimates and Forecasts, by Delivery Platforms (2020-2032) (USD Billion)
10.4.11.3 Singapore Volumetric Video Market Estimates and Forecasts, by Application (2020-2032) (USD Billion)
10.4.12 Australia
10.4.12.1 Australia Volumetric Video Market Estimates and Forecasts, by Volumetric Capture (2020-2032) (USD Billion)
10.4.12.2 Australia Volumetric Video Market Estimates and Forecasts, by Delivery Platforms (2020-2032) (USD Billion)
10.4.12.3 Australia Volumetric Video Market Estimates and Forecasts, by Application (2020-2032) (USD Billion)
10.4.13 Rest of Asia-Pacific
10.4.13.1 Rest of Asia-Pacific Volumetric Video Market Estimates and Forecasts, by Volumetric Capture (2020-2032) (USD Billion)
10.4.13.2 Rest of Asia-Pacific Volumetric Video Market Estimates and Forecasts, by Delivery Platforms (2020-2032) (USD Billion)
10.4.13.3 Rest of Asia-Pacific Volumetric Video Market Estimates and Forecasts, by Application (2020-2032) (USD Billion)
10.5 Middle East and Africa
10.5.1 Middle East
10.5.1.1 Trends Analysis
10.5.1.2 Middle East Volumetric Video Market Estimates and Forecasts, by Country (2020-2032) (USD Billion)
10.5.1.3 Middle East Volumetric Video Market Estimates and Forecasts, by Volumetric Capture (2020-2032) (USD Billion)
10.5.1.4 Middle East Volumetric Video Market Estimates and Forecasts, by Delivery Platforms (2020-2032) (USD Billion)
10.5.1.5 Middle East Volumetric Video Market Estimates and Forecasts, by Application (2020-2032) (USD Billion)
10.5.1.6 UAE
10.5.1.6.1 UAE Volumetric Video Market Estimates and Forecasts, by Volumetric Capture (2020-2032) (USD Billion)
10.5.1.6.2 UAE Volumetric Video Market Estimates and Forecasts, by Delivery Platforms (2020-2032) (USD Billion)
10.5.1.6.3 UAE Volumetric Video Market Estimates and Forecasts, by Application (2020-2032) (USD Billion)
10.5.1.7 Egypt
10.5.1.7.1 Egypt Volumetric Video Market Estimates and Forecasts, by Volumetric Capture (2020-2032) (USD Billion)
10.5.1.7.2 Egypt Volumetric Video Market Estimates and Forecasts, by Delivery Platforms (2020-2032) (USD Billion)
10.5.1.7.3 Egypt Volumetric Video Market Estimates and Forecasts, by Application (2020-2032) (USD Billion)
10.5.1.8 Saudi Arabia
10.5.1.8.1 Saudi Arabia Volumetric Video Market Estimates and Forecasts, by Volumetric Capture (2020-2032) (USD Billion)
10.5.1.8.2 Saudi Arabia Volumetric Video Market Estimates and Forecasts, by Delivery Platforms (2020-2032) (USD Billion)
10.5.1.8.3 Saudi Arabia Volumetric Video Market Estimates and Forecasts, by Application (2020-2032) (USD Billion)
10.5.1.9 Qatar
10.5.1.9.1 Qatar Volumetric Video Market Estimates and Forecasts, by Volumetric Capture (2020-2032) (USD Billion)
10.5.1.9.2 Qatar Volumetric Video Market Estimates and Forecasts, by Delivery Platforms (2020-2032) (USD Billion)
10.5.1.9.3 Qatar Volumetric Video Market Estimates and Forecasts, by Application (2020-2032) (USD Billion)
10.5.1.10 Rest of Middle East
10.5.1.10.1 Rest of Middle East Volumetric Video Market Estimates and Forecasts, by Volumetric Capture (2020-2032) (USD Billion)
10.5.1.10.2 Rest of Middle East Volumetric Video Market Estimates and Forecasts, by Delivery Platforms (2020-2032) (USD Billion)
10.5.1.10.3 Rest of Middle East Volumetric Video Market Estimates and Forecasts, by Application (2020-2032) (USD Billion)
10.5.2 Africa
10.5.2.1 Trends Analysis
10.5.2.2 Africa Volumetric Video Market Estimates and Forecasts, by Country (2020-2032) (USD Billion)
10.5.2.3 Africa Volumetric Video Market Estimates and Forecasts, by Volumetric Capture (2020-2032) (USD Billion)
10.5.2.4 Africa Volumetric Video Market Estimates and Forecasts, by Delivery Platforms (2020-2032) (USD Billion)
10.5.2.5 Africa Volumetric Video Market Estimates and Forecasts, by Application (2020-2032) (USD Billion)
10.5.2.6 South Africa
10.5.2.6.1 South Africa Volumetric Video Market Estimates and Forecasts, by Volumetric Capture (2020-2032) (USD Billion)
10.5.2.6.2 South Africa Volumetric Video Market Estimates and Forecasts, by Delivery Platforms (2020-2032) (USD Billion)
10.5.2.6.3 South Africa Volumetric Video Market Estimates and Forecasts, by Application (2020-2032) (USD Billion)
10.5.2.7 Nigeria
10.5.2.7.1 Nigeria Volumetric Video Market Estimates and Forecasts, by Volumetric Capture (2020-2032) (USD Billion)
10.5.2.7.2 Nigeria Volumetric Video Market Estimates and Forecasts, by Delivery Platforms (2020-2032) (USD Billion)
10.5.2.7.3 Nigeria Volumetric Video Market Estimates and Forecasts, by Application (2020-2032) (USD Billion)
10.5.2.8 Rest of Africa
10.5.2.8.1 Rest of Africa Volumetric Video Market Estimates and Forecasts, by Volumetric Capture (2020-2032) (USD Billion)
10.5.2.8.2 Rest of Africa Volumetric Video Market Estimates and Forecasts, by Delivery Platforms (2020-2032) (USD Billion)
10.5.2.8.3 Rest of Africa Volumetric Video Market Estimates and Forecasts, by Application (2020-2032) (USD Billion)
10.6 Latin America
10.6.1 Trends Analysis
10.6.2 Latin America Volumetric Video Market Estimates and Forecasts, by Country (2020-2032) (USD Billion)
10.6.3 Latin America Volumetric Video Market Estimates and Forecasts, by Volumetric Capture (2020-2032) (USD Billion)
10.6.4 Latin America Volumetric Video Market Estimates and Forecasts, by Delivery Platforms (2020-2032) (USD Billion)
10.6.5 Latin America Volumetric Video Market Estimates and Forecasts, by Application (2020-2032) (USD Billion)
10.6.6 Brazil
10.6.6.1 Brazil Volumetric Video Market Estimates and Forecasts, by Volumetric Capture (2020-2032) (USD Billion)
10.6.6.2 Brazil Volumetric Video Market Estimates and Forecasts, by Delivery Platforms (2020-2032) (USD Billion)
10.6.6.3 Brazil Volumetric Video Market Estimates and Forecasts, by Application (2020-2032) (USD Billion)
10.6.7 Argentina
10.6.7.1 Argentina Volumetric Video Market Estimates and Forecasts, by Volumetric Capture (2020-2032) (USD Billion)
10.6.7.2 Argentina Volumetric Video Market Estimates and Forecasts, by Delivery Platforms (2020-2032) (USD Billion)
10.6.7.3 Argentina Volumetric Video Market Estimates and Forecasts, by Application (2020-2032) (USD Billion)
10.6.8 Colombia
10.6.8.1 Colombia Volumetric Video Market Estimates and Forecasts, by Volumetric Capture (2020-2032) (USD Billion)
10.6.8.2 Colombia Volumetric Video Market Estimates and Forecasts, by Delivery Platforms (2020-2032) (USD Billion)
10.6.8.3 Colombia Volumetric Video Market Estimates and Forecasts, by Application (2020-2032) (USD Billion)
10.6.9 Rest of Latin America
10.6.9.1 Rest of Latin America Volumetric Video Market Estimates and Forecasts, by Volumetric Capture (2020-2032) (USD Billion)
10.6.9.2 Rest of Latin America Volumetric Video Market Estimates and Forecasts, by Delivery Platforms (2020-2032) (USD Billion)
10.6.9.3 Rest of Latin America Volumetric Video Market Estimates and Forecasts, by Application (2020-2032) (USD Billion)
11. Company Profiles
11.1 Microsoft
11.1.1 Company Overview
11.1.2 Financial
11.1.3 Products/ Services Offered
11.1.4 SWOT Analysis
11.2 Intel
11.2.1 Company Overview
11.2.2 Financial
11.2.3 Products/ Services Offered
11.2.4 SWOT Analysis
11.3 Google
11.3.1 Company Overview
11.3.2 Financial
11.3.3 Products/ Services Offered
11.3.4 SWOT Analysis
11.4 Meta
11.4.1 Company Overview
11.4.2 Financial
11.4.3 Products/ Services Offered
11.4.4 SWOT Analysis
11.5 8i
11.5.1 Company Overview
11.5.2 Financial
11.5.3 Products/ Services Offered
11.5.4 SWOT Analysis
11.6 Sony
11.6.1 Company Overview
11.6.2 Financial
11.6.3 Products/ Services Offered
11.6.4 SWOT Analysis
11.7 Unity Technologies
11.7.1 Company Overview
11.7.2 Financial
11.7.3 Products/ Services Offered
11.7.4 SWOT Analysis
11.8 4Dviews
11.8.1 Company Overview
11.8.2 Financial
11.8.3 Products/ Services Offered
11.8.4 SWOT Analysis
11.9 Alphabet
11.9.1 Company Overview
11.9.2 Financial
11.9.3 Products/ Services Offered
11.9.4 SWOT Analysis
11.10 Canon
11.10.1 Company Overview
11.10.2 Financial
11.10.3 Products/ Services Offered
11.10.4 SWOT Analysis
12. Use Cases and Best Practices
13. Conclusion
An accurate research report requires proper strategizing as well as implementation. There are multiple factors involved in the completion of good and accurate research report and selecting the best methodology to compete the research is the toughest part. Since the research reports we provide play a crucial role in any company’s decision-making process, therefore we at SNS Insider always believe that we should choose the best method which gives us results closer to reality. This allows us to reach at a stage wherein we can provide our clients best and accurate investment to output ratio.
Each report that we prepare takes a timeframe of 350-400 business hours for production. Starting from the selection of titles through a couple of in-depth brain storming session to the final QC process before uploading our titles on our website we dedicate around 350 working hours. The titles are selected based on their current market cap and the foreseen CAGR and growth.
The 5 steps process:
Step 1: Secondary Research:
Secondary Research or Desk Research is as the name suggests is a research process wherein, we collect data through the readily available information. In this process we use various paid and unpaid databases which our team has access to and gather data through the same. This includes examining of listed companies’ annual reports, Journals, SEC filling etc. Apart from this our team has access to various associations across the globe across different industries. Lastly, we have exchange relationships with various university as well as individual libraries.
Step 2: Primary Research
When we talk about primary research, it is a type of study in which the researchers collect relevant data samples directly, rather than relying on previously collected data. This type of research is focused on gaining content specific facts that can be sued to solve specific problems. Since the collected data is fresh and first hand therefore it makes the study more accurate and genuine.
We at SNS Insider have divided Primary Research into 2 parts.
Part 1 wherein we interview the KOLs of major players as well as the upcoming ones across various geographic regions. This allows us to have their view over the market scenario and acts as an important tool to come closer to the accurate market numbers. As many as 45 paid and unpaid primary interviews are taken from both the demand and supply side of the industry to make sure we land at an accurate judgement and analysis of the market.
This step involves the triangulation of data wherein our team analyses the interview transcripts, online survey responses and observation of on filed participants. The below mentioned chart should give a better understanding of the part 1 of the primary interview.
Part 2: In this part of primary research the data collected via secondary research and the part 1 of the primary research is validated with the interviews from individual consultants and subject matter experts.
Consultants are those set of people who have at least 12 years of experience and expertise within the industry whereas Subject Matter Experts are those with at least 15 years of experience behind their back within the same space. The data with the help of two main processes i.e., FGDs (Focused Group Discussions) and IDs (Individual Discussions). This gives us a 3rd party nonbiased primary view of the market scenario making it a more dependable one while collation of the data pointers.
Step 3: Data Bank Validation
Once all the information is collected via primary and secondary sources, we run that information for data validation. At our intelligence centre our research heads track a lot of information related to the market which includes the quarterly reports, the daily stock prices, and other relevant information. Our data bank server gets updated every fortnight and that is how the information which we collected using our primary and secondary information is revalidated in real time.
Step 4: QA/QC Process
After all the data collection and validation our team does a final level of quality check and quality assurance to get rid of any unwanted or undesired mistakes. This might include but not limited to getting rid of the any typos, duplication of numbers or missing of any important information. The people involved in this process include technical content writers, research heads and graphics people. Once this process is completed the title gets uploader on our platform for our clients to read it.
Step 5: Final QC/QA Process:
This is the last process and comes when the client has ordered the study. In this process a final QA/QC is done before the study is emailed to the client. Since we believe in giving our clients a good experience of our research studies, therefore, to make sure that we do not lack at our end in any way humanly possible we do a final round of quality check and then dispatch the study to the client.
By Volumetric Capture
Hardware
Software
Service
By Delivery Platforms
Projectors
AR/VR HMDs
Smartphones
By Application
Sports, events, & entertainment
Medical
Education & training
Signage & advertisement
Others
Request for Segment Customization as per your Business Requirement: Segment Customization Request
Regional Coverage:
North America
US
Canada
Mexico
Europe
Eastern Europe
Poland
Romania
Hungary
Turkey
Rest of Eastern Europe
Western Europe
Germany
France
UK
Italy
Spain
Netherlands
Switzerland
Austria
Rest of Western Europe
Asia Pacific
China
India
Japan
South Korea
Vietnam
Singapore
Australia
Rest of Asia Pacific
Middle East & Africa
Middle East
UAE
Egypt
Saudi Arabia
Qatar
Rest of Middle East
Africa
Nigeria
South Africa
Rest of Africa
Latin America
Brazil
Argentina
Colombia
Rest of Latin America
Request for Country Level Research Report: Country Level Customization Request
Available Customization
With the given market data, SNS Insider offers customization as per the company’s specific needs. The following customization options are available for the report:
Detailed Volume Analysis
Criss-Cross segment analysis (e.g. Product X Application)
Competitive Product Benchmarking
Geographic Analysis
Additional countries in any of the regions
Customized Data Representation
Detailed analysis and profiling of additional market players
Data Center Interconnect Market Size was valued at USD 11.45 billion in 2023 and is expected to reach USD 37.53 billion by 2032 and grow at a CAGR of 14.1% over the forecast period 2024-2032.
The 3D Metrology Market Size was valued at USD 10.88 Billion in 2023 and is expected to grow at a CAGR of 7.97% to reach USD 21.69 Billion by 2032.
The Livestock Identification Market Size was valued at USD 1.79 Billion in 2023 and is expected to reach USD 3.99 Billion by 2032 and grow at a CAGR of 9.77% over the forecast period 2024-2032.
The Drone Camera Market Size was valued at USD 14.20 billion in 2023 and is expected to reach USD 145.45 billion by 2032 and grow at a CAGR of 29.5% over the forecast period 2024-2032.
The Field Programmable Gate Array (FPGA) Market Size was valued at USD 11.15 Billion in 2023 and is expected to grow at a CAGR of 12.0% From 2024-2032.
The Passive Optical Network Market Size was valued at USD 14.44 Billion in 2023 and is expected to reach USD 49.03 Billion by 2032 and grow at a CAGR of 14.55% over the forecast period 2024-2032.
Hi! Click one of our member below to chat on Phone