Get More Information on Vitrification Market - Request Sample Report
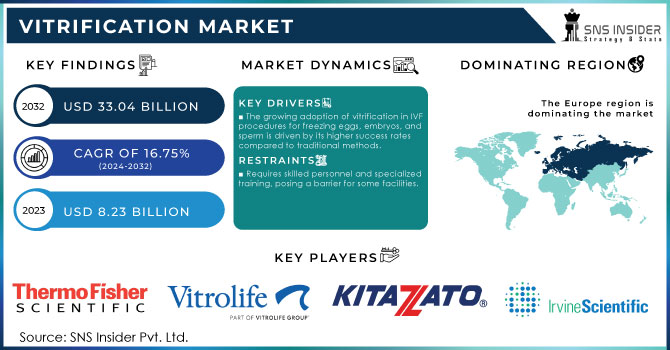
The Vitrification Market Size was valued at USD 8.23 billion in 2023 and is expected to reach USD 33.04 billion by 2032 and grow at a CAGR of 16.75% from 2024-2032.
In recent years, the most relevant growing trend is in the vitrification market, specifically in cryopreservation and reproductive medicine. Vitrification is a rapid freezing technique that prevents ice crystal formation in cells, tissues, and biological samples, making it more effective at preserving these materials compared to traditional slow-freezing methods. Major market drivers include the increasing demand in the market for assisted reproductive technologies, where eggs, embryos, and sperm are vitrified to be frozen. The trends in cryopreservation technologies facilitated better effectiveness and safety of vitrification, thus making vitrification a well-established procedure in a high number of laboratories.
One more growth driver is the broader adoption of vitrification in biobanking. Biobanks store biological samples for future or ongoing research, drug development and testing, and personalized medicine. For Instance, the adoption of vitrification techniques is expected to see an increase, particularly with more than 60% of biobanks utilizing these methods to preserve biological samples effectively. Growing investments into research and development boosted the biobanking industry and, subsequently, the demand for vitrification. In addition, a larger number of cancer patients undergoing chemotherapy and radiotherapy are likely to need preservation of their fertility and biobanks can provide required services. The need for costly equipment and devices along with high costs may pose certain obstacles to market growth, however, it is expected to remain the demand driver alongside technological advancements.
Drivers
The growing adoption of vitrification in IVF procedures for freezing eggs, embryos, and sperm is driven by its higher success rates compared to traditional methods.
Rising infertility rates globally are boosting the demand for ART services, thereby driving the vitrification market.
Vitrification's role in preserving stem cells for regenerative medicine and research is contributing to its market expansion.
Vitrification is essential for effectively preserving stem cells, which are vital for advancements in regenerative medicine and research. Unlike traditional freezing methods that risk damaging cells through ice crystal formation, vitrification employs rapid freezing techniques that maintain the structural integrity and functionality of stem cells. This preservation is critical for various applications, including tissue engineering, organ regeneration, and cell therapy, all of which depend on high-quality stem cells. The growing emphasis on stem cell research, driven by the need for innovative therapies for chronic diseases such as diabetes, Parkinson's, and heart conditions, is increasing the demand for vitrification. Additionally, a rise in clinical trials and heightened investment from both governmental and private sectors in regenerative medicine further boosts the need for effective vitrification methods. This synergy highlights the important role of advanced cryopreservation techniques in driving market growth.
Simultaneously, rising infertility rates worldwide are intensifying the demand for Assisted Reproductive Technologies (ART), particularly in vitro fertilization (IVF), where vitrification is commonly employed. Approximately 15% of couples globally experience infertility, translating to around 48.5 million couples affected. Factors like lifestyle changes, delayed parenthood, and various medical conditions contribute to this rise. Vitrification enhances ART by enabling the freezing of eggs, embryos, and sperm with improved survival rates, thereby increasing IVF success rates. As the need for fertility treatments escalates, so does the demand for vitrification, fostering market expansion. The growing number of ART procedures is closely associated with the increased adoption of vitrification techniques worldwide.
Restraints
Requires skilled personnel and specialized training, posing a barrier for some facilities.
Competing cryopreservation methods, like slow freezing, may be preferred due to familiarity.
Potential for sample contamination during the vitrification process.
In the vitrification market, the risk of sample contamination is a critical issue that can significantly affect the safety and viability of preserved biological materials, including eggs, embryos, and tissues. During the vitrification process, samples may be exposed to open environments or handled manually, raising the chances of contamination from airborne particles, microorganisms, or cross-contamination between samples. Such contaminants can jeopardize the integrity of the samples, lower success rates in procedures like IVF, and pose health risks when contaminated materials are used in clinical applications.
Moreover, cryoprotectants essential chemicals that prevent ice formation can add to contamination risks if not handled correctly. This highlights the necessity for stringent quality control, sterile conditions, and trained personnel, which can increase operational costs and complexity for facilities. As a result, these contamination concerns may discourage some clinics from adopting vitrification or limit its broader application, especially in less-equipped or resource-limited settings, thus hindering market growth.
Additionally, the vitrification market encounters competition from traditional cryopreservation methods such as slow freezing, which remains widely accepted among clinicians and laboratories. In the early 2000s, slow freezing was the dominant technique for embryo cryopreservation, capturing about 80% of the market share. Despite vitrification being utilized in around 70-80% of IVF clinics worldwide today, slow freezing continues to be preferred in areas where technological adoption is gradual. Its established protocols, lower initial costs, and perceived ease of use make it appealing for smaller clinics and in developing regions, where moving to vitrification might appear costly or complicated. This reliance on slow freezing practices acts as a barrier to the widespread adoption of vitrification, despite its proven advantages in improving survival rates and outcomes for cryopreserved samples.
By Specimen
In 2023, The oocyte segment dominated the market and represented more than 42.50% market share. The notable revenue share in this segment stems from increased awareness of oocyte preservation, alongside supportive legislation from various governments. Recently, several governments have legalized oocyte preservation, positioning vitrification as a highly effective method in egg banks and assisted reproductive technology (ART).
The sperm segment is expected to witness the highest CAGR of over 18.06% during the forecast period. Advancements in 3D printing are anticipated to introduce innovative methods for developing freezing devices. A study published by MDPI in August 2021 presented a 3D-printed vitrification device tailored for small sperm volumes, known as Cryo-Vials (VDCV). Furthermore, ongoing research is exploring minimal-volume vitrification techniques aimed at enhancing IVF treatment efficacy.
By End-Use
In 2023, the IVF clinics segment held the largest share of 60.15%, primarily due to the growing number of clinics providing vitrification and other assisted reproductive technology (ART) services. These clinics are broadening their range of services to encompass the storage of sperm, eggs, and oocytes, which is anticipated to further enhance their revenue share.
The biobanks segment is expected to exhibit the highest compound annual growth rate (CAGR) of 17.88% throughout the forecast period. The shift from traditional slow-freezing techniques to vitrification has significantly improved the cryobanking processes for eggs, embryos, and sperm. Moreover, the growth of biobanks has streamlined the egg donation process by offering extensive databases of donors and empowering individuals pursuing IVF with donor eggs to make informed decisions. This trend is projected to greatly increase the revenue share of biobanks within the market.
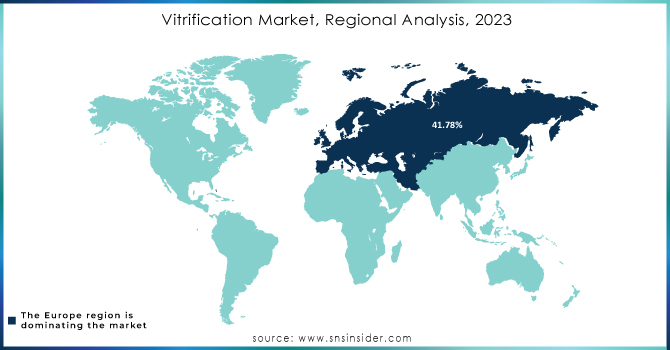
In 2023, Europe captured the largest share of the global vitrification market, holding 41.78%. The strength of the market is mainly generated by developed economies such as Germany, Spain, the UK, France, and Italy, which all have high-quality infrastructure and other favorable conditions enhancing the effectiveness of cryopreservation. The growth drivers are strong biotechnology sectors and rising investments in assisted reproductive technologies in the UK and Germany. The ranking of Germany in the market is determined by several factors: having advanced healthcare infrastructure in place facilitates the more widespread use of state-of-the-art cryopreservation techniques, such as vitrification, in fertility treatments and studies. In addition, Germany has a well-developed system of regulations in place ensuring the high safety, efficacy, and ethical standards appropriately followed both in commercial and research applications of ART. Under these circumstances, patients and healthcare professionals have confidence in the acceptable levels of quality, which is a strong competitive advantage.
The Asia Pacific is expected to demonstrate the highest CAGR of 19.27% which will also be promoted by the wider awareness and possible upcoming legalization of the right for single women to freeze their eggs following the high-profile legal cases changed many existing laws in China.
Need any customization research on Vitrification Market - Enquiry Now
Some major key players are
Vitrolife (Vitrification devices, cryopreservation media)
Kitazato Corporation (Vitrification kits, sperm freezing devices)
Thermo Fisher Scientific (Cryopreservation equipment, media for IVF)
Irvine Scientific (Vitrification solutions, embryo culture media)
Fertility Associates (IVF services, cryopreservation services)
CooperSurgical (Vitrification devices, cryopreservation kits)
Cryoport (Biologics transportation solutions, specimen storage)
ES Diagnostics (Cryopreservation equipment, embryo storage)
Reproductive Health Technologies (IVF equipment, fertility preservation solutions)
ReproTech (Oocyte and embryo cryopreservation, storage services)
Sage Scientific (Vitrification products, media for IVF)
Birmingham Women's Hospital (Fertility treatments, egg freezing services)
OvaScience (Oocyte preservation, fertility treatment services)
Fertility Solutions (IVF and embryo freezing services, vitrification technologies)
CReATe Fertility Centre (IVF services, cryopreservation techniques)
The Center for Reproductive Health (Egg freezing, embryo storage services)
Advanced Fertility Center of Chicago (Fertility preservation, cryopreservation services)
Genea (IVF technology, vitrification kits)
Reproductive Medicine Associates of New Jersey (Fertility services, cryopreservation)
New Hope Fertility Center (IVF treatments, egg freezing)
In July 2023, Ivy Fertility broadened its partnership with TMRW Life Sciences to implement automation in its IVF lab, leveraging TMRW's cutting-edge platform for the secure storage of frozen eggs and embryos.
In December 2021, VitaVitro received marketing approval in China for its Vitrification and Warming Kit, an essential tool for the cooling and warming of oocytes, embryos, and blastocysts.
Report Attributes | Details |
---|---|
Market Size in 2023 | US$ 8.23 billion |
Market Size by 2032 | US$ 33.04 billion |
CAGR | CAGR of 16.75% From 2024 to 2032 |
Base Year | 2023 |
Forecast Period | 2024-2032 |
Historical Data | 2020-2022 |
Report Scope & Coverage | Market Size, Segments Analysis, Competitive Landscape, Regional Analysis, DROC & SWOT Analysis, Forecast Outlook |
Key Segments | • By Specimen (Oocytes, Embryo, Sperm) • By End-Use (IVF Clinics, Biobanks) |
Regional Analysis/Coverage | North America (USA, Canada, Mexico), Europe (Germany, UK, France, Italy, Spain, Netherlands, Rest of Europe), Asia-Pacific (Japan, South Korea, China, India, Australia, Rest of Asia-Pacific), The Middle East & Africa (Israel, UAE, South Africa, Rest of Middle East & Africa), Latin America (Brazil, Argentina, Rest of Latin America) |
Company Profiles | Vitrolife, Kitazato Corporation, Thermo Fisher Scientific, Irvine Scientific, Fertility Associates, CooperSurgical, Cryoport, ES Diagnostics, Reproductive Health Technologies, ReproTech, Sage Scientific, Birmingham Women's Hospital, OvaScience and other players |
Key Drivers | • The growing adoption of vitrification in IVF procedures for freezing eggs, embryos, and sperm is driven by its higher success rates compared to traditional methods. • Rising infertility rates globally are boosting the demand for ART services, thereby driving the vitrification market. • Vitrification's role in preserving stem cells for regenerative medicine and research is contributing to its market expansion. |
Market Restraints | • Requires skilled personnel and specialized training, posing a barrier for some facilities. • Competing cryopreservation methods, like slow freezing, may be preferred due to familiarity. • Potential for sample contamination during the vitrification process. |
ANS- Vitrification Market was valued at USD 8.23 billion in 2023 and is expected to reach USD 33.04 billion by 2032
ANS- The CAGR of the vitrification market is 16.75% during the forecast period
ANS- In 2023, Europe captured the largest share of the global vitrification market, holding 41.78%.
ANS- In 2023, the oocyte freezing segment led the vitrification market.
Ans - In 2023, The oocyte segment dominated the market and represented more than 42.50% market share.
Table of Content
1. Introduction
1.1 Market Definition
1.2 Scope (Inclusion and Exclusions)
1.3 Research Assumptions
2. Executive Summary
2.1 Market Overview
2.2 Regional Synopsis
2.3 Competitive Summary
3. Research Methodology
3.1 Top-Down Approach
3.2 Bottom-up Approach
3.3. Data Validation
3.4 Primary Interviews
4. Market Dynamics
4.1 Market Analysis
4.1.2 Drivers
4.1.2 Restraints
4.1.3 Opportunities
4.1.4 Challenges
4.2 PESTLE Analysis
4.3 Porter’s Five Forces Model
5. Statistical Insights and Trends Reporting
5.1 Incidence of Fertility Preservation Procedures Using Vitrification (2023)
5.2 Adoption Trends of Vitrification Technology, by Region (2023)
5.3 Volume of Vitrification Procedures, by Region (2020-2032)
5.4 Healthcare Spending on Vitrification Technology, by Region (Government, Commercial, Private, Out-of-Pocket), 2023
5.5 Regulatory Compliance and Certification Trends in Vitrification Technology (2023)
5.6 Trends in Success Rates of Vitrification Procedures (2023)
6. Competitive Landscape
6.1 List of Major Companies, By Region
6.2 Market Share Analysis, By Region
6.3 Product Benchmarking
6.3.1 Product specifications and features
6.3.2 Pricing
6.4 Strategic Initiatives
6.4.1 Marketing and promotional activities
6.4.2 Distribution and supply chain strategies
6.4.3 Expansion plans and new product launches
6.4.4 Strategic partnerships and collaborations
6.5 Technological Advancements
6.6 Market Positioning and Branding
7. Vitrification Market Segmentation, by Specimen
7.1 Chapter Overview
7.2 Oocytes
7.2.1 Oocytes Market Trends Analysis (2020-2032)
7.2.2 Oocytes Market Size Estimates and Forecasts to 2032 (USD Billion)
7.2.3 Devices
7.2.3.1 Devices Market Trends Analysis (2020-2032)
7.2.3.2 Devices Market Size Estimates and Forecasts to 2032 (USD Billion)
7.2.4 Kits & Consumables
7.2.4.1 Kits & Consumables Market Trends Analysis (2020-2032)
7.2.4.2 Kits & Consumables Market Size Estimates and Forecasts to 2032 (USD Billion)
7.3 Embryo
7.3.1 Embryo Market Trends Analysis (2020-2032)
7.3.2 Embryo Market Size Estimates and Forecasts to 2032 (USD Billion)
7.3.3 Devices
7.3.3.1 Devices Market Trends Analysis (2020-2032)
7.3.3.2 Devices Market Size Estimates and Forecasts to 2032 (USD Billion)
7.3.4 Kits & Consumables
7.3.4.1 Kits & Consumables Market Trends Analysis (2020-2032)
7.3.4.2 Kits & Consumables Market Size Estimates and Forecasts to 2032 (USD Billion)
7.4 Sperm
7.4.1 Sperm Market Trends Analysis (2020-2032)
7.4.2 Sperm Market Size Estimates and Forecasts to 2032 (USD Billion)
8. Vitrification Market Segmentation, by End Use
8.1 Chapter Overview
8.2 IVF Clinics
8.2.1 IVF Clinics Market Trends Analysis (2020-2032)
8.2.2 IVF Clinics Market Size Estimates and Forecasts to 2032 (USD Billion)
8.3 Biobanks
8.3.1 BiobanksMarket Trends Analysis (2020-2032)
8.3.2 BiobanksMarket Size Estimates and Forecasts to 2032 (USD Billion)
9. Regional Analysis
9.1 Chapter Overview
9.2 North America
9.2.1 Trends Analysis
9.2.2 North America Vitrification Market Estimates and Forecasts, by Country (2020-2032) (USD Billion)
9.2.3 North America Vitrification Market Estimates and Forecasts, by Specimen (2020-2032) (USD Billion)
9.2.4 North America Vitrification Market Estimates and Forecasts, by End Use (2020-2032) (USD Billion)
9.2.5 USA
9.2.5.1 USA Vitrification Market Estimates and Forecasts, by Specimen (2020-2032) (USD Billion)
9.2.5.2 USA Vitrification Market Estimates and Forecasts, by End Use (2020-2032) (USD Billion)
9.2.6 Canada
9.2.6.1 Canada Vitrification Market Estimates and Forecasts, by Specimen (2020-2032) (USD Billion)
9.2.6.2 Canada Vitrification Market Estimates and Forecasts, by End Use (2020-2032) (USD Billion)
9.2.7 Mexico
9.2.7.1 Mexico Vitrification Market Estimates and Forecasts, by Specimen (2020-2032) (USD Billion)
9.2.7.2 Mexico Vitrification Market Estimates and Forecasts, by End Use (2020-2032) (USD Billion)
9.3 Europe
9.3.1 Eastern Europe
9.3.1.1 Trends Analysis
9.3.1.2 Eastern Europe Vitrification Market Estimates and Forecasts, by Country (2020-2032) (USD Billion)
9.3.1.3 Eastern Europe Vitrification Market Estimates and Forecasts, by Specimen (2020-2032) (USD Billion)
9.3.1.4 Eastern Europe Vitrification Market Estimates and Forecasts, by End Use (2020-2032) (USD Billion)
9.3.1.5 Poland
9.3.1.5.1 Poland Vitrification Market Estimates and Forecasts, by Specimen (2020-2032) (USD Billion)
9.3.1.5.2 Poland Vitrification Market Estimates and Forecasts, by End Use (2020-2032) (USD Billion)
9.3.1.6 Romania
9.3.1.6.1 Romania Vitrification Market Estimates and Forecasts, by Specimen (2020-2032) (USD Billion)
9.3.1.6.2 Romania Vitrification Market Estimates and Forecasts, by End Use (2020-2032) (USD Billion)
9.3.1.7 Hungary
9.3.1.7.1 Hungary Vitrification Market Estimates and Forecasts, by Specimen (2020-2032) (USD Billion)
9.3.1.7.2 Hungary Vitrification Market Estimates and Forecasts, by End Use (2020-2032) (USD Billion)
9.3.1.8 Turkey
9.3.1.8.1 Turkey Vitrification Market Estimates and Forecasts, by Specimen (2020-2032) (USD Billion)
9.3.1.8.2 Turkey Vitrification Market Estimates and Forecasts, by End Use (2020-2032) (USD Billion)
9.3.1.9 Rest of Eastern Europe
9.3.1.9.1 Rest of Eastern Europe Vitrification Market Estimates and Forecasts, by Specimen (2020-2032) (USD Billion)
9.3.1.9.2 Rest of Eastern Europe Vitrification Market Estimates and Forecasts, by End Use (2020-2032) (USD Billion)
9.3.2 Western Europe
9.3.2.1 Trends Analysis
9.3.2.2 Western Europe Vitrification Market Estimates and Forecasts, by Country (2020-2032) (USD Billion)
9.3.2.3 Western Europe Vitrification Market Estimates and Forecasts, by Specimen (2020-2032) (USD Billion)
9.3.2.4 Western Europe Vitrification Market Estimates and Forecasts, by End Use (2020-2032) (USD Billion)
9.3.2.5 Germany
9.3.2.5.1 Germany Vitrification Market Estimates and Forecasts, by Specimen (2020-2032) (USD Billion)
9.3.2.5.2 Germany Vitrification Market Estimates and Forecasts, by End Use (2020-2032) (USD Billion)
9.3.2.6 France
9.3.2.6.1 France Vitrification Market Estimates and Forecasts, by Specimen (2020-2032) (USD Billion)
9.3.2.6.2 France Vitrification Market Estimates and Forecasts, by End Use (2020-2032) (USD Billion)
9.3.2.7 UK
9.3.2.7.1 UK Vitrification Market Estimates and Forecasts, by Specimen (2020-2032) (USD Billion)
9.3.2.7.2 UK Vitrification Market Estimates and Forecasts, by End Use (2020-2032) (USD Billion)
9.3.2.8 Italy
9.3.2.8.1 Italy Vitrification Market Estimates and Forecasts, by Specimen (2020-2032) (USD Billion)
9.3.2.8.2 Italy Vitrification Market Estimates and Forecasts, by End Use (2020-2032) (USD Billion)
9.3.2.9 Spain
9.3.2.9.1 Spain Vitrification Market Estimates and Forecasts, by Specimen (2020-2032) (USD Billion)
9.3.2.9.2 Spain Vitrification Market Estimates and Forecasts, by End Use (2020-2032) (USD Billion)
9.3.2.10 Netherlands
9.3.2.10.1 Netherlands Vitrification Market Estimates and Forecasts, by Specimen (2020-2032) (USD Billion)
9.3.2.10.2 Netherlands Vitrification Market Estimates and Forecasts, by End Use (2020-2032) (USD Billion)
9.3.2.11 Switzerland
9.3.2.11.1 Switzerland Vitrification Market Estimates and Forecasts, by Specimen (2020-2032) (USD Billion)
9.3.2.11.2 Switzerland Vitrification Market Estimates and Forecasts, by End Use (2020-2032) (USD Billion)
9.3.2.12 Austria
9.3.2.12.1 Austria Vitrification Market Estimates and Forecasts, by Specimen (2020-2032) (USD Billion)
9.3.2.12.2 Austria Vitrification Market Estimates and Forecasts, by End Use (2020-2032) (USD Billion)
9.3.2.13 Rest of Western Europe
9.3.2.13.1 Rest of Western Europe Vitrification Market Estimates and Forecasts, by Specimen (2020-2032) (USD Billion)
9.3.2.13.2 Rest of Western Europe Vitrification Market Estimates and Forecasts, by End Use (2020-2032) (USD Billion)
9.4 Asia Pacific
9.4.1 Trends Analysis
9.4.2 Asia Pacific Vitrification Market Estimates and Forecasts, by Country (2020-2032) (USD Billion)
9.4.3 Asia Pacific Vitrification Market Estimates and Forecasts, by Specimen (2020-2032) (USD Billion)
9.4.4 Asia Pacific Vitrification Market Estimates and Forecasts, by End Use (2020-2032) (USD Billion)
9.4.5 China
9.4.5.1 China Vitrification Market Estimates and Forecasts, by Specimen (2020-2032) (USD Billion)
9.4.5.2 China Vitrification Market Estimates and Forecasts, by End Use (2020-2032) (USD Billion)
9.4.6 India
9.4.5.1 India Vitrification Market Estimates and Forecasts, by Specimen (2020-2032) (USD Billion)
9.4.5.2 India Vitrification Market Estimates and Forecasts, by End Use (2020-2032) (USD Billion)
9.4.5 Japan
9.4.5.1 Japan Vitrification Market Estimates and Forecasts, by Specimen (2020-2032) (USD Billion)
9.4.5.2 Japan Vitrification Market Estimates and Forecasts, by End Use (2020-2032) (USD Billion)
9.4.6 South Korea
9.4.6.1 South Korea Vitrification Market Estimates and Forecasts, by Specimen (2020-2032) (USD Billion)
9.4.6.2 South Korea Vitrification Market Estimates and Forecasts, by End Use (2020-2032) (USD Billion)
9.4.7 Vietnam
9.4.7.1 Vietnam Vitrification Market Estimates and Forecasts, by Specimen (2020-2032) (USD Billion)
9.2.7.2 Vietnam Vitrification Market Estimates and Forecasts, by End Use (2020-2032) (USD Billion)
9.4.8 Singapore
9.4.8.1 Singapore Vitrification Market Estimates and Forecasts, by Specimen (2020-2032) (USD Billion)
9.4.8.2 Singapore Vitrification Market Estimates and Forecasts, by End Use (2020-2032) (USD Billion)
9.4.9 Australia
9.4.9.1 Australia Vitrification Market Estimates and Forecasts, by Specimen (2020-2032) (USD Billion)
9.4.9.2 Australia Vitrification Market Estimates and Forecasts, by End Use (2020-2032) (USD Billion)
9.4.10 Rest of Asia Pacific
9.4.10.1 Rest of Asia Pacific Vitrification Market Estimates and Forecasts, by Specimen (2020-2032) (USD Billion)
9.4.10.2 Rest of Asia Pacific Vitrification Market Estimates and Forecasts, by End Use (2020-2032) (USD Billion)
9.5 Middle East and Africa
9.5.1 Middle East
9.5.1.1 Trends Analysis
9.5.1.2 Middle East Vitrification Market Estimates and Forecasts, by Country (2020-2032) (USD Billion)
9.5.1.3 Middle East Vitrification Market Estimates and Forecasts, by Specimen (2020-2032) (USD Billion)
9.5.1.4 Middle East Vitrification Market Estimates and Forecasts, by End Use (2020-2032) (USD Billion)
9.5.1.5 UAE
9.5.1.5.1 UAE Vitrification Market Estimates and Forecasts, by Specimen (2020-2032) (USD Billion)
9.5.1.5.2 UAE Vitrification Market Estimates and Forecasts, by End Use (2020-2032) (USD Billion)
9.5.1.6 Egypt
9.5.1.6.1 Egypt Vitrification Market Estimates and Forecasts, by Specimen (2020-2032) (USD Billion)
9.5.1.6.2 Egypt Vitrification Market Estimates and Forecasts, by End Use (2020-2032) (USD Billion)
9.5.1.7 Saudi Arabia
9.5.1.7.1 Saudi Arabia Vitrification Market Estimates and Forecasts, by Specimen (2020-2032) (USD Billion)
9.5.1.7.2 Saudi Arabia Vitrification Market Estimates and Forecasts, by End Use (2020-2032) (USD Billion)
9.5.1.8 Qatar
9.5.1.8.1 Qatar Vitrification Market Estimates and Forecasts, by Specimen (2020-2032) (USD Billion)
9.5.1.8.2 Qatar Vitrification Market Estimates and Forecasts, by End Use (2020-2032) (USD Billion)
9.5.1.9 Rest of Middle East
9.5.1.9.1 Rest of Middle East Vitrification Market Estimates and Forecasts, by Specimen (2020-2032) (USD Billion)
9.5.1.9.2 Rest of Middle East Vitrification Market Estimates and Forecasts, by End Use (2020-2032) (USD Billion)
9.5.2 Africa
9.5.2.1 Trends Analysis
9.5.2.2 Africa Vitrification Market Estimates and Forecasts, by Country (2020-2032) (USD Billion)
9.5.2.3 Africa Vitrification Market Estimates and Forecasts, by Specimen (2020-2032) (USD Billion)
9.5.2.4 Africa Vitrification Market Estimates and Forecasts, by End Use (2020-2032) (USD Billion)
9.5.2.5 South Africa
9.5.2.5.1 South Africa Vitrification Market Estimates and Forecasts, by Specimen (2020-2032) (USD Billion)
9.5.2.5.2 South Africa Vitrification Market Estimates and Forecasts, by End Use (2020-2032) (USD Billion)
9.5.2.6 Nigeria
9.5.2.6.1 Nigeria Vitrification Market Estimates and Forecasts, by Specimen (2020-2032) (USD Billion)
9.5.2.6.2 Nigeria Vitrification Market Estimates and Forecasts, by End Use (2020-2032) (USD Billion)
9.5.2.7 Rest of Africa
9.5.2.7.1 Rest of Africa Vitrification Market Estimates and Forecasts, by Specimen (2020-2032) (USD Billion)
9.5.2.7.2 Rest of Africa Vitrification Market Estimates and Forecasts, by End Use (2020-2032) (USD Billion)
9.6 Latin America
9.6.1 Trends Analysis
9.6.2 Latin America Vitrification Market Estimates and Forecasts, by Country (2020-2032) (USD Billion)
9.6.3 Latin America Vitrification Market Estimates and Forecasts, by Specimen (2020-2032) (USD Billion)
9.6.4 Latin America Vitrification Market Estimates and Forecasts, by End Use (2020-2032) (USD Billion)
9.6.5 Brazil
9.6.5.1 Brazil Vitrification Market Estimates and Forecasts, by Specimen (2020-2032) (USD Billion)
9.6.5.2 Brazil Vitrification Market Estimates and Forecasts, by End Use (2020-2032) (USD Billion)
9.6.6 Argentina
9.6.6.1 Argentina Vitrification Market Estimates and Forecasts, by Specimen (2020-2032) (USD Billion)
9.6.6.2 Argentina Vitrification Market Estimates and Forecasts, by End Use (2020-2032) (USD Billion)
9.6.7 Colombia
9.6.7.1 Colombia Vitrification Market Estimates and Forecasts, by Specimen (2020-2032) (USD Billion)
9.6.7.2 Colombia Vitrification Market Estimates and Forecasts, by End Use (2020-2032) (USD Billion)
9.6.8 Rest of Latin America
9.6.8.1 Rest of Latin America Vitrification Market Estimates and Forecasts, by Specimen (2020-2032) (USD Billion)
9.6.8.2 Rest of Latin America Vitrification Market Estimates and Forecasts, by End Use (2020-2032) (USD Billion)
10. Company Profiles
10.1 Vitrolife
10.1.1 Company Overview
10.1.2 Financial
10.1.3 Products/ Services Offered
110.1.4 SWOT Analysis
10.2 Kitazato Corporation
10.2.1 Company Overview
10.2.2 Financial
10.2.3 Products/ Services Offered
10.2.4 SWOT Analysis
10.3 Thermo Fisher Scientific
10.3.1 Company Overview
10.3.2 Financial
10.3.3 Products/ Services Offered
10.3.4 SWOT Analysis
10.4 Irvine Scientific
10.4.1 Company Overview
10.4.2 Financial
10.4.3 Products/ Services Offered
10.4.4 SWOT Analysis
10.5 Fertility Associates
10.5.1 Company Overview
10.5.2 Financial
10.5.3 Products/ Services Offered
10.5.4 SWOT Analysis
10.6 CooperSurgical
10.6.1 Company Overview
10.6.2 Financial
10.6.3 Products/ Services Offered
10.6.4 SWOT Analysis
10.7 Cryoport
10.7.1 Company Overview
10.7.2 Financial
10.7.3 Products/ Services Offered
10.7.4 SWOT Analysis
10.8 ES Diagnostics
10.8.1 Company Overview
10.8.2 Financial
10.8.3 Products/ Services Offered
10.8.4 SWOT Analysis
10.9 Reproductive Health Technologies
10.9.1 Company Overview
10.9.2 Financial
10.9.3 Products/ Services Offered
10.9.4 SWOT Analysis
10.10 Repro Tech
10.9.1 Company Overview
10.9.2 Financial
10.9.3 Products/ Services Offered
10.9.4 SWOT Analysis
11. Use Cases and Best Practices
12. Conclusio
An accurate research report requires proper strategizing as well as implementation. There are multiple factors involved in the completion of good and accurate research report and selecting the best methodology to compete the research is the toughest part. Since the research reports we provide play a crucial role in any company’s decision-making process, therefore we at SNS Insider always believe that we should choose the best method which gives us results closer to reality. This allows us to reach at a stage wherein we can provide our clients best and accurate investment to output ratio.
Each report that we prepare takes a timeframe of 350-400 business hours for production. Starting from the selection of titles through a couple of in-depth brain storming session to the final QC process before uploading our titles on our website we dedicate around 350 working hours. The titles are selected based on their current market cap and the foreseen CAGR and growth.
The 5 steps process:
Step 1: Secondary Research:
Secondary Research or Desk Research is as the name suggests is a research process wherein, we collect data through the readily available information. In this process we use various paid and unpaid databases which our team has access to and gather data through the same. This includes examining of listed companies’ annual reports, Journals, SEC filling etc. Apart from this our team has access to various associations across the globe across different industries. Lastly, we have exchange relationships with various university as well as individual libraries.
Step 2: Primary Research
When we talk about primary research, it is a type of study in which the researchers collect relevant data samples directly, rather than relying on previously collected data. This type of research is focused on gaining content specific facts that can be sued to solve specific problems. Since the collected data is fresh and first hand therefore it makes the study more accurate and genuine.
We at SNS Insider have divided Primary Research into 2 parts.
Part 1 wherein we interview the KOLs of major players as well as the upcoming ones across various geographic regions. This allows us to have their view over the market scenario and acts as an important tool to come closer to the accurate market numbers. As many as 45 paid and unpaid primary interviews are taken from both the demand and supply side of the industry to make sure we land at an accurate judgement and analysis of the market.
This step involves the triangulation of data wherein our team analyses the interview transcripts, online survey responses and observation of on filed participants. The below mentioned chart should give a better understanding of the part 1 of the primary interview.
Part 2: In this part of primary research the data collected via secondary research and the part 1 of the primary research is validated with the interviews from individual consultants and subject matter experts.
Consultants are those set of people who have at least 12 years of experience and expertise within the industry whereas Subject Matter Experts are those with at least 15 years of experience behind their back within the same space. The data with the help of two main processes i.e., FGDs (Focused Group Discussions) and IDs (Individual Discussions). This gives us a 3rd party nonbiased primary view of the market scenario making it a more dependable one while collation of the data pointers.
Step 3: Data Bank Validation
Once all the information is collected via primary and secondary sources, we run that information for data validation. At our intelligence centre our research heads track a lot of information related to the market which includes the quarterly reports, the daily stock prices, and other relevant information. Our data bank server gets updated every fortnight and that is how the information which we collected using our primary and secondary information is revalidated in real time.
Step 4: QA/QC Process
After all the data collection and validation our team does a final level of quality check and quality assurance to get rid of any unwanted or undesired mistakes. This might include but not limited to getting rid of the any typos, duplication of numbers or missing of any important information. The people involved in this process include technical content writers, research heads and graphics people. Once this process is completed the title gets uploader on our platform for our clients to read it.
Step 5: Final QC/QA Process:
This is the last process and comes when the client has ordered the study. In this process a final QA/QC is done before the study is emailed to the client. Since we believe in giving our clients a good experience of our research studies, therefore, to make sure that we do not lack at our end in any way humanly possible we do a final round of quality check and then dispatch the study to the client.
Key Segments:
By Specimen
Oocytes
Devices
Kits & Consumables
Embryo
Devices
Kits & Consumables
Sperm
By End-Use
IVF Clinics
Biobanks
Request for Segment Customization as per your Business Requirement: Segment Customization Request
REGIONAL COVERAGE:
North America
US
Canada
Mexico
Europe
Eastern Europe
Poland
Romania
Hungary
Turkey
Rest of Eastern Europe
Western Europe
Germany
France
UK
Italy
Spain
Netherlands
Switzerland
Austria
Rest of Western Europe
Asia Pacific
China
India
Japan
South Korea
Vietnam
Singapore
Australia
Rest of Asia Pacific
Middle East & Africa
Middle East
UAE
Egypt
Saudi Arabia
Qatar
Rest of the Middle East
Africa
Nigeria
South Africa
Rest of Africa
Latin America
Brazil
Argentina
Colombia
Request for Country Level Research Report: Country Level Customization Request
Available Customization
With the given market data, SNS Insider offers customization as per the company’s specific needs. The following customization options are available for the report:
Product Analysis
Criss-Cross segment analysis (e.g. Product X Application)
Product Matrix which gives a detailed comparison of product portfolio of each company
Geographic Analysis
Additional countries in any of the regions
Company Information
Detailed analysis and profiling of additional market players (Up to five)
The Neuroprosthetics Market size was valued at USD 11.71 billion in 2023 and is expected to reach at USD 30.26 billion by 2031 and grow at a CAGR of 12.6% over the forecast period of 2024-2031.
The Biological Safety Testing Products and Services Market size was valued at $4.42 Bn in 2023 & will reach $10.51 Bn by 2032 & growing at a CAGR of 10.10% Over the Forecast period of 2024-2032.
The Psoriasis Treatment Market was valued at USD 28.15 billion in 2023 and is expected to reach USD 54.87 billion by 2031 with a growing CAGR of 8.7% over the forecast period of 2024-2031.
The Hormonal Contraceptives Market size was valued at USD 17.58 Billion in 2023 and is expected to reach USD 25.39 Billion By 2031 with a growing CAGR of 4.70% over the forecast period of 2024-2031.
The Prenatal Vitamins Supplement Market size was valued at USD 0.63 billion in 2023, and is expected to reach USD 1.39 billion by 2032, and grow at a CAGR of 9.21% over the forecast period 2024-2032.
The Immunology Market Size was valued at USD 97.58 Billion in 2023, and is expected to reach USD 254.23 Billion by 2032, and grow at a CAGR of 11.8%.
Hi! Click one of our member below to chat on Phone