image

Global Vitamins Market Size & Trends
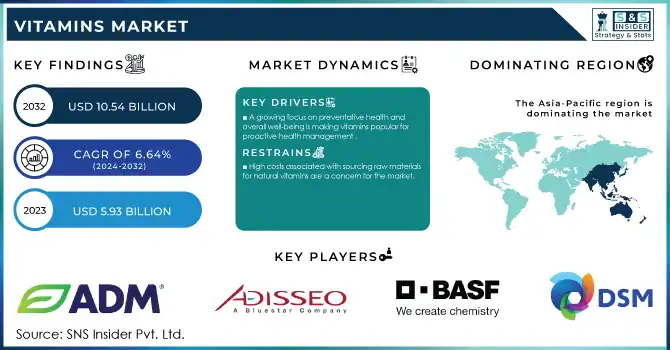
Vitamins Market Revenue Analysis

Get more information on Vitamins Market - Request Sample Report

The Vitamins Market size was estimated at USD 5.93 billion in 2023 and is expected to reach USD 10.54 billion by 2032 at a CAGR of 6.64% during the forecast period of 2024-2032.

The vitamins market is witnessing robust growth, driven by increased health awareness, a focus on preventive care, and the growing prevalence of chronic diseases. According to the Nutrition Trends Survey, an estimated 88% of U.S. adults report using dietary supplements, with vitamins leading as the most consumed category. This trend highlights the growing consumer recognition of vitamins as essential to a healthy lifestyle.

Chronic diseases such as diabetes and cardiovascular ailments have amplified the importance of vitamins in managing nutritional deficiencies. For example, vitamin D is widely recommended to improve bone health and mitigate osteoporosis risk, while vitamin C is essential for immunity and tissue repair. Functional foods and beverages, including vitamin-fortified water, cereals, and snack bars, have gained popularity, catering to the demand for convenient yet nutritious options. Notable examples include products like Kellogg’s fortified cereals and Coca-Cola’s vitamin-infused beverages.

Technological advancements have further revolutionized the market with user-friendly formats. Gummies, for instance, have emerged as a preferred choice for children and adults alike, with brands like SmartyPants Vitamins and Olly Nutrition leading in this segment. Similarly, effervescent tablets, such as those by Berocca, offer a portable and fast-dissolving solution, enhancing compliance among busy consumers.

The COVID-19 pandemic catalyzed a surge in demand for immunity-boosting vitamins. According to the Council for Responsible Nutrition (CRN), vitamin D and C sales increased by over 50% in 2020, and the trend has sustained due to ongoing health consciousness. Additionally, personalized nutrition is becoming a defining factor, with companies like Care/of and Persona Nutrition providing tailored vitamin regimens based on individual health assessments.

Vitamins Market Dynamics

Drivers

  • The Growing Emphasis on Preventive Healthcare and Lifestyle Changes Are Major Drivers for The Vitamins Market.

With the prevalence of lifestyle-related disorders like obesity, diabetes, and cardiovascular conditions, consumers are increasingly adopting vitamins to bridge nutritional gaps and enhance overall wellness. Public health campaigns and greater awareness of the benefits of micronutrients—such as their role in immunity, mental health, and chronic disease prevention have further accelerated demand. This trend is particularly strong among millennials and Gen Z, who prioritize long-term health over-reactive treatments, resulting in a consistent shift toward proactive health management.

  • Innovation in Formulations and Delivery Methods

Product innovation has transformed the vitamins market, making supplements more accessible and appealing. Novel delivery methods, including gummies, effervescent tablets, liquid drops, and transdermal patches, have gained popularity, catering to diverse consumer preferences. These advancements address challenges like pill fatigue and improve compliance, especially among children and seniors. For example, gummy vitamins have become a favorite due to their palatability and ease of consumption, while liquid formulations allow for faster absorption.

  • Consumer Preferences for Sustainability and Clean Labels

A shift toward sustainable and plant-based lifestyles is significantly influencing the market. Consumers are increasingly seeking clean-label vitamins made from natural, non-GMO, and vegan-friendly ingredients. Brands offering transparency in sourcing and manufacturing processes are gaining traction, especially among eco-conscious buyers. The rise of plant-based diets and increasing allergies to synthetic additives have further amplified the demand for allergen-free and organic supplements. This trend aligns with broader movements toward ethical consumption, creating opportunities for companies to innovate and capture the loyalty of environmentally aware customers.

Restraints

  • The Vitamins Market Faces Significant Restraints Stemming from Stringent Regulatory Requirements and Quality Control Issues.

Regulatory bodies, such as the U.S. Food and Drug Administration and the European Food Safety Authority, impose strict guidelines on the manufacturing, labeling, and marketing of vitamin products. Compliance with these regulations can be costly and time-consuming, particularly for small and medium-sized enterprises. Additionally, the market is plagued by concerns over product authenticity and quality, with reports of adulterated or substandard supplements impacting consumer trust. The lack of universal standards for dietary supplements further complicates the landscape, leading to inconsistent product efficacy and safety. These challenges are exacerbated by misinformation in the market, where exaggerated claims about the benefits of certain vitamins can mislead consumers, resulting in skepticism and reduced adoption. Addressing these issues is critical for fostering growth and maintaining consumer confidence in the vitamins market.

Segmentation Analysis

Vitamins Market By Source

Synthetic vitamins held a dominant share of the market in 2023, accounting for 65% of total revenue. Their dominance is attributed to cost efficiency, ease of large-scale production, and longer shelf life compared to natural alternatives. These vitamins are widely incorporated into dietary supplements, fortified foods, and pharmaceutical applications, offering consistent potency and accessibility to a broader consumer base.

Natural vitamins are experiencing rapid growth due to increasing consumer demand for clean-label, organic, and plant-based products. The rising preference for minimally processed vitamins derived from fruits, vegetables, and other natural sources is a key driver. This trend aligns with the growing awareness about sustainability and health-conscious purchasing, propelling the segment forward.

Vitamins Market By Type

Vitamin B dominated the vitamin market in 2023, holding the largest share of 38.2%. This is due to its crucial role in various physiological functions, including tissue regeneration, nerve repair, and supporting metabolism. Vitamin B is widely used in the manufacturing of dietary supplements, pharmaceuticals, dairy products, and cosmetic formulations. Additionally, its importance during pregnancy for fetal development has further propelled its adoption. As the demand for health and wellness products grows, especially for energy, cognitive function, and skin health, Vitamin B continues to lead the market.

Vitamin D is expected to be the fastest-growing segment. Its significant role in bone health, immune system function, and overall well-being has driven its increased demand. With rising awareness of vitamin D deficiency and its impact on public health, more consumers are opting for vitamin D supplements. Additionally, its inclusion in fortified foods and personalized nutrition plans has expanded its reach. The COVID-19 pandemic also heightened focus on vitamin D's role in boosting immunity, further accelerating its growth in the market.

Vitamins Market Regional Outlook

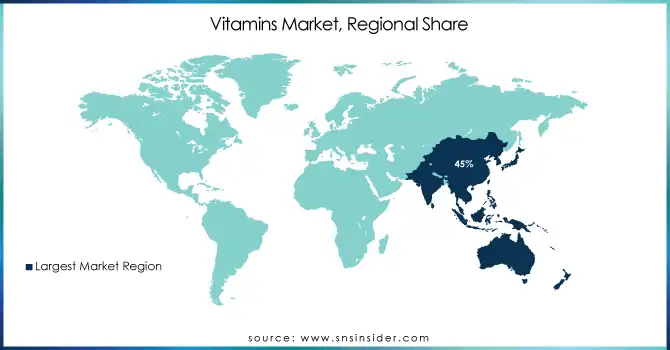
The Asia-Pacific region dominated the vitamins market in 2023, accounting for the 42.3% market share. This dominance is driven by rapid urbanization, rising disposable incomes, and a growing health-conscious population in countries like China, India, Japan, and South Korea. As the middle class continues to expand, there is an increasing demand for dietary supplements, including vitamins, to address nutritional deficiencies and promote overall health. The rising prevalence of lifestyle diseases, coupled with a greater focus on preventive healthcare, has further fueled the market's growth.

In particular, countries like China and India have seen a significant rise in the consumption of vitamins, especially Vitamin D and Vitamin B, due to concerns over malnutrition and vitamin deficiencies among large sections of the population. Additionally, the region's growing interest in wellness, fitness, and natural health products has spurred demand for organic and plant-based vitamins, which are gaining popularity in the market.

Moreover, the presence of key local and international vitamin manufacturers, alongside improvements in distribution channels such as e-commerce, has made vitamins more accessible to a wider audience. The COVID-19 pandemic further amplified the demand for immunity-boosting vitamins like Vitamin D, propelling growth in this region. As a result, the Asia-Pacific market is poised for sustained growth in the coming years, driven by a combination of consumer health trends and expanding economic opportunities.
Vitamins-Market-Regional-Share

Need any customization research on Vitamins Market - Enquiry Now

Key Players:

  • Koninklijke DSM NV 

  • Glanbia PLC

  • ADM 

  • BASF 

  • Lonza Group 

  • Adisseo 

  • Vitablend Nederland BV 

  • SternVitamin GmbH 

  • Farbest-Tallman Foods Corporation The Wright Group 

  • Zhejiang Garden Biochemical High-Tech Co., Ltd 

  • NewGen Pharma 

  • Rabar Pty Ltd. 

  • Resonac 

  • BTSA BIOTECNOLOGÍAS APLICADAS SL 

  • Cargill Incorporated 

  • Archer Daniels Midland Company (ADM) 

  • Ingredion Incorporated 

  • Tate & Lyle PLC 

  • Agrana Beteiligungs-AG 

  • Grain Processing Corporation 

  • Roquette Frères 

Recent Developments

In Jan 2025, Mela Vitamins partnered with WNBA champions Azurá Stevens (LA Sparks) and Dana Evans (Chicago Sky) to promote wellness among women of color. This collaboration focuses on empowering communities of color to prioritize their health and tackle existing health disparities.

In Jan 2025, A Fairy Meadow GP warned individuals to carefully check the ingredients in their vitamin supplements after treating several patients who showed symptoms of poisoning from a common additive. This advisory came in light of multiple cases observed by the doctor.

Vitamins Market Report Scope:

Report Attributes Details
Market Size in 2023 USD 5.93 Billion 
Market Size by 2032 USD 10.54 Billion 
CAGR CAGR of 6.64% From 2024 to 2032
Base Year 2023
Forecast Period 2024-2032
Historical Data 2020-2022
Report Scope & Coverage Market Size, Segments Analysis, Competitive  Landscape, Regional Analysis, DROC & SWOT Analysis, Forecast Outlook
Key Segments • By Source [Natural, Synthetic]
• By Type [VtaminB, VitaminE, VitaminD, VitaminC, VitaminA, VitaminK]
• By Application [Healthcare Products, Food & Beverages (Infant Foods, Dairy products, Bakery & confectionary products, Beverages, Others), Feed, Personal care products]
Regional Analysis/Coverage North America (US, Canada, Mexico), Europe (Eastern Europe [Poland, Romania, Hungary, Turkey, Rest of Eastern Europe] Western Europe] Germany, France, UK, Italy, Spain, Netherlands, Switzerland, Austria, Rest of Western Europe]), Asia Pacific (China, India, Japan, South Korea, Vietnam, Singapore, Australia, Rest of Asia Pacific), Middle East & Africa (Middle East [UAE, Egypt, Saudi Arabia, Qatar, Rest of Middle East], Africa [Nigeria, South Africa, Rest of Africa], Latin America (Brazil, Argentina, Colombia, Rest of Latin America)
Company Profiles Koninklijke DSM NV, Glanbia PLC, ADM, BASF, Lonza Group, Adisseo, Vitablend Nederland BV, SternVitamin GmbH, Farbest-Tallman Foods Corporation, The Wright Group, Zhejiang Garden Biochemical High-Tech Co., Ltd, NewGen Pharma, Rabar Pty Ltd., Resonac, BTSA BIOTECNOLOGÍAS APLICADAS SL, Cargill Incorporated, Archer Daniels Midland Company (ADM), Ingredion Incorporated, Tate & Lyle PLC, Agrana Beteiligungs-AG, Grain Processing Corporation, Roquette Frères.
Key Drivers • The Growing Emphasis on Preventive Healthcare and Lifestyle Changes Are Major Drivers for The Vitamins Market.
• Innovation in Formulations and Delivery Methods
• Consumer Preferences for Sustainability and Clean Labels
Restraints • The Vitamins Market Faces Significant Restraints Stemming from Stringent Regulatory Requirements and Quality Control Issues. 

Frequently Asked Questions

Ans: Vitamins Market size was USD 5.93 billion in 2023 and is expected to Reach USD 10.54 billion by 2032.

Increased demand for processed foods that are both functional and nutritionally enriched, Vitamin deficiency is becoming more common are all propelling Vitamins market forward.

APAC region will hold the largest share of the market.

Koninklijke DSM NV, Glanbia PLC, ADM, BASF, Lonza Group, Adisseo, Vitablend Nederland BV, SternVitamin GmbH, Farbest-Tallman Foods Corporation, The Wright Group, Zhejiang Garden Biochemical High-Tech Co., Ltd, NewGen Pharma, Rabar Pty Ltd., Resonac, BTSA BIOTECNOLOGÍAS APLICADAS SL, Cargill Incorporated, Archer Daniels Midland Company (ADM), Ingredion Incorporated, Tate & Lyle PLC, Agrana Beteiligungs-AG, Grain Processing Corporation, Roquette Frères are the key players of the Vitamins Market.

Ans: The Vitamins Market is growing at a CAGR of 6.64% over the forecast period 2024-2032.

Table of Contents

1. Introduction

1.1 Market Definition

1.2 Scope (Inclusion and Exclusions)

1.3 Research Assumptions

2. Executive Summary

2.1 Market Overview

2.2 Regional Synopsis

2.3 Competitive Summary

3. Research Methodology

3.1 Top-Down Approach

3.2 Bottom-up Approach

3.3. Data Validation

3.4 Primary Interviews

4. Market Dynamics Impact Analysis

4.1 Market Driving Factors Analysis

4.1.1 Drivers

4.1.2 Restraints

4.1.3 Opportunities

4.1.4 Challenges

4.2 PESTLE Analysis

4.3 Porter’s Five Forces Model

5. Statistical Insights and Trends Reporting

5.1 Incidence and Prevalence (2023)

5.2 Prescription Trends, (2023), by Region

5.3 Vitamin Supplement Consumption, by Region (2020-2032)

5.4 Healthcare Spending on Vitamins, by Region (Government, Commercial, Private, Out-of-Pocket), 2023

6. Competitive Landscape

6.1 List of Major Companies, By Region

6.2 Market Share Analysis, By Region

6.3 Product Benchmarking

6.3.1 Product specifications and features

6.3.2 Pricing

6.4 Strategic Initiatives

6.4.1 Marketing and promotional activities

6.4.2 Distribution and Supply Chain Strategies

6.4.3 Expansion plans and new Product launches

6.4.4 Strategic partnerships and collaborations

6.5 Technological Advancements

6.6 Market Positioning and Branding

7. Vitamins Market Segmentation, by Source

7.1 Chapter Overview

7.2 Natural

7.2.1 Natural Market Trends Analysis (2020-2032)

7.2.2 Natural Market Size Estimates and Forecasts to 2032 (USD Billion)

7.3 Synthetic

7.3.1 Synthetic Market Trends Analysis (2020-2032)

7.3.2 Synthetic Market Size Estimates and Forecasts to 2032 (USD Billion)

8. Vitamins Market Segmentation, by Type    

   8.1 Chapter Overview

   8.2 Vitamin B

              8.2.1 Vitamin B Market Trends Analysis (2020-2032)

8.2.2 Vitamin B Market Size Estimates and Forecasts to 2032 (USD Billion)

    8.3 Vitamin E

              8.3.1 Vitamin E Market Trends Analysis (2020-2032)

              8.3.2 Vitamin E Market Size Estimates and Forecasts to 2032 (USD Billion)

    8.4 Vitamin D

              8.4.1 Vitamin D Market Trends Analysis (2020-2032)

              8.4.2 Vitamin D Market Size Estimates and Forecasts to 2032 (USD Billion)

    8.5 Vitamin C

              8.5.1 Vitamin C Market Trends Analysis (2020-2032)

              8.5.2 Vitamin C Market Size Estimates and Forecasts to 2032 (USD Billion)

    8.6 Vitamin A

              8.6.1 Vitamin A Market Trends Analysis (2020-2032)

              8.6.2 Vitamin A Market Size Estimates and Forecasts to 2032 (USD Billion)

    8.7 Vitamin A

              8.7.1 Vitamin K Market Trends Analysis (2020-2032)

              8.7.2 Vitamin K Market Size Estimates and Forecasts to 2032 (USD Billion)

9. Vitamins Market Segmentation, by Application

9.1 Chapter Overview

      9.2 Healthcare products

             9.2.1 Healthcare Products Market Trends Analysis (2020-2032)

9.2.2 Healthcare Products Market Size Estimates and Forecasts to 2032 (USD Billion)

       9.3 Food & Beverages

             9.3.1 Food & Beverages Market Trends Analysis (2020-2032)

             9.3.2 Food & Beverages Market Size Estimates and Forecasts to 2032 (USD Billion)

             9.3.3 Infant Foods

             9.3.3.1 Infant Foods Market Trends Analysis (2020-2032)

             9.3.3.2 Infant Foods Market Size Estimates and Forecasts to 2032 (USD Billion)

             9.3.4 Dairy products

             9.3.4.1 Dairy Products Market Trends Analysis (2020-2032)

             9.3.4.2 Dairy Products Market Size Estimates and Forecasts to 2032 (USD Billion)

             9.3.5 Bakery & confectionary products

             9.3.5.1 Bakery & confectionary products Market Trends Analysis (2020-2032)

             9.3.5.2 Bakery & Confectionary Products Market Size Estimates and Forecasts to 2032 (USD Billion)

            9.3.6 Beverages

             9.3.6.1 Beverages Market Trends Analysis (2020-2032)

             9.3.6.2 Beverages Market Size Estimates and Forecasts to 2032 (USD Billion)

            9.3.7 Others

             9.3.7.1 Others Market Trends Analysis (2020-2032)

             9.3.7.2 Others Market Size Estimates and Forecasts to 2032 (USD Billion)

    9.4 Feed

             9.4.1 Feed Market Trends Analysis (2020-2032)

             9.4.2 Feed Market Size Estimates and Forecasts to 2032 (USD Billion)

    9.5 Personal care products

             9.5.1 Personal Care Products Market Trends Analysis (2020-2032)

             9.5.2 Personal Care Products Market Size Estimates and Forecasts to 2032 (USD Billion)

10. Regional Analysis

10.1 Chapter Overview

10.2 North America

10.2.1 Trends Analysis

10.2.2 North America Vitamins Market Estimates and Forecasts, by Country (2020-2032) (USD Billion)

10.2.3 North America Vitamins Market Estimates and Forecasts, by Source (2020-2032) (USD Billion) 

10.2.4 North America Vitamins Market Estimates and Forecasts, by Type (2020-2032) (USD Billion)

10.2.5 North America Vitamins Market Estimates and Forecasts, by Application (2020-2032) (USD Billion)

10.2.6 USA

10.2.6.1 USA Vitamins Market Estimates and Forecasts, by Source (2020-2032) (USD Billion)

10.2.6.2 USA Vitamins Market Estimates and Forecasts, by Type (2020-2032) (USD Billion)

10.2.6.3 USA Vitamins Market Estimates and Forecasts, by Application (2020-2032) (USD Billion)

10.2.7 Canada

10.2.7.1 Canada Vitamins Market Estimates and Forecasts, by Source (2020-2032) (USD Billion)

10.2.7.2 Canada Vitamins Market Estimates and Forecasts, by Type (2020-2032) (USD Billion)

10.2.7.3 Canada Vitamins Market Estimates and Forecasts, by Application (2020-2032) (USD Billion)

10.2.8 Mexico

10.2.8.1 Mexico Vitamins Market Estimates and Forecasts, by Source (2020-2032) (USD Billion)

10.2.8.2 Mexico Vitamins Market Estimates and Forecasts, by Type (2020-2032) (USD Billion)

10.2.8.3 Mexico Vitamins Market Estimates and Forecasts, by Application (2020-2032) (USD Billion)

10.3 Europe

10.3.1 Eastern Europe

10.3.1.1 Trends Analysis

10.3.1.2 Eastern Europe Vitamins Market Estimates and Forecasts, by Country (2020-2032) (USD Billion)

10.3.1.3 Eastern Europe Vitamins Market Estimates and Forecasts, by Source (2020-2032) (USD Billion) 

10.3.1.4 Eastern Europe Vitamins Market Estimates and Forecasts, by Type (2020-2032) (USD Billion)

10.3.1.5 Eastern Europe Vitamins Market Estimates and Forecasts, by Application (2020-2032) (USD Billion)

10.3.1.6 Poland

10.3.1.6.1 Poland Vitamins Market Estimates and Forecasts, by Source (2020-2032) (USD Billion)

10.3.1.6.2 Poland Vitamins Market Estimates and Forecasts, by Type (2020-2032) (USD Billion)

10.3.1.6.3 Poland Vitamins Market Estimates and Forecasts, by Application (2020-2032) (USD Billion)

10.3.1.7 Romania

10.3.1.7.1 Romania Vitamins Market Estimates and Forecasts, by Source (2020-2032) (USD Billion)

10.3.1.7.2 Romania Vitamins Market Estimates and Forecasts, by Type (2020-2032) (USD Billion)

10.3.1.7.3 Romania Vitamins Market Estimates and Forecasts, by Application (2020-2032) (USD Billion)

10.3.1.8 Hungary

10.3.1.8.1 Hungary Vitamins Market Estimates and Forecasts, by Source (2020-2032) (USD Billion)

10.3.1.8.2 Hungary Vitamins Market Estimates and Forecasts, by Type (2020-2032) (USD Billion)

10.3.1.8.3 Hungary Vitamins Market Estimates and Forecasts, by Application (2020-2032) (USD Billion)

10.3.1.9 turkey

10.3.1.9.1 Turkey Vitamins Market Estimates and Forecasts, by Source (2020-2032) (USD Billion)

10.3.1.9.2 Turkey Vitamins Market Estimates and Forecasts, by Type (2020-2032) (USD Billion)

10.3.1.9.3 Turkey Vitamins Market Estimates and Forecasts, by Application (2020-2032) (USD Billion)

10.3.1.10 Rest of Eastern Europe

10.3.1.10.1 Rest of Eastern Europe Vitamins Market Estimates and Forecasts, by Source (2020-2032) (USD Billion)

10.3.1.10.2 Rest of Eastern Europe Vitamins Market Estimates and Forecasts, by Type (2020-2032) (USD Billion)

10.3.1.10.3 Rest of Eastern Europe Vitamins Market Estimates and Forecasts, by Application (2020-2032) (USD Billion)

10.3.2 Western Europe

10.3.2.1 Trends Analysis

10.3.2.2 Western Europe Vitamins Market Estimates and Forecasts, by Country (2020-2032) (USD Billion)

10.3.2.3 Western Europe Vitamins Market Estimates and Forecasts, by Source (2020-2032) (USD Billion) 

10.3.2.4 Western Europe Vitamins Market Estimates and Forecasts, by Type (2020-2032) (USD Billion)

10.3.2.5 Western Europe Vitamins Market Estimates and Forecasts, by Application (2020-2032) (USD Billion)

10.3.2.6 Germany

10.3.2.6.1 Germany Vitamins Market Estimates and Forecasts, by Source (2020-2032) (USD Billion)

10.3.2.6.2 Germany Vitamins Market Estimates and Forecasts, by Type (2020-2032) (USD Billion)

10.3.2.6.3 Germany Vitamins Market Estimates and Forecasts, by Application (2020-2032) (USD Billion)

10.3.2.7 France

10.3.2.7.1 France Vitamins Market Estimates and Forecasts, by Source (2020-2032) (USD Billion)

10.3.2.7.2 France Vitamins Market Estimates and Forecasts, by Type (2020-2032) (USD Billion)

10.3.2.7.3 France Vitamins Market Estimates and Forecasts, by Application (2020-2032) (USD Billion)

10.3.2.8 UK

10.3.2.8.1 UK Vitamins Market Estimates and Forecasts, by Source (2020-2032) (USD Billion)

10.3.2.8.2 UK Vitamins Market Estimates and Forecasts, by Type (2020-2032) (USD Billion)

10.3.2.8.3 UK Vitamins Market Estimates and Forecasts, by Application (2020-2032) (USD Billion)

10.3.2.9 Italy

10.3.2.9.1 Italy Vitamins Market Estimates and Forecasts, by Source (2020-2032) (USD Billion)

10.3.2.9.2 Italy Vitamins Market Estimates and Forecasts, by Type (2020-2032) (USD Billion)

10.3.2.9.3 Italy Vitamins Market Estimates and Forecasts, by Application (2020-2032) (USD Billion)

10.3.2.10 Spain

10.3.2.10.1 Spain Vitamins Market Estimates and Forecasts, by Source (2020-2032) (USD Billion)

10.3.2.10.2 Spain Vitamins Market Estimates and Forecasts, by Type (2020-2032) (USD Billion)

10.3.2.10.3 Spain Vitamins Market Estimates and Forecasts, by Application (2020-2032) (USD Billion)

10.3.2.11 Netherlands

10.3.2.11.1 Netherlands Vitamins Market Estimates and Forecasts, by Source (2020-2032) (USD Billion)

10.3.2.11.2 Netherlands Vitamins Market Estimates and Forecasts, by Type (2020-2032) (USD Billion)

10.3.2.11.3 Netherlands Vitamins Market Estimates and Forecasts, by Application (2020-2032) (USD Billion)

10.3.2.12 Switzerland

10.3.2.12.1 Switzerland Vitamins Market Estimates and Forecasts, by Source (2020-2032) (USD Billion)

10.3.2.12.2 Switzerland Vitamins Market Estimates and Forecasts, by Type (2020-2032) (USD Billion)

10.3.2.12.3 Switzerland Vitamins Market Estimates and Forecasts, by Application (2020-2032) (USD Billion)

10.3.2.13 Austria

10.3.2.13.1 Austria Vitamins Market Estimates and Forecasts, by Source (2020-2032) (USD Billion)

10.3.2.13.2 Austria Vitamins Market Estimates and Forecasts, by Type (2020-2032) (USD Billion)

10.3.2.13.3 Austria Vitamins Market Estimates and Forecasts, by Application (2020-2032) (USD Billion)

10.3.2.14 Rest of Western Europe

10.3.2.14.1 Rest of Western Europe Vitamins Market Estimates and Forecasts, by Source (2020-2032) (USD Billion)

10.3.2.14.2 Rest of Western Europe Vitamins Market Estimates and Forecasts, by Type (2020-2032) (USD Billion)

10.3.2.14.3 Rest of Western Europe Vitamins Market Estimates and Forecasts, by Application (2020-2032) (USD Billion)

10.4 Asia Pacific

10.4.1 Trends Analysis

10.4.2 Asia Pacific Vitamins Market Estimates and Forecasts, by Country (2020-2032) (USD Billion)

10.4.3 Asia Pacific Vitamins Market Estimates and Forecasts, by Source (2020-2032) (USD Billion) 

10.4.4 Asia Pacific Vitamins Market Estimates and Forecasts, by Type (2020-2032) (USD Billion)

10.4.5 Asia Pacific Vitamins Market Estimates and Forecasts, by Application (2020-2032) (USD Billion)

10.4.6 China

10.4.6.1 China Vitamins Market Estimates and Forecasts, by Source (2020-2032) (USD Billion)

10.4.6.2 China Vitamins Market Estimates and Forecasts, by Type (2020-2032) (USD Billion)

10.4.6.3 China Vitamins Market Estimates and Forecasts, by Application (2020-2032) (USD Billion)

10.4.7 India

10.4.7.1 India Vitamins Market Estimates and Forecasts, by Source (2020-2032) (USD Billion)

10.4.7.2 India Vitamins Market Estimates and Forecasts, by Type (2020-2032) (USD Billion)

10.4.7.3 India Vitamins Market Estimates and Forecasts, by Application (2020-2032) (USD Billion)

10.4.8 Japan

10.4.8.1 Japan Vitamins Market Estimates and Forecasts, by Source (2020-2032) (USD Billion)

10.4.8.2 Japan Vitamins Market Estimates and Forecasts, by Type (2020-2032) (USD Billion)

10.4.8.3 Japan Vitamins Market Estimates and Forecasts, by Application (2020-2032) (USD Billion)

10.4.9 South Korea

10.4.9.1 South Korea Vitamins Market Estimates and Forecasts, by Source (2020-2032) (USD Billion)

10.4.9.2 South Korea Vitamins Market Estimates and Forecasts, by Type (2020-2032) (USD Billion)

10.4.9.3 South Korea Vitamins Market Estimates and Forecasts, by Application (2020-2032) (USD Billion)

10.4.10 Vietnam

10.4.10.1 Vietnam Vitamins Market Estimates and Forecasts, by Source (2020-2032) (USD Billion)

10.4.10.2 Vietnam Vitamins Market Estimates and Forecasts, by Type (2020-2032) (USD Billion)

10.4.10.3 Vietnam Vitamins Market Estimates and Forecasts, by Application (2020-2032) (USD Billion)

10.4.11 Singapore

10.4.11.1 Singapore Vitamins Market Estimates and Forecasts, by Source (2020-2032) (USD Billion)

10.4.11.2 Singapore Vitamins Market Estimates and Forecasts, by Type (2020-2032) (USD Billion)

10.4.11.3 Singapore Vitamins Market Estimates and Forecasts, by Application (2020-2032) (USD Billion)

10.4.12 Australia

10.4.12.1 Australia Vitamins Market Estimates and Forecasts, by Source (2020-2032) (USD Billion)

10.4.12.2 Australia Vitamins Market Estimates and Forecasts, by Type (2020-2032) (USD Billion)

10.4.12.3 Australia Vitamins Market Estimates and Forecasts, by Application (2020-2032) (USD Billion)

10.4.13 Rest of Asia Pacific

10.4.13.1 Rest of Asia Pacific Vitamins Market Estimates and Forecasts, by Source (2020-2032) (USD Billion)

10.4.13.2 Rest of Asia Pacific Vitamins Market Estimates and Forecasts, by Type (2020-2032) (USD Billion)

10.4.13.3 Rest of Asia Pacific Vitamins Market Estimates and Forecasts, by Application (2020-2032) (USD Billion)

10.5 Middle East and Africa

10.5.1 Middle East

10.5.1.1 Trends Analysis

10.5.1.2 Middle East Vitamins Market Estimates and Forecasts, by Country (2020-2032) (USD Billion)

10.5.1.3 Middle East Vitamins Market Estimates and Forecasts, by Source (2020-2032) (USD Billion) 

10.5.1.4 Middle East Vitamins Market Estimates and Forecasts, by Type (2020-2032) (USD Billion)

10.5.1.5 Middle East Vitamins Market Estimates and Forecasts, by Application (2020-2032) (USD Billion)

10.5.1.6 UAE

10.5.1.6.1 UAE Vitamins Market Estimates and Forecasts, by Source (2020-2032) (USD Billion)

10.5.1.6.2 UAE Vitamins Market Estimates and Forecasts, by Type (2020-2032) (USD Billion)

10.5.1.6.3 UAE Vitamins Market Estimates and Forecasts, by Application (2020-2032) (USD Billion)

10.5.1.7 Egypt

10.5.1.7.1 Egypt Vitamins Market Estimates and Forecasts, by Source (2020-2032) (USD Billion)

10.5.1.7.2 Egypt Vitamins Market Estimates and Forecasts, by Type (2020-2032) (USD Billion)

10.5.1.7.3 Egypt Vitamins Market Estimates and Forecasts, by Application (2020-2032) (USD Billion)

10.5.1.8 Saudi Arabia

10.5.1.8.1 Saudi Arabia Vitamins Market Estimates and Forecasts, by Source (2020-2032) (USD Billion)

10.5.1.8.2 Saudi Arabia Vitamins Market Estimates and Forecasts, by Type (2020-2032) (USD Billion)

10.5.1.8.3 Saudi Arabia Vitamins Market Estimates and Forecasts, by Application (2020-2032) (USD Billion)

10.5.1.9 Qatar

10.5.1.9.1 Qatar Vitamins Market Estimates and Forecasts, by Source (2020-2032) (USD Billion)

10.5.1.9.2 Qatar Vitamins Market Estimates and Forecasts, by Type (2020-2032) (USD Billion)

10.5.1.9.3 Qatar Vitamins Market Estimates and Forecasts, by Application (2020-2032) (USD Billion)

10.5.1.10 Rest of Middle East

10.5.1.10.1 Rest of Middle East Vitamins Market Estimates and Forecasts, by Source (2020-2032) (USD Billion)

10.5.1.10.2 Rest of Middle East Vitamins Market Estimates and Forecasts, by Type (2020-2032) (USD Billion)

10.5.1.10.3 Rest of Middle East Vitamins Market Estimates and Forecasts, by Application (2020-2032) (USD Billion)

10.5.2 Africa

10.5.2.1 Trends Analysis

10.5.2.2 Africa Vitamins Market Estimates and Forecasts, by Country (2020-2032) (USD Billion)

10.5.2.3 Africa Vitamins Market Estimates and Forecasts, by Source (2020-2032) (USD Billion) 

10.5.2.4 Africa Vitamins Market Estimates and Forecasts, by Type (2020-2032) (USD Billion)

10.5.2.5 Africa Vitamins Market Estimates and Forecasts, by Application (2020-2032) (USD Billion)

10.5.2.6 South Africa

10.5.2.6.1 South Africa Vitamins Market Estimates and Forecasts, by Source (2020-2032) (USD Billion)

10.5.2.6.2 South Africa Vitamins Market Estimates and Forecasts, by Type (2020-2032) (USD Billion)

10.5.2.6.3 South Africa Vitamins Market Estimates and Forecasts, by Application (2020-2032) (USD Billion)

10.5.2.7 Nigeria

10.5.2.7.1 Nigeria Vitamins Market Estimates and Forecasts, by Source (2020-2032) (USD Billion)

10.5.2.7.2 Nigeria Vitamins Market Estimates and Forecasts, by Type (2020-2032) (USD Billion)

10.5.2.7.3 Nigeria Vitamins Market Estimates and Forecasts, by Application (2020-2032) (USD Billion)

10.5.2.8 Rest of Africa

10.5.2.8.1 Rest of Africa Vitamins Market Estimates and Forecasts, by Source (2020-2032) (USD Billion)

10.5.2.8.2 Rest of Africa Vitamins Market Estimates and Forecasts, by Type (2020-2032) (USD Billion)

10.5.2.8.3 Rest of Africa Vitamins Market Estimates and Forecasts, by Application (2020-2032) (USD Billion)

10.6 Latin America

10.6.1 Trends Analysis

10.6.2 Latin America Vitamins Market Estimates and Forecasts, by Country (2020-2032) (USD Billion)

10.6.3 Latin America Vitamins Market Estimates and Forecasts, by Source (2020-2032) (USD Billion) 

10.6.4 Latin America Vitamins Market Estimates and Forecasts, by Type (2020-2032) (USD Billion)

10.6.5 Latin America Vitamins Market Estimates and Forecasts, by Application (2020-2032) (USD Billion)

10.6.6 Brazil

10.6.6.1 Brazil Vitamins Market Estimates and Forecasts, by Source (2020-2032) (USD Billion)

10.6.6.2 Brazil Vitamins Market Estimates and Forecasts, by Type (2020-2032) (USD Billion)

10.6.6.3 Brazil Vitamins Market Estimates and Forecasts, by Application (2020-2032) (USD Billion)

10.6.7 Argentina

10.6.7.1 Argentina Vitamins Market Estimates and Forecasts, by Source (2020-2032) (USD Billion)

10.6.7.2 Argentina Vitamins Market Estimates and Forecasts, by Type (2020-2032) (USD Billion)

10.6.7.3 Argentina Vitamins Market Estimates and Forecasts, by Application (2020-2032) (USD Billion)

10.6.8 Colombia

10.6.8.1 Colombia Vitamins Market Estimates and Forecasts, by Source (2020-2032) (USD Billion)

10.6.8.2 Colombia Vitamins Market Estimates and Forecasts, by Type (2020-2032) (USD Billion)

10.6.8.3 Colombia Vitamins Market Estimates and Forecasts, by Application (2020-2032) (USD Billion)

10.6.9 Rest of Latin America

10.6.9.1 Rest of Latin America Vitamins Market Estimates and Forecasts, by Source (2020-2032) (USD Billion)

10.6.9.2 Rest of Latin America Vitamins Market Estimates and Forecasts, by Type (2020-2032) (USD Billion)

10.6.9.3 Rest of Latin America Vitamins Market Estimates and Forecasts, by Application (2020-2032) (USD Billion)

11. Company Profiles

11.1 Koninklijke DSM NV

11.1.1 Company Overview

11.1.2 Financial

11.1.3 Product / Services Offered

11.1.4 SWOT Analysis

11.2 Glanbia PLC

11.2.1 Company Overview

11.2.2 Financial

11.2.3 Product / Services Offered

11.2.4 SWOT Analysis

11.3 Lonza Group

11.3.1 Company Overview

11.3.2 Financial

11.3.3 Product / Services Offered

11.3.4 SWOT Analysis

11.4 Vitablend Nederland BV

11.4.1 Company Overview

11.4.2 Financial

11.4.3 Product / Services Offered

11.4.4 SWOT Analysis

11.5 SternVitamin GmbH

11.5.1 Company Overview

11.5.2 Financial

11.5.3 Product / Services Offered

11.5.4 SWOT Analysis

11.6 Zhejiang Garden Biochemical High-Tech Co., Ltd

             11.6.1 Company Overview

11.6.2 Financial

11.6.3 Product / Services Offered

11.6.4 SWOT Analysis

11.7 Rabar Pty Ltd.

11.7.1 Company Overview

11.7.2 Financial

11.7.3 Product / Services Offered

11.7.4 SWOT Analysis

11.8 Agrana Beteiligungs-AG

11.8.1 Company Overview

11.8.2 Financial

11.8.3 Product / Services Offered

11.8.4 SWOT Analysis

11.9 Grain Processing Corporation

11.9.1 Company Overview

11.9.2 Financial

11.9.3 Product / Services Offered

11.9.4 SWOT Analysis

11.10 Roquette Frères

11.10.1 Company Overview

11.10.2 Financial

11.10.3 Product / Services Offered

11.10.4 SWOT Analysis

12. Use Cases and Best Practices

13. Conclusion

An accurate research report requires proper strategizing as well as implementation. There are multiple factors involved in the completion of good and accurate research report and selecting the best methodology to compete the research is the toughest part. Since the research reports we provide play a crucial role in any company’s decision-making process, therefore we at SNS Insider always believe that we should choose the best method which gives us results closer to reality. This allows us to reach at a stage wherein we can provide our clients best and accurate investment to output ratio.

Each report that we prepare takes a timeframe of 350-400 business hours for production. Starting from the selection of titles through a couple of in-depth brain storming session to the final QC process before uploading our titles on our website we dedicate around 350 working hours. The titles are selected based on their current market cap and the foreseen CAGR and growth.


The 5 steps process:

Step 1: Secondary Research:

Secondary Research or Desk Research is as the name suggests is a research process wherein, we collect data through the readily available information. In this process we use various paid and unpaid databases which our team has access to and gather data through the same. This includes examining of listed companies’ annual reports, Journals, SEC filling etc. Apart from this our team has access to various associations across the globe across different industries. Lastly, we have exchange relationships with various university as well as individual libraries.

Secondary Research

Step 2: Primary Research

When we talk about primary research, it is a type of study in which the researchers collect relevant data samples directly, rather than relying on previously collected data.  This type of research is focused on gaining content specific facts that can be sued to solve specific problems. Since the collected data is fresh and first hand therefore it makes the study more accurate and genuine.

We at SNS Insider have divided Primary Research into 2 parts.

Part 1 wherein we interview the KOLs of major players as well as the upcoming ones across various geographic regions. This allows us to have their view over the market scenario and acts as an important tool to come closer to the accurate market numbers. As many as 45 paid and unpaid primary interviews are taken from both the demand and supply side of the industry to make sure we land at an accurate judgement and analysis of the market.

This step involves the triangulation of data wherein our team analyses the interview transcripts, online survey responses and observation of on filed participants. The below mentioned chart should give a better understanding of the part 1 of the primary interview.

Primary Research

Part 2: In this part of primary research the data collected via secondary research and the part 1 of the primary research is validated with the interviews from individual consultants and subject matter experts.

Consultants are those set of people who have at least 12 years of experience and expertise within the industry whereas Subject Matter Experts are those with at least 15 years of experience behind their back within the same space. The data with the help of two main processes i.e., FGDs (Focused Group Discussions) and IDs (Individual Discussions). This gives us a 3rd party nonbiased primary view of the market scenario making it a more dependable one while collation of the data pointers.

Step 3: Data Bank Validation

Once all the information is collected via primary and secondary sources, we run that information for data validation. At our intelligence centre our research heads track a lot of information related to the market which includes the quarterly reports, the daily stock prices, and other relevant information. Our data bank server gets updated every fortnight and that is how the information which we collected using our primary and secondary information is revalidated in real time.

Data Bank Validation

Step 4: QA/QC Process

After all the data collection and validation our team does a final level of quality check and quality assurance to get rid of any unwanted or undesired mistakes. This might include but not limited to getting rid of the any typos, duplication of numbers or missing of any important information. The people involved in this process include technical content writers, research heads and graphics people. Once this process is completed the title gets uploader on our platform for our clients to read it.

Step 5: Final QC/QA Process:

This is the last process and comes when the client has ordered the study. In this process a final QA/QC is done before the study is emailed to the client. Since we believe in giving our clients a good experience of our research studies, therefore, to make sure that we do not lack at our end in any way humanly possible we do a final round of quality check and then dispatch the study to the client.

Key Market Segmentation

By Source

  • Natural

  • Synthetic

By Type

  • Vitamin B

  • Vitamin E

  • Vitamin D

  • Vitamin C

  • Vitamin A

  • Vitamin K

By Application

  • Healthcare products

  • Food & Beverages

    • Infant Foods

    • Dairy products

    • Bakery & confectionary products

    • Beverages

    • Others

  • Feed

  • Personal care products

Request for Segment Customization as per your Business Requirement: Segment Customization Request

Regional Coverage:

North America

  • US

  • Canada

  • Mexico

Europe

  • Eastern Europe

    • Poland

    • Romania

    • Hungary

    • Turkey

    • Rest of Eastern Europe

  • Western Europe

    • Germany

    • France

    • UK

    • Italy

    • Spain

    • Netherlands

    • Switzerland

    • Austria

    • Rest of Western Europe

Asia Pacific

  • China

  • India

  • Japan

  • South Korea

  • Vietnam

  • Singapore

  • Australia

  • Rest of Asia Pacific

Middle East & Africa

Middle East

  • UAE

  • Egypt

  • Saudi Arabia

  • Qatar

  • Rest of the Middle East

Africa

  • Nigeria

  • South Africa

  • Rest of Africa

Latin America

  • Brazil

  • Argentina

  • Colombia

  • Rest of Latin America

Request for Country Level Research Report: Country Level Customization Request

Available Customization

With the given market data, SNS Insider offers customization to meet the company’s specific needs. The following customization options are available for the report:

  • Product Analysis

  • Criss-Cross segment analysis (e.g. Product X Application)

  • Product Matrix which gives a detailed comparison of the product portfolio of each company

  • Geographic Analysis

  • Additional countries in any of the regions

  • Company Information

  • Detailed analysis and profiling of additional market players (Up to five)


  •            5000 (33% Discount)


  •            8950 (40% Discount)


  •            3050 (23% Discount)

Start a Conversation

Hi! Click one of our member below to chat on Phone