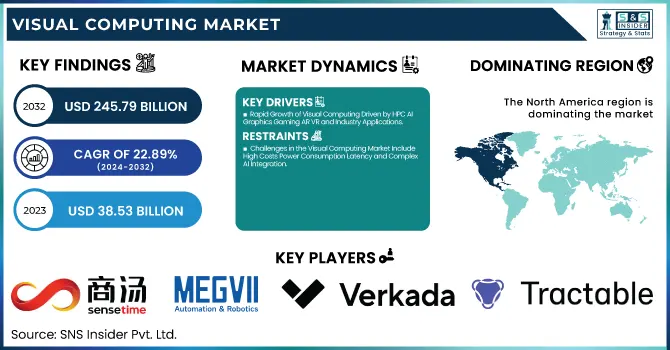
The Visual Computing Market was valued at USD 38.53 billion in 2023 and is expected to reach USD 245.79 billion by 2032, growing at a CAGR of 22.89% over the forecast period 2024-2032. Real-time analysis of images and videos using AI and edge computing is rapidly changing the visual computing market and making it more efficient, transforming various industries. This is also leading to a drive towards cloud-based visual computing and rendering, which enables high-performance graphics to be processed remotely allowing for greater scalability and accessibility. From higher resolution to more sophisticated OLED/MicroLED adoption, display technology advances will redefine user experiences. Visuals appeal to consumers and help drive them towards making a purchase image and video Processing capabilities are driving innovations in automation, surveillance, healthcare, and entertainment thereby making visual computing one of the key enablers of next-gen visual-computing-driven digital transformation defining the future of the enterprises. Significant improvements were made in the U.S. graphics computing market, particularly in the gaming, healthcare, and automotive sectors. Gaming continued to thrive, fuelled by an appetite for more realistic experiences. Hardware, especially GPUs, was key, this mostly shows how powerful computing systems were necessary.
The U.S. Visual Computing Market is estimated to be USD 10.84 Billion in 2023 and is projected to grow at a CAGR of 22.70%. Advancements in AI, edge & cloud computing, rendering, Display technologies (OLED), the growing demand for entertainment & gaming, healthcare applications & the rapid adaptation of AI-powered Intelligent visual processing of images/videos are driving the U.S. visual computing market to grow due to an enhanced level of user-experience and efficiencies.
Key Drivers:
Rapid Growth of Visual Computing Driven by HPC AI Graphics Gaming AR VR and Industry Applications
Growing demand for HPC, AI-based graphics, and different real-time rendering applications drives the Visual Draining Market, which is growing rapidly. Especially growth of the gaming and media & entertainment sectors has been attributed to the market growth, with GPU, AR/VR, and real-time ray tracing development supporting a great deal in improving user experience. Meantime, other industries like automotive and healthcare are also adopting visual computing for such applications as autonomous driving simulation, AI-based diagnostic, and 3D medical imaging. Growing applications in AI including deep learning and computer vision are additionally boosting the market growth. Cloud-based visual computing is also accelerating, giving easily scalable GPU-based solutions for video processing, simulation, and digital content creation to businesses.
Restrain:
Challenges in the Visual Computing Market Include High Costs Power Consumption Latency and Complex AI Integration
The Visual Computing Market is facing challenges such as high hardware costs and high power consumption. The existing advanced GPUs, high-performance computing (HPC) systems, and AI-powered visual computing solutions require considerable investments on the part of the designer which creates limited adoption scopes for small and medium-sized enterprises (SMEs) as they don’t want to be working in the field full of complexities and high costs. Moreover, the power-hungry nature of high-end GPUs along with their application in data centers has resulted in serious energy efficiency questions, which call for a sustainable solution. Another challenge is the complexity of adopting AI-based visual computing into legacy IT frameworks, which may require investments in high-value software coding and expertise. In addition, heavy latency is really bad for cloud-based visual computing, especially gaming and real-time rendering, which makes it difficult to provide seamless user experiences.
Opportunity:
Endless Opportunities in Visual Computing Driven by Metaverse Smart Manufacturing Defense Gaming and AI
The market opportunities are endless as the new metaverse investments with digital twin and interactive display technologies development provide fresh growth opportunities. Visual computing is gaining traction in smart manufacturing for applications like quality inspection and predictive maintenance. Additionally, the military & defense sector is adopting real-time simulations for training & surveillance, which is driving the demand for this component. AI-based edge computing and 5G-enabled cloud gaming are other areas that are expected to generate new revenues. Organizations that are investing in energy-efficient GPUs, real-time AI analytics, and immersive technologies will be in the right position to take advantage of future opportunities.
Challenges:
Data Security Privacy Geopolitical Issues and AI Shortages Pose Challenges to Visual Computing Market Growth
Another hugely significant obstacle is the issue of data security and privacy especially in sectors like healthcare, finance, and defense, which involves processing and storing sensitive visual data. Other threats include spreading misinformation and digital fraud due to the increase of deepfake technology and AI-generated content. However, the widespread adoption of visual computing is constrained by the visual computing software-hardware compatibility gap and shortage of AI-trained professionals. Various geopolitical factors, such as shortages of chips or the trade limits on industry components can in addition to this, cause interruptions in the supply chain, thereby, hindering the growth scope of this market. These challenges will need to be addressed through ongoing advances in energy-efficient chips, improved cybersecurity, and optimized compilers and tools for AI.
By Component
The hardware segment accounted for a 60.7% share of the Visual Computing Market in 2023 due to the rising demand for high-performance GPUs, AI processors, and advanced display technologies. This growth is fueled by increased penetration of ray tracing GPUs, AR/VR headsets, and edge computing devices in gaming, media, and industrial applications. Furthermore, high-end visual computing hardware is being adopted by industries such as automotive, healthcare, and defense for real-time simulations, AI-enabled analytics, and immersive experiences.
The fastest growing CAGR is predicted to be for the software segment, which is driven by advances in graphics created by artificial intelligence, improvements in real-time rendering, and the development of cloud-based visualization software. The transition to cloud gaming, metaverse platforms, and digital twins driving demand for visual computing software solutions. In addition to these trends, the next generation of visual computing technologies is powered by high-speed software innovations such as AI-driven content creation, deep learning models, and simulation software, all of which have made software a key driving force for the future.
By Display Platform
Monitors captured the highest market share of 33.4% in 2023 in the Visual Computing Market. The proliferation of high-resolution, AI-enabled, and gaming displays has given rise to this expansion, especially in the gaming, media & entertainment, and professional visualization industries. Higher consumer requirements of 4K and 8K Displays, OLED, and high refresh displays have gained momentum in gaming, creative & industrial applications which has driven the Display Market industry growth in the forecast period. Secondly, the growing demand for monitors in healthcare automotive design, and finance trading is expected to drive the Market growth.
The interactive kiosk segment is projected to exhibit the fastest CAGR in the analyzed period of 2024-2032, owing to increased demand for self-service technologies found in retail, banking, healthcare, and smart cities. This coupled with increasing kiosk adoption for digital signage, ticketing, and customer engagement is expected to propel the market growth. These displays are coupled with several advancements such as AI-driven interactive displays, and integration with cloud for kiosk management, which is making interactive kiosks one of the significant innovation drivers in the visual computing ecosystem.
By Industry Verticals
In 2023, gaming dominated the Visual Computing Market, capturing a 31.5% market share. The heightened demand for high-performance GPUs, real-time ray tracing, and engaging gaming experiences drove this growth. Other trends such as the growing cloud gaming, esports, and VR/AR gaming platforms have also contributed to the market growth. Moreover, the gaming ecosystem has evolved with a series of advancements including AI-driven game rendering, realistic physics engines, and seamless integration with the metaverse. More 8K displays, 240Hz monitors, and AI gaming assistants will just keep pushing this space forward.
The healthcare sector is expected to witness the highest CAGR growth over the forecast period from 2024-2032 owing to the incorporation of AI in 3D medical imaging as well as augmented reality for diagnosis and surgeries. Today, we see visual computing increasingly being utilized for applications from medical simulations and robotic-assisted surgeries to AI diagnostics in radiology changing how patients are cared for in hospitals around the world. In addition, telemedicine, virtual training for healthcare workers, and AI-powered predictive analytics are creating opportunities that have turned healthcare into one of the most exciting domains in visual computing.
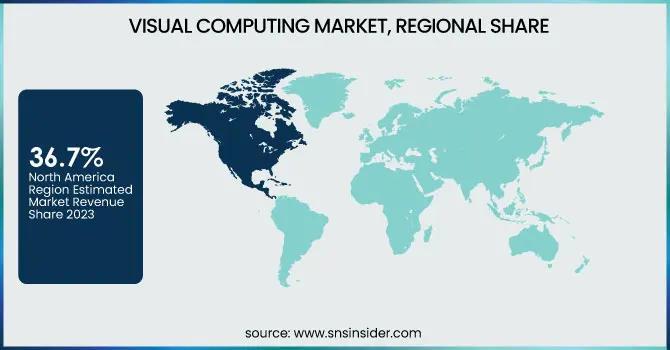
Regional Analysis
Visual Computing Market in North America held a 36.7% market share in 2023, as it is one of the leading regions for technological advancements, AI, gaming, Cloud computing, and industrial automation (established and matured ecosystem also available for these sectors). The presence of important industry players such as NVIDIA, Intel, AMD, and Microsoft has boosted innovations in AI-enabled GPUs, real-time rendering, and cloud-based visual computing solutions. It's a cloud gaming powerhouse (Google Stadia, NVIDIA GeForce Now) cloud driving vehicle of AR/VR (Meta Quest devices) autonomous vehicles (Tesla, Waymo) dominance adding even more Beau and Braun to the market. Furthermore, the use of visual computing in healthcare for AI-enabled diagnostics and robotic surgeries (IBM Watson Health, GE Healthcare imaging solutions) in North America highlights the region.
Asia Pacific is estimated to grow at the highest CAGR from 2024-2032 owing to the increasing investments in AI, gaming, and smart city infrastructure. China, Japan, and South Korea are already pushing the frontiers of AI games (Tencent, Sony PlayStation, NetEase), semiconductor production (TSMC, Samsung), and industrial automation. The regional market is gaining momentum through the rapid deployment of 5G networks combined with cloud visual computing (Alibaba Cloud, Baidu AI Cloud) and the adoption of AI in healthcare (Ping An Good Doctor, SenseTime for medical imaging). Finally, the continued development of digital twin technology in the region for manufacturing (Siemens in China, Mitsubishi in Japan, etc) showcases the disruptive capabilities of visual computing in the Asia Pacific.
Some of the major players in the Visual Computing Market are:
SenseTime (SenseFoundry),
Megvii (Face++),
viso.ai (Viso Suite),
Nauto (AI Fleet Safety Platform),
Verkada (Command Platform),
Tractable (AI Estimating),
Airobotics (Automated Industrial Drones),
Hawk-Eye Innovations (SMART),
Trigo (EasyOut),
Movidius (Myriad X),
Standard Cognition (Standard Checkout),
Orbital Insight (GO Platform),
AnyClip (Luminous Video Platform),
Bossa Nova Robotics (Inventory Scanning Robot),
Descartes Labs (Geospatial Analytics Platform).
In September 2024, Verkada unveils AI-powered Alerts, next-gen cameras, intercoms, and door readers at VerkadaOne, enhancing security with real-time event detection. The new hardware offers improved image quality, faster processing, and advanced access control.
In July 2024, Nauto's AI-powered in-vehicle cameras monitor drivers for distractions like phone use and drowsiness, issuing real-time alerts to prevent collisions.
Report Attributes | Details |
Market Size in 2023 | USD 38.53 Billion |
Market Size by 2032 | USD 245.79 Billion |
CAGR | CAGR of 22.89% From 2024 to 2032 |
Base Year | 2023 |
Forecast Period | 2024-2032 |
Historical Data | 2020-2022 |
Report Scope & Coverage | Market Size, Segments Analysis, Competitive Landscape, Regional Analysis, DROC & SWOT Analysis, Forecast Outlook |
Key Segments | • By Component (Hardware, Software) • By Display Platform (Interactive Whiteboards, Interactive Kiosk, Interactive Table, Interactive Video Wall, Monitors, Others) • By Industry Verticals (Gaming, Media & Entertainment, Healthcare, Automotive, Manufacturing, Military & Defense, Others) |
Regional Analysis/Coverage | North America (US, Canada, Mexico), Europe (Eastern Europe [Poland, Romania, Hungary, Turkey, Rest of Eastern Europe] Western Europe] Germany, France, UK, Italy, Spain, Netherlands, Switzerland, Austria, Rest of Western Europe]), Asia Pacific (China, India, Japan, South Korea, Vietnam, Singapore, Australia, Rest of Asia Pacific), Middle East & Africa (Middle East [UAE, Egypt, Saudi Arabia, Qatar, Rest of Middle East], Africa [Nigeria, South Africa, Rest of Africa], Latin America (Brazil, Argentina, Colombia, Rest of Latin America) |
Company Profiles | SenseTime, Megvii, viso.ai, Nauto, Verkada, Tractable, Airobotics, Hawk-Eye Innovations, Trigo, Movidius, Standard Cognition, Orbital Insight, AnyClip, Bossa Nova Robotics, Descartes Labs. |
Ans: The Visual Computing Market is expected to grow at a CAGR of 22.89% during 2024-2032.
Ans: Visual Computing Market size was USD 38.53 billion in 2023 and is expected to Reach USD 245.79 billion by 2032.
Ans: The major growth factor of the Visual Computing Market is the increasing adoption of AI-powered GPUs, real-time rendering, AR/VR, and cloud-based visualization across gaming, healthcare, and industrial applications
Ans: The Hardware segment dominated the Visual Computing Market in 2023.
Ans: North America dominated the Visual Computing Market in 2023.
Table of Content
1. Introduction
1.1 Market Definition
1.2 Scope (Inclusion and Exclusions)
1.3 Research Assumptions
2. Executive Summary
2.1 Market Overview
2.2 Regional Synopsis
2.3 Competitive Summary
3. Research Methodology
3.1 Top-Down Approach
3.2 Bottom-up Approach
3.3. Data Validation
3.4 Primary Interviews
4. Market Dynamics Impact Analysis
4.1 Market Driving Factors Analysis
4.1.1 Drivers
4.1.2 Restraints
4.1.3 Opportunities
4.1.4 Challenges
4.2 PESTLE Analysis
4.3 Porter’s Five Forces Model
5. Statistical Insights and Trends Reporting
5.1 AI & Edge Computing Adoption in Visual Computing
5.2 Cloud-Based Visual Computing & Rendering Trends
5.3 Display Technology Innovations & Adoption
5.4 AI-Powered Image & Video Processing Growth
6. Competitive Landscape
6.1 List of Major Companies, By Region
6.2 Market Share Analysis, By Region
6.3 Product Benchmarking
6.3.1 Product specifications and features
6.3.2 Pricing
6.4 Strategic Initiatives
6.4.1 Marketing and Promotional Activities
6.4.2 Distribution and Supply Chain Strategies
6.4.3 Expansion plans and new product launches
6.4.4 Strategic partnerships and collaborations
6.5 Technological Advancements
6.6 Market Positioning and Branding
7. Visual Computing Market Segmentation, By Component
7.1 Chapter Overview
7.2 Hardware
7.2.1 Hardware Market Trends Analysis (2020-2032)
7.2.2 Hardware Market Size Estimates and Forecasts to 2032 (USD Billion)
7.3 Software
7.3.1 Software Market Trends Analysis (2020-2032)
7.3.2 Software Market Size Estimates and Forecasts to 2032 (USD Billion)
8. Visual Computing Market Segmentation, By Display Platform
8.1 Chapter Overview
8.2 Interactive Whiteboards
8.2.1 Interactive Whiteboards Market Trends Analysis (2020-2032)
8.2.2 Interactive Whiteboards Market Size Estimates and Forecasts to 2032 (USD Billion)
8.3 Interactive Kiosk
8.3.1 Interactive Kiosk Market Trends Analysis (2020-2032)
8.3.2 Interactive Kiosk Market Size Estimates and Forecasts to 2032 (USD Billion)
8.4 Interactive Table
8.4.1 Interactive Table Market Trends Analysis (2020-2032)
8.4.2 Interactive Table Market Size Estimates and Forecasts to 2032 (USD Billion)
8.5 Interactive Video Wall
8.5.1 Interactive Video Wall Market Trends Analysis (2020-2032)
8.5.2 Interactive Video Wall Market Size Estimates and Forecasts to 2032 (USD Billion)
8.6 Monitors
8.6.1 Monitors Market Trends Analysis (2020-2032)
8.6.2 Monitors Market Size Estimates and Forecasts to 2032 (USD Billion)
8.7 Others
8.7.1 Others Market Trends Analysis (2020-2032)
8.7.2 Others Market Size Estimates and Forecasts to 2032 (USD Billion)
9. Visual Computing Market Segmentation, By Industry Verticals
9.1 Chapter Overview
9.2 Gaming
9.2.1 Gaming Market Trends Analysis (2020-2032)
9.2.2 Gaming Market Size Estimates and Forecasts to 2032 (USD Billion)
9.3 Media & Entertainment
9.3.1 Media & Entertainment Market Trends Analysis (2020-2032)
9.3.2 Media & Entertainment Market Size Estimates and Forecasts to 2032 (USD Billion)
9.4 Healthcare
9.4.1 Healthcare Market Trends Analysis (2020-2032)
9.4.2 Healthcare Market Size Estimates and Forecasts to 2032 (USD Billion)
9.5 Automotive
9.5.1 Automotive Market Trends Analysis (2020-2032)
9.5.2 Automotive Market Size Estimates and Forecasts to 2032 (USD Billion)
9.6 Manufacturing
9.6.1 Manufacturing Market Trends Analysis (2020-2032)
9.6.2 Manufacturing Market Size Estimates and Forecasts to 2032 (USD Billion)
9.7 Military & Defense
9.7.1 Military & Defense Market Trends Analysis (2020-2032)
9.7.2 Military & Defense Market Size Estimates and Forecasts to 2032 (USD Billion)
9.8 Others
9.8.1 Others Market Trends Analysis (2020-2032)
9.8.2 Others Market Size Estimates and Forecasts to 2032 (USD Billion)
10. Regional Analysis
10.1 Chapter Overview
10.2 North America
10.2.1 Trends Analysis
10.2.2 North America Visual Computing Market Estimates and Forecasts, by Country (2020-2032) (USD Billion)
10.2.3 North America Visual Computing Market Estimates and Forecasts, By Component (2020-2032) (USD Billion)
10.2.4 North America Visual Computing Market Estimates and Forecasts, By Display Platform (2020-2032) (USD Billion)
10.2.5 North America Visual Computing Market Estimates and Forecasts, By Industry Verticals (2020-2032) (USD Billion)
10.2.6 USA
10.2.6.1 USA Visual Computing Market Estimates and Forecasts, By Component (2020-2032) (USD Billion)
10.2.6.2 USA Visual Computing Market Estimates and Forecasts, By Display Platform (2020-2032) (USD Billion)
10.2.6.3 USA Visual Computing Market Estimates and Forecasts, By Industry Verticals (2020-2032) (USD Billion)
10.2.7 Canada
10.2.7.1 Canada Visual Computing Market Estimates and Forecasts, By Component (2020-2032) (USD Billion)
10.2.7.2 Canada Visual Computing Market Estimates and Forecasts, By Display Platform (2020-2032) (USD Billion)
10.2.7.3 Canada Visual Computing Market Estimates and Forecasts, By Industry Verticals (2020-2032) (USD Billion)
10.2.8 Mexico
10.2.8.1 Mexico Visual Computing Market Estimates and Forecasts, By Component (2020-2032) (USD Billion)
10.2.8.2 Mexico Visual Computing Market Estimates and Forecasts, By Display Platform (2020-2032) (USD Billion)
10.2.8.3 Mexico Visual Computing Market Estimates and Forecasts, By Industry Verticals (2020-2032) (USD Billion)
10.3 Europe
10.3.1 Eastern Europe
10.3.1.1 Trends Analysis
10.3.1.2 Eastern Europe Visual Computing Market Estimates and Forecasts, by Country (2020-2032) (USD Billion)
10.3.1.3 Eastern Europe Visual Computing Market Estimates and Forecasts, By Component (2020-2032) (USD Billion)
10.3.1.4 Eastern Europe Visual Computing Market Estimates and Forecasts, By Display Platform (2020-2032) (USD Billion)
10.3.1.5 Eastern Europe Visual Computing Market Estimates and Forecasts, By Industry Verticals (2020-2032) (USD Billion)
10.3.1.6 Poland
10.3.1.6.1 Poland Visual Computing Market Estimates and Forecasts, By Component (2020-2032) (USD Billion)
10.3.1.6.2 Poland Visual Computing Market Estimates and Forecasts, By Display Platform (2020-2032) (USD Billion)
10.3.1.6.3 Poland Visual Computing Market Estimates and Forecasts, By Industry Verticals (2020-2032) (USD Billion)
10.3.1.7 Romania
10.3.1.7.1 Romania Visual Computing Market Estimates and Forecasts, By Component (2020-2032) (USD Billion)
10.3.1.7.2 Romania Visual Computing Market Estimates and Forecasts, By Display Platform (2020-2032) (USD Billion)
10.3.1.7.3 Romania Visual Computing Market Estimates and Forecasts, By Industry Verticals (2020-2032) (USD Billion)
10.3.1.8 Hungary
10.3.1.8.1 Hungary Visual Computing Market Estimates and Forecasts, By Component (2020-2032) (USD Billion)
10.3.1.8.2 Hungary Visual Computing Market Estimates and Forecasts, By Display Platform (2020-2032) (USD Billion)
10.3.1.8.3 Hungary Visual Computing Market Estimates and Forecasts, By Industry Verticals (2020-2032) (USD Billion)
10.3.1.9 Turkey
10.3.1.9.1 Turkey Visual Computing Market Estimates and Forecasts, By Component (2020-2032) (USD Billion)
10.3.1.9.2 Turkey Visual Computing Market Estimates and Forecasts, By Display Platform (2020-2032) (USD Billion)
10.3.1.9.3 Turkey Visual Computing Market Estimates and Forecasts, By Industry Verticals (2020-2032) (USD Billion)
10.3.1.10 Rest of Eastern Europe
10.3.1.10.1 Rest of Eastern Europe Visual Computing Market Estimates and Forecasts, By Component (2020-2032) (USD Billion)
10.3.1.10.2 Rest of Eastern Europe Visual Computing Market Estimates and Forecasts, By Display Platform (2020-2032) (USD Billion)
10.3.1.10.3 Rest of Eastern Europe Visual Computing Market Estimates and Forecasts, By Industry Verticals (2020-2032) (USD Billion)
10.3.2 Western Europe
10.3.2.1 Trends Analysis
10.3.2.2 Western Europe Visual Computing Market Estimates and Forecasts, by Country (2020-2032) (USD Billion)
10.3.2.3 Western Europe Visual Computing Market Estimates and Forecasts, By Component (2020-2032) (USD Billion)
10.3.2.4 Western Europe Visual Computing Market Estimates and Forecasts, By Display Platform (2020-2032) (USD Billion)
10.3.2.5 Western Europe Visual Computing Market Estimates and Forecasts, By Industry Verticals (2020-2032) (USD Billion)
10.3.2.6 Germany
10.3.2.6.1 Germany Visual Computing Market Estimates and Forecasts, By Component (2020-2032) (USD Billion)
10.3.2.6.2 Germany Visual Computing Market Estimates and Forecasts, By Display Platform (2020-2032) (USD Billion)
10.3.2.6.3 Germany Visual Computing Market Estimates and Forecasts, By Industry Verticals (2020-2032) (USD Billion)
10.3.2.7 France
10.3.2.7.1 France Visual Computing Market Estimates and Forecasts, By Component (2020-2032) (USD Billion)
10.3.2.7.2 France Visual Computing Market Estimates and Forecasts, By Display Platform (2020-2032) (USD Billion)
10.3.2.7.3 France Visual Computing Market Estimates and Forecasts, By Industry Verticals (2020-2032) (USD Billion)
10.3.2.8 UK
10.3.2.8.1 UK Visual Computing Market Estimates and Forecasts, By Component (2020-2032) (USD Billion)
10.3.2.8.2 UK Visual Computing Market Estimates and Forecasts, By Display Platform (2020-2032) (USD Billion)
10.3.2.8.3 UK Visual Computing Market Estimates and Forecasts, By Industry Verticals (2020-2032) (USD Billion)
10.3.2.9 Italy
10.3.2.9.1 Italy Visual Computing Market Estimates and Forecasts, By Component (2020-2032) (USD Billion)
10.3.2.9.2 Italy Visual Computing Market Estimates and Forecasts, By Display Platform (2020-2032) (USD Billion)
10.3.2.9.3 Italy Visual Computing Market Estimates and Forecasts, By Industry Verticals (2020-2032) (USD Billion)
10.3.2.10 Spain
10.3.2.10.1 Spain Visual Computing Market Estimates and Forecasts, By Component (2020-2032) (USD Billion)
10.3.2.10.2 Spain Visual Computing Market Estimates and Forecasts, By Display Platform (2020-2032) (USD Billion)
10.3.2.10.3 Spain Visual Computing Market Estimates and Forecasts, By Industry Verticals (2020-2032) (USD Billion)
10.3.2.11 Netherlands
10.3.2.11.1 Netherlands Visual Computing Market Estimates and Forecasts, By Component (2020-2032) (USD Billion)
10.3.2.11.2 Netherlands Visual Computing Market Estimates and Forecasts, By Display Platform (2020-2032) (USD Billion)
10.3.2.11.3 Netherlands Visual Computing Market Estimates and Forecasts, By Industry Verticals (2020-2032) (USD Billion)
10.3.2.12 Switzerland
10.3.2.12.1 Switzerland Visual Computing Market Estimates and Forecasts, By Component (2020-2032) (USD Billion)
10.3.2.12.2 Switzerland Visual Computing Market Estimates and Forecasts, By Display Platform (2020-2032) (USD Billion)
10.3.2.12.3 Switzerland Visual Computing Market Estimates and Forecasts, By Industry Verticals (2020-2032) (USD Billion)
10.3.2.13 Austria
10.3.2.13.1 Austria Visual Computing Market Estimates and Forecasts, By Component (2020-2032) (USD Billion)
10.3.2.13.2 Austria Visual Computing Market Estimates and Forecasts, By Display Platform (2020-2032) (USD Billion)
10.3.2.13.3 Austria Visual Computing Market Estimates and Forecasts, By Industry Verticals (2020-2032) (USD Billion)
10.3.2.14 Rest of Western Europe
10.3.2.14.1 Rest of Western Europe Visual Computing Market Estimates and Forecasts, By Component (2020-2032) (USD Billion)
10.3.2.14.2 Rest of Western Europe Visual Computing Market Estimates and Forecasts, By Display Platform (2020-2032) (USD Billion)
10.3.2.14.3 Rest of Western Europe Visual Computing Market Estimates and Forecasts, By Industry Verticals (2020-2032) (USD Billion)
10.4 Asia Pacific
10.4.1 Trends Analysis
10.4.2 Asia Pacific Visual Computing Market Estimates and Forecasts, by Country (2020-2032) (USD Billion)
10.4.3 Asia Pacific Visual Computing Market Estimates and Forecasts, By Component (2020-2032) (USD Billion)
10.4.4 Asia Pacific Visual Computing Market Estimates and Forecasts, By Display Platform (2020-2032) (USD Billion)
10.4.5 Asia Pacific Visual Computing Market Estimates and Forecasts, By Industry Verticals (2020-2032) (USD Billion)
10.4.6 China
10.4.6.1 China Visual Computing Market Estimates and Forecasts, By Component (2020-2032) (USD Billion)
10.4.6.2 China Visual Computing Market Estimates and Forecasts, By Display Platform (2020-2032) (USD Billion)
10.4.6.3 China Visual Computing Market Estimates and Forecasts, By Industry Verticals (2020-2032) (USD Billion)
10.4.7 India
10.4.7.1 India Visual Computing Market Estimates and Forecasts, By Component (2020-2032) (USD Billion)
10.4.7.2 India Visual Computing Market Estimates and Forecasts, By Display Platform (2020-2032) (USD Billion)
10.4.7.3 India Visual Computing Market Estimates and Forecasts, By Industry Verticals (2020-2032) (USD Billion)
10.4.8 Japan
10.4.8.1 Japan Visual Computing Market Estimates and Forecasts, By Component (2020-2032) (USD Billion)
10.4.8.2 Japan Visual Computing Market Estimates and Forecasts, By Display Platform (2020-2032) (USD Billion)
10.4.8.3 Japan Visual Computing Market Estimates and Forecasts, By Industry Verticals (2020-2032) (USD Billion)
10.4.9 South Korea
10.4.9.1 South Korea Visual Computing Market Estimates and Forecasts, By Component (2020-2032) (USD Billion)
10.4.9.2 South Korea Visual Computing Market Estimates and Forecasts, By Display Platform (2020-2032) (USD Billion)
10.4.9.3 South Korea Visual Computing Market Estimates and Forecasts, By Industry Verticals (2020-2032) (USD Billion)
10.4.10 Vietnam
10.4.10.1 Vietnam Visual Computing Market Estimates and Forecasts, By Component (2020-2032) (USD Billion)
10.4.10.2 Vietnam Visual Computing Market Estimates and Forecasts, By Display Platform (2020-2032) (USD Billion)
10.4.10.3 Vietnam Visual Computing Market Estimates and Forecasts, By Industry Verticals (2020-2032) (USD Billion)
10.4.11 Singapore
10.4.11.1 Singapore Visual Computing Market Estimates and Forecasts, By Component (2020-2032) (USD Billion)
10.4.11.2 Singapore Visual Computing Market Estimates and Forecasts, By Display Platform (2020-2032) (USD Billion)
10.4.11.3 Singapore Visual Computing Market Estimates and Forecasts, By Industry Verticals (2020-2032) (USD Billion)
10.4.12 Australia
10.4.12.1 Australia Visual Computing Market Estimates and Forecasts, By Component (2020-2032) (USD Billion)
10.4.12.2 Australia Visual Computing Market Estimates and Forecasts, By Display Platform (2020-2032) (USD Billion)
10.4.12.3 Australia Visual Computing Market Estimates and Forecasts, By Industry Verticals (2020-2032) (USD Billion)
10.4.13 Rest of Asia Pacific
10.4.13.1 Rest of Asia Pacific Visual Computing Market Estimates and Forecasts, By Component (2020-2032) (USD Billion)
10.4.13.2 Rest of Asia Pacific Visual Computing Market Estimates and Forecasts, By Display Platform (2020-2032) (USD Billion)
10.4.13.3 Rest of Asia Pacific Visual Computing Market Estimates and Forecasts, By Industry Verticals (2020-2032) (USD Billion)
10.5 Middle East and Africa
10.5.1 Middle East
10.5.1.1 Trends Analysis
10.5.1.2 Middle East Visual Computing Market Estimates and Forecasts, by Country (2020-2032) (USD Billion)
10.5.1.3 Middle East Visual Computing Market Estimates and Forecasts, By Component (2020-2032) (USD Billion)
10.5.1.4 Middle East Visual Computing Market Estimates and Forecasts, By Display Platform (2020-2032) (USD Billion)
10.5.1.5 Middle East Visual Computing Market Estimates and Forecasts, By Industry Verticals (2020-2032) (USD Billion)
10.5.1.6 UAE
10.5.1.6.1 UAE Visual Computing Market Estimates and Forecasts, By Component (2020-2032) (USD Billion)
10.5.1.6.2 UAE Visual Computing Market Estimates and Forecasts, By Display Platform (2020-2032) (USD Billion)
10.5.1.6.3 UAE Visual Computing Market Estimates and Forecasts, By Industry Verticals (2020-2032) (USD Billion)
10.5.1.7 Egypt
10.5.1.7.1 Egypt Visual Computing Market Estimates and Forecasts, By Component (2020-2032) (USD Billion)
10.5.1.7.2 Egypt Visual Computing Market Estimates and Forecasts, By Display Platform (2020-2032) (USD Billion)
10.5.1.7.3 Egypt Visual Computing Market Estimates and Forecasts, By Industry Verticals (2020-2032) (USD Billion)
10.5.1.8 Saudi Arabia
10.5.1.8.1 Saudi Arabia Visual Computing Market Estimates and Forecasts, By Component (2020-2032) (USD Billion)
10.5.1.8.2 Saudi Arabia Visual Computing Market Estimates and Forecasts, By Display Platform (2020-2032) (USD Billion)
10.5.1.8.3 Saudi Arabia Visual Computing Market Estimates and Forecasts, By Industry Verticals (2020-2032) (USD Billion)
10.5.1.9 Qatar
10.5.1.9.1 Qatar Visual Computing Market Estimates and Forecasts, By Component (2020-2032) (USD Billion)
10.5.1.9.2 Qatar Visual Computing Market Estimates and Forecasts, By Display Platform (2020-2032) (USD Billion)
10.5.1.9.3 Qatar Visual Computing Market Estimates and Forecasts, By Industry Verticals (2020-2032) (USD Billion)
10.5.1.10 Rest of Middle East
10.5.1.10.1 Rest of Middle East Visual Computing Market Estimates and Forecasts, By Component (2020-2032) (USD Billion)
10.5.1.10.2 Rest of Middle East Visual Computing Market Estimates and Forecasts, By Display Platform (2020-2032) (USD Billion)
10.5.1.10.3 Rest of Middle East Visual Computing Market Estimates and Forecasts, By Industry Verticals (2020-2032) (USD Billion)
10.5.2 Africa
10.5.2.1 Trends Analysis
10.5.2.2 Africa Visual Computing Market Estimates and Forecasts, by Country (2020-2032) (USD Billion)
10.5.2.3 Africa Visual Computing Market Estimates and Forecasts, By Component (2020-2032) (USD Billion)
10.5.2.4 Africa Visual Computing Market Estimates and Forecasts, By Display Platform (2020-2032) (USD Billion)
10.5.2.5 Africa Visual Computing Market Estimates and Forecasts, By Industry Verticals (2020-2032) (USD Billion)
10.5.2.6 South Africa
10.5.2.6.1 South Africa Visual Computing Market Estimates and Forecasts, By Component (2020-2032) (USD Billion)
10.5.2.6.2 South Africa Visual Computing Market Estimates and Forecasts, By Display Platform (2020-2032) (USD Billion)
10.5.2.6.3 South Africa Visual Computing Market Estimates and Forecasts, By Industry Verticals (2020-2032) (USD Billion)
10.5.2.7 Nigeria
10.5.2.7.1 Nigeria Visual Computing Market Estimates and Forecasts, By Component (2020-2032) (USD Billion)
10.5.2.7.2 Nigeria Visual Computing Market Estimates and Forecasts, By Display Platform (2020-2032) (USD Billion)
10.5.2.7.3 Nigeria Visual Computing Market Estimates and Forecasts, By Industry Verticals (2020-2032) (USD Billion)
10.5.2.8 Rest of Africa
10.5.2.8.1 Rest of Africa Visual Computing Market Estimates and Forecasts, By Component (2020-2032) (USD Billion)
10.5.2.8.2 Rest of Africa Visual Computing Market Estimates and Forecasts, By Display Platform (2020-2032) (USD Billion)
10.5.2.8.3 Rest of Africa Visual Computing Market Estimates and Forecasts, By Industry Verticals (2020-2032) (USD Billion)
10.6 Latin America
10.6.1 Trends Analysis
10.6.2 Latin America Visual Computing Market Estimates and Forecasts, by Country (2020-2032) (USD Billion)
10.6.3 Latin America Visual Computing Market Estimates and Forecasts, By Component (2020-2032) (USD Billion)
10.6.4 Latin America Visual Computing Market Estimates and Forecasts, By Display Platform (2020-2032) (USD Billion)
10.6.5 Latin America Visual Computing Market Estimates and Forecasts, By Industry Verticals (2020-2032) (USD Billion)
10.6.6 Brazil
10.6.6.1 Brazil Visual Computing Market Estimates and Forecasts, By Component (2020-2032) (USD Billion)
10.6.6.2 Brazil Visual Computing Market Estimates and Forecasts, By Display Platform (2020-2032) (USD Billion)
10.6.6.3 Brazil Visual Computing Market Estimates and Forecasts, By Industry Verticals (2020-2032) (USD Billion)
10.6.7 Argentina
10.6.7.1 Argentina Visual Computing Market Estimates and Forecasts, By Component (2020-2032) (USD Billion)
10.6.7.2 Argentina Visual Computing Market Estimates and Forecasts, By Display Platform (2020-2032) (USD Billion)
10.6.7.3 Argentina Visual Computing Market Estimates and Forecasts, By Industry Verticals (2020-2032) (USD Billion)
10.6.8 Colombia
10.6.8.1 Colombia Visual Computing Market Estimates and Forecasts, By Component (2020-2032) (USD Billion)
10.6.8.2 Colombia Visual Computing Market Estimates and Forecasts, By Display Platform (2020-2032) (USD Billion)
10.6.8.3 Colombia Visual Computing Market Estimates and Forecasts, By Industry Verticals (2020-2032) (USD Billion)
10.6.9 Rest of Latin America
10.6.9.1 Rest of Latin America Visual Computing Market Estimates and Forecasts, By Component (2020-2032) (USD Billion)
10.6.9.2 Rest of Latin America Visual Computing Market Estimates and Forecasts, By Display Platform (2020-2032) (USD Billion)
10.6.9.3 Rest of Latin America Visual Computing Market Estimates and Forecasts, By Industry Verticals (2020-2032) (USD Billion)
11. Company Profiles
11.1 SenseTime.
11.1.1 Company Overview
11.1.2 Financial
11.1.3 Products/ Services Offered
11.1.4 SWOT Analysis
11.2 Megvii
11.2.1 Company Overview
11.2.2 Financial
11.2.3 Products/ Services Offered
11.2.4 SWOT Analysis
11.3 viso.ai
11.3.1 Company Overview
11.3.2 Financial
11.3.3 Products/ Services Offered
11.3.4 SWOT Analysis
11.4 Nauto
11.4.1 Company Overview
11.4.2 Financial
11.4.3 Products/ Services Offered
11.4.4 SWOT Analysis
11.5 Verkada.
11.5.1 Company Overview
11.5.2 Financial
11.5.3 Products/ Services Offered
11.5.4 SWOT Analysis
11.6 Tractable
11.6.1 Company Overview
11.6.2 Financial
11.6.3 Products/ Services Offered
11.6.4 SWOT Analysis
11.7 Airobotics.
11.7.1 Company Overview
11.7.2 Financial
11.7.3 Products/ Services Offered
11.7.4 SWOT Analysis
11.8 Hawk-Eye Innovations.
11.8.1 Company Overview
11.8.2 Financial
11.8.3 Products/ Services Offered
11.8.4 SWOT Analysis
11.9 Trigo
11.9.1 Company Overview
11.9.2 Financial
11.9.3 Products/ Services Offered
11.9.4 SWOT Analysis
11.10 Movidius.
11.10.1 Company Overview
11.10.2 Financial
11.10.3 Products/ Services Offered
11.10.4 SWOT Analysis
12. Use Cases and Best Practices
13. Conclusion
An accurate research report requires proper strategizing as well as implementation. There are multiple factors involved in the completion of good and accurate research report and selecting the best methodology to compete the research is the toughest part. Since the research reports we provide play a crucial role in any company’s decision-making process, therefore we at SNS Insider always believe that we should choose the best method which gives us results closer to reality. This allows us to reach at a stage wherein we can provide our clients best and accurate investment to output ratio.
Each report that we prepare takes a timeframe of 350-400 business hours for production. Starting from the selection of titles through a couple of in-depth brain storming session to the final QC process before uploading our titles on our website we dedicate around 350 working hours. The titles are selected based on their current market cap and the foreseen CAGR and growth.
The 5 steps process:
Step 1: Secondary Research:
Secondary Research or Desk Research is as the name suggests is a research process wherein, we collect data through the readily available information. In this process we use various paid and unpaid databases which our team has access to and gather data through the same. This includes examining of listed companies’ annual reports, Journals, SEC filling etc. Apart from this our team has access to various associations across the globe across different industries. Lastly, we have exchange relationships with various university as well as individual libraries.
Step 2: Primary Research
When we talk about primary research, it is a type of study in which the researchers collect relevant data samples directly, rather than relying on previously collected data. This type of research is focused on gaining content specific facts that can be sued to solve specific problems. Since the collected data is fresh and first hand therefore it makes the study more accurate and genuine.
We at SNS Insider have divided Primary Research into 2 parts.
Part 1 wherein we interview the KOLs of major players as well as the upcoming ones across various geographic regions. This allows us to have their view over the market scenario and acts as an important tool to come closer to the accurate market numbers. As many as 45 paid and unpaid primary interviews are taken from both the demand and supply side of the industry to make sure we land at an accurate judgement and analysis of the market.
This step involves the triangulation of data wherein our team analyses the interview transcripts, online survey responses and observation of on filed participants. The below mentioned chart should give a better understanding of the part 1 of the primary interview.
Part 2: In this part of primary research the data collected via secondary research and the part 1 of the primary research is validated with the interviews from individual consultants and subject matter experts.
Consultants are those set of people who have at least 12 years of experience and expertise within the industry whereas Subject Matter Experts are those with at least 15 years of experience behind their back within the same space. The data with the help of two main processes i.e., FGDs (Focused Group Discussions) and IDs (Individual Discussions). This gives us a 3rd party nonbiased primary view of the market scenario making it a more dependable one while collation of the data pointers.
Step 3: Data Bank Validation
Once all the information is collected via primary and secondary sources, we run that information for data validation. At our intelligence centre our research heads track a lot of information related to the market which includes the quarterly reports, the daily stock prices, and other relevant information. Our data bank server gets updated every fortnight and that is how the information which we collected using our primary and secondary information is revalidated in real time.
Step 4: QA/QC Process
After all the data collection and validation our team does a final level of quality check and quality assurance to get rid of any unwanted or undesired mistakes. This might include but not limited to getting rid of the any typos, duplication of numbers or missing of any important information. The people involved in this process include technical content writers, research heads and graphics people. Once this process is completed the title gets uploader on our platform for our clients to read it.
Step 5: Final QC/QA Process:
This is the last process and comes when the client has ordered the study. In this process a final QA/QC is done before the study is emailed to the client. Since we believe in giving our clients a good experience of our research studies, therefore, to make sure that we do not lack at our end in any way humanly possible we do a final round of quality check and then dispatch the study to the client.
Key Segments:
By Component
Hardware
Software
By Display Platform
Interactive Whiteboards
Interactive Kiosk
Interactive Table
Interactive Video Wall
Monitors
Others
By Industry Verticals
Gaming
Media & Entertainment
Healthcare
Automotive
Manufacturing
Military & Defense
Others
Request for Segment Customization as per your Business Requirement: Segment Customization Request
Regional Coverage:
North America
US
Canada
Mexico
Europe
Eastern Europe
Poland
Romania
Hungary
Turkey
Rest of Eastern Europe
Western Europe
Germany
France
UK
Italy
Spain
Netherlands
Switzerland
Austria
Rest of Western Europe
Asia Pacific
China
India
Japan
South Korea
Vietnam
Singapore
Australia
Rest of Asia Pacific
Middle East & Africa
Middle East
UAE
Egypt
Saudi Arabia
Qatar
Rest of Middle East
Africa
Nigeria
South Africa
Rest of Africa
Latin America
Brazil
Argentina
Colombia
Rest of Latin America
Request for Country Level Research Report: Country Level Customization Request
Available Customization
With the given market data, SNS Insider offers customization as per the company’s specific needs. The following customization options are available for the report:
Detailed Volume Analysis
Criss-Cross segment analysis (e.g. Product X Application)
Competitive Product Benchmarking
Geographic Analysis
Additional countries in any of the regions
Customized Data Representation
Detailed analysis and profiling of additional market players
The Calibration Services Market size was valued at USD 6.22 billion in 2023 and is expected to grow to USD 9.92 billion by 2032 and grow at a CAGR of 5.33% over the forecast period of 2024-2032.
The Energy Management Systems Market size was valued at USD 39.47 Billion in 2023. It is estimated to reach USD 129.22 Billion by 2032, growing at a CAGR of 14.11% during 2024-2032.
The Thyristor Protectors Market size was Valued at USD 0.7 billion in 2023 and is estimated to Reach USD 1.006 billion by 2032 and grow at a CAGR of 4.11% over the forecast period of 2024-2032.
The Analog Integrated Circuit Market Size was valued at USD 79.33 billion in 2023 and is expected to reach USD 147.74 Billion by 2032 and grow at a CAGR of 7.16% over the forecast period 2024-2032.
Heat-Assisted Magnetic Recording (HAMR) Device Market Size is expected to reach USD 461.17 Million by 2032, at 37.55% CAGR During 2024-2032.
The Testing, Inspection, and Certification (TIC) Market size is expected to reach $427.69 billion, growing at a CAGR of 3.94% by forecasts 2024-2032
Hi! Click one of our member below to chat on Phone