image

Vision Processing Unit Market Report Scope & Overview:

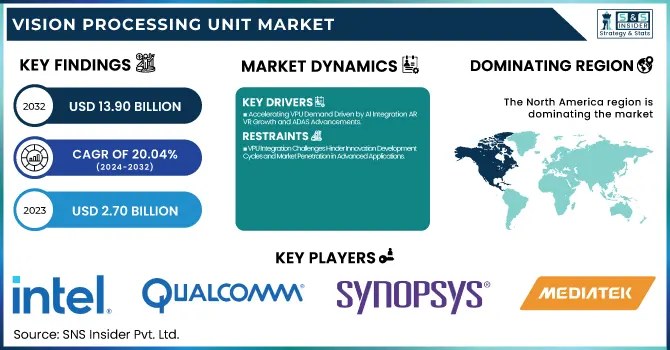
The Vision Processing Unit Market was valued at USD 2.70 billion in 2023 and is expected to reach USD 13.90 billion by 2032, growing at a CAGR of 20.04% over the forecast period 2024-2032. The Vision Processing Unit (VPU) market is anticipated to experience strong growth due to its specific-to-application nature, finding applications in various end-user industries such as automotive, surveillance, robotics, and consumer electronics. Built for technical excellence, the VPU handles AI-driven image processing tasks at high speed while minimizing power consumption. Rich toolsets like developer tools, and frameworks, that come with a strong software ecosystem, enable easier VPU integration and use. The deep learning algorithm, edge computing, and hardware architecture innovations continuously push the VPU capabilities further. VPU improvements here make possible enhanced object identification, facial recognition, and immediate data processing, which in turn help differentiate VPUs as standard or key elements in smart or artificial vision key apps.

The U.S. vision processing unit (VPU) market was valued at USD 0.70 billion in 2023 and is expected to grow at a CAGR of 19.84% from 2024 to 2032. The expansion is fueled by the escalating need for AI-based applications, improved computer vision technologies, and industry penetration in automotive, healthcare, and consumer electronics to gain advanced visual processing.

Market Dynamics

Key Drivers: 

  • Accelerating VPU Demand Driven by AI Integration AR VR Growth and ADAS Advancements

The rising integration of artificial intelligence (AI) and machine learning (ML) in devices such as smartphones, cameras, and drones has driven lucrative growth for VPU adoption. These image-processing units are meant to provide high performance while consuming a low amount of power and are critical for modern electronic devices. The recent rapid growth of AR and VR applications, particularly in gaming, healthcare, and industrial sectors, has further propelled the demand for VPUs. Moreover, the increasing adoption of AR devices in vehicles for higher safety with the introduction of sophisticated driver-assistance systems (ADAS) is another factor boosting the market. They utilize VPUs for instant image processing, object recognition, and resolving navigation precision.

Restrain: 

  • VPU Integration Challenges Hinder Innovation Development Cycles and Market Penetration in Advanced Applications

High complexity in integrating VPU across various devices is one of the key restraining factors. While momentum is slowly building towards better VPU design, developing VPUs that should be able to effectively implement very different hardware architectures may require significant technical expertise to get right, causing innovations to creep along. Also, existing software frameworks might be a breaking point for a developer, particularly in applications that are reliant on fast image recognition and surrounding data processing. Such complexity often results in lengthy development cycles which postpone product launches and slow market penetration.

Opportunity:

  • VPU Market Opportunities Expand with Intelligent Surveillance Smart Devices Robotics and 5G Integration

New opportunities in the VPU market are associated with the growing need for intelligent surveillance, smart home gadgets, and robotics. The rise of devices that need efficient visual data processing opens up great opportunities for VPU manufacturers. Further, by extending data transfer speed at any time, even 5G technology will make it possible to apply more VPU-powered image processing, resulting in fast real-time-based applications more efficiently. Industry x is driving a transformation into automation and intelligence, creating a significant market for VPUs.

Challenges:

  • Enhancing VPU Efficiency Security and Design to Overcome Power Heat and Data Breach Challenges

The major issue is the need for power efficiency in a high-performance associate memory. The challenge is to continue processing the data using VPUs while creating less and less heat, a particularly important feature to maintain in power-dependent devices like smartphones, drones, and AR/ VR systems. Additionally, security issues related to devices driven by VPU are becoming more and more pressing. Because these processors have to deal with a large amount of visual data, they will become the target of data breaches and hacking efforts. To mitigate these risks, strong data encryption as well as secure processing environments will need to be employed. To sustain market growth, it is important to address these challenges with more advanced VPU design, better software support, and more robust security frameworks.

Segments Analysis

By Fabrication Process

The 16-28 nm of node technology led the vision processing unit market in terms of market share in 2023, capturing nearly 58.1% of the overall market share. This is because of its well-balanced performance, power efficiency, and cost-efficiency which is widely adopted in devices like smartphones, cameras, and automotive-based systems. It can process data optimally, while minimizing power losses and heat production, on the 16-28 nm nodes crucial features for many mobile and embedded devices.

The ≤16 nm node segment is expected to expand at the fastest compound annual growth rate (CAGR) during the forecast period, from 2024 to 2032. That growth is attributed to the rising demand for high-end VPUs, driven by lots of powerful compute-heavy applications like AR/VR, AI devices,  and self-driving cars. The ≤16 nm nodes provide for better. Power and area performance (PPA) are available for next-generation VPU architectures. Such a transition is anticipated to transform the industries dependent on visual data processing.

By Application

Smartphones accounted nearly for 39.3% of the total Vision Processing Unit (VPU) market share in 2023. The rise in dominance can be attributed to the latest smartphones including powerful camera modules, intelligent features powered by artificial intelligence,  and enhanced image processing capabilities. However, VPUs are essential for high-end and even mid-ranges as augmented reality (AR) applications, battery optimization on cameras, and facial recognition are important for improving the camera performance of devices.

The AR/VR segment is estimated to grow at a robust compound annual growth rate (CAGR) from 2024-2032. Factors such as increasing demand for an immersive experience in gaming, healthcare, and training applications are propelling the growth of the market. VPUs are accelerating the adoption of AR/VR headsets with real-time motion tracking, object detection, and improved visual rendering. The expanding AR/VR market is expected to create significant VPU demand in the upcoming years, driven by the need for low-power visual process solutions in these applications.

By Vertical

The consumer electronics segment held the largest share of the Vision Processing Unit (VPU) market in 2023, globally, accounting for 28.5% of the total market share. The widespread use of VPUs inside smartphones, tablets, smart TVs, and wearables has driven this strong presence. Optional visual processing units (VPUs) add visual processing capabilities for advanced features such as enhanced image recognition, improved video enhancement, and battery efficiency. VPUs are becoming a critical electronics component because of increasing consumer demand for high-performance devices with ambient visual experiences.

The security & surveillance segment is anticipated to achieve the highest compound annual growth rate (CAGR) from 2024 to 2032. The need for high-end/civil quality is increasing, for the new video analytics system, ideally in real-time with facial and motion detection cameras, resulting in such growth. Thus, VPUs are crucial to enabling these smart features by providing rapid and power-efficient image processing. Increasing awareness of public safety and increasing adoption of smart security solutions are factors anticipated to bolster VPU demand in this sector Further.

Regional Analysis

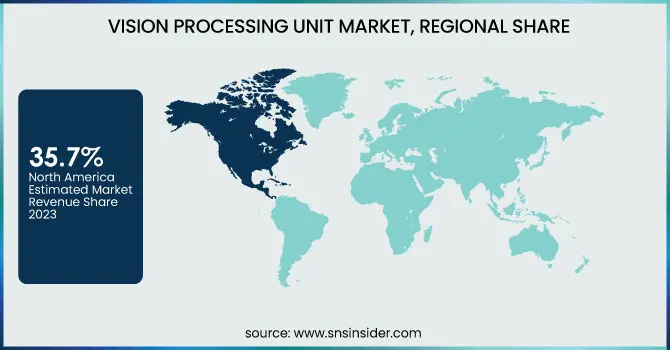
North America held the largest share of the video processing unit (VPU) market in 2023, contributing around 35.7% to the total market share. Factors bolstering this dominance are to vast presence of top-notch technology companies, high research & development expenditure, and rapid acceptance level for advanced technologies. Notably, the US hosts major entities like Intel, Qualcomm, and Ambarella that develop VPUs, and integrate these chips into smartphone chips, and applications in face-detection security systems, AR/VR systems, and more. For example, affordable visual processing is commonly found in smart cameras and drones found with Intel's Movidius VPUs. At the same time, the increase of ADAS systems in the automotive field of North America keeps increasing the demand for VPU, with companies such as Tesla Inc. and General Motors Company deploying cutting-edge Vision Processing technology in their autonomous vehicle platforms.

The fastest compound annual growth rate is estimated to be in the Asia Pacific from 2024 to 2032. Factors such as increasing demand for consumer electronics, investments in the construction of smart cities, and growth in automotive production are driving this increase. From this, growth can be seen in China, Japan, and South Korea leading the way globally with their technology. Huawei, for example, includes VPUs as part of the camera used on its flagship smartphones to boost AI-based photo ops, and the same goes for Samsung. The regional growth is also being ushered in by strengthening the surveillance market of China where Hikvision is using VPU-based smart cameras. Such speedy tech adoption makes Asia Pacific one of the high-growth areas for the VPU market.

Key players

Some of the major players in the Vision Processing Unit Market are:

  • Intel Corporation (Movidius Myriad X),

  • Qualcomm Technologies Inc. (Snapdragon XR2),

  • NXP Semiconductors (i.MX 8M Plus),

  • Synopsys Inc. (DesignWare EV6x),

  • MediaTek Inc. (Dimensity 9200),

  • Ambarella Inc. (CV2),

  • Ceva Inc. (NeuPro-S),

  • Cadence Design Systems Inc. (Tensilica Vision P6),

  • Himax Technologies Inc. (WISEEye),

  • Rockchip Electronics Co., Ltd. (RK3588),

  • Samsung Electronics Co., Ltd. (Exynos 2200),

  • Texas Instruments Inc. (TDA4VM),

  • Google LLC (Coral Edge TPU),

  • Lattice Semiconductor Corporation (CrossLink-NX),

  • Mythic Inc. (Mythic Analog Matrix Processor - M1076).

Recent Trends

  • In March 2025, Qualcomm announced the acquisition of Edge Impulse to enhance its AI and IoT capabilities, aiming to accelerate edge device innovation and real-time data processing solutions.

Vision Processing Unit Report Scope:

Report Attributes Details
Market Size in 2023 USD 2.70 Billion
Market Size by 2032 USD 13.90 Billion
CAGR CAGR of 20.04% From 2024 to 2032
Base Year 2023
Forecast Period 2024-2032
Historical Data 2020-2022
Report Scope & Coverage Market Size, Segments Analysis, Competitive  Landscape, Regional Analysis, DROC & SWOT Analysis, Forecast Outlook
Key Segments • By Fabrication Process (≤16 nm, >16-28 nm)
• By Application (Smartphones, Drones, Cameras, AR/VR, ADAS, Others)
• By Vertical (Consumer electronics, Security and surveillance, Automotive, Healthcare, Others)
Regional Analysis/Coverage North America (US, Canada, Mexico), Europe (Eastern Europe [Poland, Romania, Hungary, Turkey, Rest of Eastern Europe] Western Europe] Germany, France, UK, Italy, Spain, Netherlands, Switzerland, Austria, Rest of Western Europe]), Asia Pacific (China, India, Japan, South Korea, Vietnam, Singapore, Australia, Rest of Asia Pacific), Middle East & Africa (Middle East [UAE, Egypt, Saudi Arabia, Qatar, Rest of Middle East], Africa [Nigeria, South Africa, Rest of Africa], Latin America (Brazil, Argentina, Colombia, Rest of Latin America)
Company Profiles Intel Corporation, Qualcomm Technologies Inc., NXP Semiconductors, Synopsys Inc., MediaTek Inc., Ambarella Inc., Ceva Inc., Cadence Design Systems Inc., Himax Technologies Inc., Rockchip Electronics Co., Ltd., Samsung Electronics Co., Ltd., Texas Instruments Inc., Google LLC, Lattice Semiconductor Corporation, Mythic Inc.

Frequently Asked Questions

Ans: The Vision Processing Unit Market is expected to grow at a CAGR of 20.04% during 2024-2032.

Ans: Vision Processing Unit Market size was USD 2.70 billion in 2023 and is expected to Reach USD 13.90 billion by 2032.

Ans: The major growth factor of the Vision Processing Unit (VPU) Market is the rising demand for AI-driven visual processing solutions in applications like smartphones, AR/VR, ADAS, and smart surveillance systems.

Ans: The >16-28 nm segment dominated the Vision Processing Unit Market in 2023.

Ans: North America dominated the Vision Processing Unit Market in 2023.

Table of Content

1. Introduction

1.1 Market Definition

1.2 Scope (Inclusion and Exclusions)

1.3 Research Assumptions

2. Executive Summary

2.1 Market Overview

2.2 Regional Synopsis

2.3 Competitive Summary

3. Research Methodology

3.1 Top-Down Approach

3.2 Bottom-up Approach

3.3. Data Validation

3.4 Primary Interviews

4. Market Dynamics Impact Analysis

4.1 Market Driving Factors Analysis

4.1.1 Drivers

4.1.2 Restraints

4.1.3 Opportunities

4.1.4 Challenges

4.2 PESTLE Analysis

4.3 Porter’s Five Forces Model

5. Statistical Insights and Trends Reporting

5.1 Application-Specific

5.2 Technical Performance

      5.3 Software & Ecosystem

      5.4 Innovation & Technological Advancement

6. Competitive Landscape

6.1 List of Major Companies, By Region

6.2 Market Share Analysis, By Region

6.3 Product Benchmarking

6.3.1 Product specifications and features

6.3.2 Pricing

6.4 Strategic Initiatives

6.4.1 Marketing and Promotional Activities

6.4.2 Distribution and Supply Chain Strategies

6.4.3 Expansion plans and new product launches

6.4.4 Strategic partnerships and collaborations

6.5 Technological Advancements

6.6 Market Positioning and Branding

7. Vision Processing Unit Market Segmentation, By Fabrication Process

7.1 Chapter Overview

7.2 ≤16 nm

7.2.1 ≤16 nm Market Trends Analysis (2020-2032)

7.2.2 ≤16 nm Market Size Estimates and Forecasts to 2032 (USD Billion)

7.3 >16-28 nm

7.3.1 >16-28 nm Market Trends Analysis (2020-2032)

7.3.2 >16-28 nm Market Size Estimates and Forecasts to 2032 (USD Billion)

8. Vision Processing Unit Market Segmentation, By Application

8.1 Chapter Overview

8.2 Smartphones

8.2.1 Smartphones Market Trends Analysis (2020-2032)

8.2.2 Smartphones Market Size Estimates and Forecasts to 2032 (USD Billion)

8.3 Drones

8.3.1 Drones Market Trends Analysis (2020-2032)

8.3.2 Drones Market Size Estimates and Forecasts to 2032 (USD Billion)

8.4 Cameras

8.4.1 Cameras Market Trends Analysis (2020-2032)

8.4.2 Cameras Market Size Estimates and Forecasts to 2032 (USD Billion)

8.5 AR/VR

8.5.1 AR/VR Market Trends Analysis (2020-2032)

8.5.2 AR/VR Market Size Estimates and Forecasts to 2032 (USD Billion)

8.6 ADAS

8.6.1 ADAS Market Trends Analysis (2020-2032)

8.6.2 ADAS Market Size Estimates and Forecasts to 2032 (USD Billion)

8.7 Others

8.7.1 Others Market Trends Analysis (2020-2032)

8.7.2 Others Market Size Estimates and Forecasts to 2032 (USD Billion)

9. Vision Processing Unit Market Segmentation, By Vertical

9.1 Chapter Overview

9.2 Consumer electronics

9.2.1 Consumer Electronics Market Trends Analysis (2020-2032)

9.2.2 Consumer Electronics Market Size Estimates and Forecasts to 2032 (USD Billion)

9.3 Security and surveillance

9.3.1 Security and Surveillance Market Trends Analysis (2020-2032)

9.3.2 Security and Surveillance Market Size Estimates and Forecasts to 2032 (USD Billion)

9.4 Automotive

9.4.1 Automotive Market Trends Analysis (2020-2032)

9.4.2 Automotive Market Size Estimates and Forecasts to 2032 (USD Billion)

9.5 Healthcare

9.5.1 Healthcare Market Trends Analysis (2020-2032)

9.5.2 Healthcare Market Size Estimates and Forecasts to 2032 (USD Billion)

9.6 Others

9.6.1 Others Market Trends Analysis (2020-2032)

9.6.2 Others Market Size Estimates and Forecasts to 2032 (USD Billion)

10. Regional Analysis

10.1 Chapter Overview

10.2 North America

10.2.1 Trends Analysis

10.2.2 North America Vision Processing Unit Market Estimates and Forecasts, by Country (2020-2032) (USD Billion)

10.2.3 North America Vision Processing Unit Market Estimates and Forecasts, By Fabrication Process (2020-2032) (USD Billion) 

10.2.4 North America Vision Processing Unit Market Estimates and Forecasts, By Application (2020-2032) (USD Billion)

10.2.5 North America Vision Processing Unit Market Estimates and Forecasts, By Vertical (2020-2032) (USD Billion)

10.2.6 USA

10.2.6.1 USA Vision Processing Unit Market Estimates and Forecasts, By Fabrication Process (2020-2032) (USD Billion)

10.2.6.2 USA Vision Processing Unit Market Estimates and Forecasts, By Application (2020-2032) (USD Billion)

10.2.6.3 USA Vision Processing Unit Market Estimates and Forecasts, By Vertical (2020-2032) (USD Billion)

10.2.7 Canada

10.2.7.1 Canada Vision Processing Unit Market Estimates and Forecasts, By Fabrication Process (2020-2032) (USD Billion)

10.2.7.2 Canada Vision Processing Unit Market Estimates and Forecasts, By Application (2020-2032) (USD Billion)

10.2.7.3 Canada Vision Processing Unit Market Estimates and Forecasts, By Vertical (2020-2032) (USD Billion)

10.2.8 Mexico

10.2.8.1 Mexico Vision Processing Unit Market Estimates and Forecasts, By Fabrication Process (2020-2032) (USD Billion)

10.2.8.2 Mexico Vision Processing Unit Market Estimates and Forecasts, By Application (2020-2032) (USD Billion)

10.2.8.3 Mexico Vision Processing Unit Market Estimates and Forecasts, By Vertical (2020-2032) (USD Billion)

10.3 Europe

10.3.1 Eastern Europe

10.3.1.1 Trends Analysis

10.3.1.2 Eastern Europe Vision Processing Unit Market Estimates and Forecasts, by Country (2020-2032) (USD Billion)

10.3.1.3 Eastern Europe Vision Processing Unit Market Estimates and Forecasts, By Fabrication Process (2020-2032) (USD Billion) 

10.3.1.4 Eastern Europe Vision Processing Unit Market Estimates and Forecasts, By Application (2020-2032) (USD Billion)

10.3.1.5 Eastern Europe Vision Processing Unit Market Estimates and Forecasts, By Vertical (2020-2032) (USD Billion)

10.3.1.6 Poland

10.3.1.6.1 Poland Vision Processing Unit Market Estimates and Forecasts, By Fabrication Process (2020-2032) (USD Billion)

10.3.1.6.2 Poland Vision Processing Unit Market Estimates and Forecasts, By Application (2020-2032) (USD Billion)

10.3.1.6.3 Poland Vision Processing Unit Market Estimates and Forecasts, By Vertical (2020-2032) (USD Billion)

10.3.1.7 Romania

10.3.1.7.1 Romania Vision Processing Unit Market Estimates and Forecasts, By Fabrication Process (2020-2032) (USD Billion)

10.3.1.7.2 Romania Vision Processing Unit Market Estimates and Forecasts, By Application (2020-2032) (USD Billion)

10.3.1.7.3 Romania Vision Processing Unit Market Estimates and Forecasts, By Vertical (2020-2032) (USD Billion)

10.3.1.8 Hungary

10.3.1.8.1 Hungary Vision Processing Unit Market Estimates and Forecasts, By Fabrication Process (2020-2032) (USD Billion)

10.3.1.8.2 Hungary Vision Processing Unit Market Estimates and Forecasts, By Application (2020-2032) (USD Billion)

10.3.1.8.3 Hungary Vision Processing Unit Market Estimates and Forecasts, By Vertical (2020-2032) (USD Billion)

10.3.1.9 Turkey

10.3.1.9.1 Turkey Vision Processing Unit Market Estimates and Forecasts, By Fabrication Process (2020-2032) (USD Billion)

10.3.1.9.2 Turkey Vision Processing Unit Market Estimates and Forecasts, By Application (2020-2032) (USD Billion)

10.3.1.9.3 Turkey Vision Processing Unit Market Estimates and Forecasts, By Vertical (2020-2032) (USD Billion)

10.3.1.10 Rest of Eastern Europe

10.3.1.10.1 Rest of Eastern Europe Vision Processing Unit Market Estimates and Forecasts, By Fabrication Process (2020-2032) (USD Billion)

10.3.1.10.2 Rest of Eastern Europe Vision Processing Unit Market Estimates and Forecasts, By Application (2020-2032) (USD Billion)

10.3.1.10.3 Rest of Eastern Europe Vision Processing Unit Market Estimates and Forecasts, By Vertical (2020-2032) (USD Billion)

10.3.2 Western Europe

10.3.2.1 Trends Analysis

10.3.2.2 Western Europe Vision Processing Unit Market Estimates and Forecasts, by Country (2020-2032) (USD Billion)

10.3.2.3 Western Europe Vision Processing Unit Market Estimates and Forecasts, By Fabrication Process (2020-2032) (USD Billion) 

10.3.2.4 Western Europe Vision Processing Unit Market Estimates and Forecasts, By Application (2020-2032) (USD Billion)

10.3.2.5 Western Europe Vision Processing Unit Market Estimates and Forecasts, By Vertical (2020-2032) (USD Billion)

10.3.2.6 Germany

10.3.2.6.1 Germany Vision Processing Unit Market Estimates and Forecasts, By Fabrication Process (2020-2032) (USD Billion)

10.3.2.6.2 Germany Vision Processing Unit Market Estimates and Forecasts, By Application (2020-2032) (USD Billion)

10.3.2.6.3 Germany Vision Processing Unit Market Estimates and Forecasts, By Vertical (2020-2032) (USD Billion)

10.3.2.7 France

10.3.2.7.1 France Vision Processing Unit Market Estimates and Forecasts, By Fabrication Process (2020-2032) (USD Billion)

10.3.2.7.2 France Vision Processing Unit Market Estimates and Forecasts, By Application (2020-2032) (USD Billion)

10.3.2.7.3 France Vision Processing Unit Market Estimates and Forecasts, By Vertical (2020-2032) (USD Billion)

10.3.2.8 UK

10.3.2.8.1 UK Vision Processing Unit Market Estimates and Forecasts, By Fabrication Process (2020-2032) (USD Billion)

10.3.2.8.2 UK Vision Processing Unit Market Estimates and Forecasts, By Application (2020-2032) (USD Billion)

10.3.2.8.3 UK Vision Processing Unit Market Estimates and Forecasts, By Vertical (2020-2032) (USD Billion)

10.3.2.9 Italy

10.3.2.9.1 Italy Vision Processing Unit Market Estimates and Forecasts, By Fabrication Process (2020-2032) (USD Billion)

10.3.2.9.2 Italy Vision Processing Unit Market Estimates and Forecasts, By Application (2020-2032) (USD Billion)

10.3.2.9.3 Italy Vision Processing Unit Market Estimates and Forecasts, By Vertical (2020-2032) (USD Billion)

10.3.2.10 Spain

10.3.2.10.1 Spain Vision Processing Unit Market Estimates and Forecasts, By Fabrication Process (2020-2032) (USD Billion)

10.3.2.10.2 Spain Vision Processing Unit Market Estimates and Forecasts, By Application (2020-2032) (USD Billion)

10.3.2.10.3 Spain Vision Processing Unit Market Estimates and Forecasts, By Vertical (2020-2032) (USD Billion)

10.3.2.11 Netherlands

10.3.2.11.1 Netherlands Vision Processing Unit Market Estimates and Forecasts, By Fabrication Process (2020-2032) (USD Billion)

10.3.2.11.2 Netherlands Vision Processing Unit Market Estimates and Forecasts, By Application (2020-2032) (USD Billion)

10.3.2.11.3 Netherlands Vision Processing Unit Market Estimates and Forecasts, By Vertical (2020-2032) (USD Billion)

10.3.2.12 Switzerland

10.3.2.12.1 Switzerland Vision Processing Unit Market Estimates and Forecasts, By Fabrication Process (2020-2032) (USD Billion)

10.3.2.12.2 Switzerland Vision Processing Unit Market Estimates and Forecasts, By Application (2020-2032) (USD Billion)

10.3.2.12.3 Switzerland Vision Processing Unit Market Estimates and Forecasts, By Vertical (2020-2032) (USD Billion)

10.3.2.13 Austria

10.3.2.13.1 Austria Vision Processing Unit Market Estimates and Forecasts, By Fabrication Process (2020-2032) (USD Billion)

10.3.2.13.2 Austria Vision Processing Unit Market Estimates and Forecasts, By Application (2020-2032) (USD Billion)

10.3.2.13.3 Austria Vision Processing Unit Market Estimates and Forecasts, By Vertical (2020-2032) (USD Billion)

10.3.2.14 Rest of Western Europe

10.3.2.14.1 Rest of Western Europe Vision Processing Unit Market Estimates and Forecasts, By Fabrication Process (2020-2032) (USD Billion)

10.3.2.14.2 Rest of Western Europe Vision Processing Unit Market Estimates and Forecasts, By Application (2020-2032) (USD Billion)

10.3.2.14.3 Rest of Western Europe Vision Processing Unit Market Estimates and Forecasts, By Vertical (2020-2032) (USD Billion)

10.4 Asia Pacific

10.4.1 Trends Analysis

10.4.2 Asia Pacific Vision Processing Unit Market Estimates and Forecasts, by Country (2020-2032) (USD Billion)

10.4.3 Asia Pacific Vision Processing Unit Market Estimates and Forecasts, By Fabrication Process (2020-2032) (USD Billion) 

10.4.4 Asia Pacific Vision Processing Unit Market Estimates and Forecasts, By Application (2020-2032) (USD Billion)

10.4.5 Asia Pacific Vision Processing Unit Market Estimates and Forecasts, By Vertical (2020-2032) (USD Billion)

10.4.6 China

10.4.6.1 China Vision Processing Unit Market Estimates and Forecasts, By Fabrication Process (2020-2032) (USD Billion)

10.4.6.2 China Vision Processing Unit Market Estimates and Forecasts, By Application (2020-2032) (USD Billion)

10.4.6.3 China Vision Processing Unit Market Estimates and Forecasts, By Vertical (2020-2032) (USD Billion)

10.4.7 India

10.4.7.1 India Vision Processing Unit Market Estimates and Forecasts, By Fabrication Process (2020-2032) (USD Billion)

10.4.7.2 India Vision Processing Unit Market Estimates and Forecasts, By Application (2020-2032) (USD Billion)

10.4.7.3 India Vision Processing Unit Market Estimates and Forecasts, By Vertical (2020-2032) (USD Billion)

10.4.8 Japan

10.4.8.1 Japan Vision Processing Unit Market Estimates and Forecasts, By Fabrication Process (2020-2032) (USD Billion)

10.4.8.2 Japan Vision Processing Unit Market Estimates and Forecasts, By Application (2020-2032) (USD Billion)

10.4.8.3 Japan Vision Processing Unit Market Estimates and Forecasts, By Vertical (2020-2032) (USD Billion)

10.4.9 South Korea

10.4.9.1 South Korea Vision Processing Unit Market Estimates and Forecasts, By Fabrication Process (2020-2032) (USD Billion)

10.4.9.2 South Korea Vision Processing Unit Market Estimates and Forecasts, By Application (2020-2032) (USD Billion)

10.4.9.3 South Korea Vision Processing Unit Market Estimates and Forecasts, By Vertical (2020-2032) (USD Billion)

10.4.10 Vietnam

10.4.10.1 Vietnam Vision Processing Unit Market Estimates and Forecasts, By Fabrication Process (2020-2032) (USD Billion)

10.4.10.2 Vietnam Vision Processing Unit Market Estimates and Forecasts, By Application (2020-2032) (USD Billion)

10.4.10.3 Vietnam Vision Processing Unit Market Estimates and Forecasts, By Vertical (2020-2032) (USD Billion)

10.4.11 Singapore

10.4.11.1 Singapore Vision Processing Unit Market Estimates and Forecasts, By Fabrication Process (2020-2032) (USD Billion)

10.4.11.2 Singapore Vision Processing Unit Market Estimates and Forecasts, By Application (2020-2032) (USD Billion)

10.4.11.3 Singapore Vision Processing Unit Market Estimates and Forecasts, By Vertical (2020-2032) (USD Billion)

10.4.12 Australia

10.4.12.1 Australia Vision Processing Unit Market Estimates and Forecasts, By Fabrication Process (2020-2032) (USD Billion)

10.4.12.2 Australia Vision Processing Unit Market Estimates and Forecasts, By Application (2020-2032) (USD Billion)

10.4.12.3 Australia Vision Processing Unit Market Estimates and Forecasts, By Vertical (2020-2032) (USD Billion)

10.4.13 Rest of Asia Pacific

10.4.13.1 Rest of Asia Pacific Vision Processing Unit Market Estimates and Forecasts, By Fabrication Process (2020-2032) (USD Billion)

10.4.13.2 Rest of Asia Pacific Vision Processing Unit Market Estimates and Forecasts, By Application (2020-2032) (USD Billion)

10.4.13.3 Rest of Asia Pacific Vision Processing Unit Market Estimates and Forecasts, By Vertical (2020-2032) (USD Billion)

10.5 Middle East and Africa

10.5.1 Middle East

10.5.1.1 Trends Analysis

10.5.1.2 Middle East Vision Processing Unit Market Estimates and Forecasts, by Country (2020-2032) (USD Billion)

10.5.1.3 Middle East Vision Processing Unit Market Estimates and Forecasts, By Fabrication Process (2020-2032) (USD Billion) 

10.5.1.4 Middle East Vision Processing Unit Market Estimates and Forecasts, By Application (2020-2032) (USD Billion)

10.5.1.5 Middle East Vision Processing Unit Market Estimates and Forecasts, By Vertical (2020-2032) (USD Billion)

10.5.1.6 UAE

10.5.1.6.1 UAE Vision Processing Unit Market Estimates and Forecasts, By Fabrication Process (2020-2032) (USD Billion)

10.5.1.6.2 UAE Vision Processing Unit Market Estimates and Forecasts, By Application (2020-2032) (USD Billion)

10.5.1.6.3 UAE Vision Processing Unit Market Estimates and Forecasts, By Vertical (2020-2032) (USD Billion)

10.5.1.7 Egypt

10.5.1.7.1 Egypt Vision Processing Unit Market Estimates and Forecasts, By Fabrication Process (2020-2032) (USD Billion)

10.5.1.7.2 Egypt Vision Processing Unit Market Estimates and Forecasts, By Application (2020-2032) (USD Billion)

10.5.1.7.3 Egypt Vision Processing Unit Market Estimates and Forecasts, By Vertical (2020-2032) (USD Billion)

10.5.1.8 Saudi Arabia

10.5.1.8.1 Saudi Arabia Vision Processing Unit Market Estimates and Forecasts, By Fabrication Process (2020-2032) (USD Billion)

10.5.1.8.2 Saudi Arabia Vision Processing Unit Market Estimates and Forecasts, By Application (2020-2032) (USD Billion)

10.5.1.8.3 Saudi Arabia Vision Processing Unit Market Estimates and Forecasts, By Vertical (2020-2032) (USD Billion)

10.5.1.9 Qatar

10.5.1.9.1 Qatar Vision Processing Unit Market Estimates and Forecasts, By Fabrication Process (2020-2032) (USD Billion)

10.5.1.9.2 Qatar Vision Processing Unit Market Estimates and Forecasts, By Application (2020-2032) (USD Billion)

10.5.1.9.3 Qatar Vision Processing Unit Market Estimates and Forecasts, By Vertical (2020-2032) (USD Billion)

10.5.1.10 Rest of Middle East

10.5.1.10.1 Rest of Middle East Vision Processing Unit Market Estimates and Forecasts, By Fabrication Process (2020-2032) (USD Billion)

10.5.1.10.2 Rest of Middle East Vision Processing Unit Market Estimates and Forecasts, By Application (2020-2032) (USD Billion)

10.5.1.10.3 Rest of Middle East Vision Processing Unit Market Estimates and Forecasts, By Vertical (2020-2032) (USD Billion)

10.5.2 Africa

10.5.2.1 Trends Analysis

10.5.2.2 Africa Vision Processing Unit Market Estimates and Forecasts, by Country (2020-2032) (USD Billion)

10.5.2.3 Africa Vision Processing Unit Market Estimates and Forecasts, By Fabrication Process (2020-2032) (USD Billion) 

10.5.2.4 Africa Vision Processing Unit Market Estimates and Forecasts, By Application (2020-2032) (USD Billion)

10.5.2.5 Africa Vision Processing Unit Market Estimates and Forecasts, By Vertical (2020-2032) (USD Billion)

10.5.2.6 South Africa

10.5.2.6.1 South Africa Vision Processing Unit Market Estimates and Forecasts, By Fabrication Process (2020-2032) (USD Billion)

10.5.2.6.2 South Africa Vision Processing Unit Market Estimates and Forecasts, By Application (2020-2032) (USD Billion)

10.5.2.6.3 South Africa Vision Processing Unit Market Estimates and Forecasts, By Vertical (2020-2032) (USD Billion)

10.5.2.7 Nigeria

10.5.2.7.1 Nigeria Vision Processing Unit Market Estimates and Forecasts, By Fabrication Process (2020-2032) (USD Billion)

10.5.2.7.2 Nigeria Vision Processing Unit Market Estimates and Forecasts, By Application (2020-2032) (USD Billion)

10.5.2.7.3 Nigeria Vision Processing Unit Market Estimates and Forecasts, By Vertical (2020-2032) (USD Billion)

10.5.2.8 Rest of Africa

10.5.2.8.1 Rest of Africa Vision Processing Unit Market Estimates and Forecasts, By Fabrication Process (2020-2032) (USD Billion)

10.5.2.8.2 Rest of Africa Vision Processing Unit Market Estimates and Forecasts, By Application (2020-2032) (USD Billion)

10.5.2.8.3 Rest of Africa Vision Processing Unit Market Estimates and Forecasts, By Vertical (2020-2032) (USD Billion)

10.6 Latin America

10.6.1 Trends Analysis

10.6.2 Latin America Vision Processing Unit Market Estimates and Forecasts, by Country (2020-2032) (USD Billion)

10.6.3 Latin America Vision Processing Unit Market Estimates and Forecasts, By Fabrication Process (2020-2032) (USD Billion) 

10.6.4 Latin America Vision Processing Unit Market Estimates and Forecasts, By Application (2020-2032) (USD Billion)

10.6.5 Latin America Vision Processing Unit Market Estimates and Forecasts, By Vertical (2020-2032) (USD Billion)

10.6.6 Brazil

10.6.6.1 Brazil Vision Processing Unit Market Estimates and Forecasts, By Fabrication Process (2020-2032) (USD Billion)

10.6.6.2 Brazil Vision Processing Unit Market Estimates and Forecasts, By Application (2020-2032) (USD Billion)

10.6.6.3 Brazil Vision Processing Unit Market Estimates and Forecasts, By Vertical (2020-2032) (USD Billion)

10.6.7 Argentina

10.6.7.1 Argentina Vision Processing Unit Market Estimates and Forecasts, By Fabrication Process (2020-2032) (USD Billion)

10.6.7.2 Argentina Vision Processing Unit Market Estimates and Forecasts, By Application (2020-2032) (USD Billion)

10.6.7.3 Argentina Vision Processing Unit Market Estimates and Forecasts, By Vertical (2020-2032) (USD Billion)

10.6.8 Colombia

10.6.8.1 Colombia Vision Processing Unit Market Estimates and Forecasts, By Fabrication Process (2020-2032) (USD Billion)

10.6.8.2 Colombia Vision Processing Unit Market Estimates and Forecasts, By Application (2020-2032) (USD Billion)

10.6.8.3 Colombia Vision Processing Unit Market Estimates and Forecasts, By Vertical (2020-2032) (USD Billion)

10.6.9 Rest of Latin America

10.6.9.1 Rest of Latin America Vision Processing Unit Market Estimates and Forecasts, By Fabrication Process (2020-2032) (USD Billion)

10.6.9.2 Rest of Latin America Vision Processing Unit Market Estimates and Forecasts, By Application (2020-2032) (USD Billion)

10.6.9.3 Rest of Latin America Vision Processing Unit Market Estimates and Forecasts, By Vertical (2020-2032) (USD Billion)

11. Company Profiles

11.1 Intel Corporation

11.1.1 Company Overview

11.1.2 Financial

11.1.3 Products/ Services Offered

11.1.4 SWOT Analysis

11.2 Qualcomm Technologies Inc.

11.2.1 Company Overview

11.2.2 Financial

11.2.3 Products/ Services Offered

11.2.4 SWOT Analysis

11.3 NXP Semiconductors

11.3.1 Company Overview

11.3.2 Financial

11.3.3 Products/ Services Offered

11.3.4 SWOT Analysis

11.4 Synopsys Inc.

11.4.1 Company Overview

11.4.2 Financial

11.4.3 Products/ Services Offered

11.4.4 SWOT Analysis

11.5 MediaTek Inc

11.5.1 Company Overview

11.5.2 Financial

11.5.3 Products/ Services Offered

11.5.4 SWOT Analysis

11.6 Ambarella Inc

11.6.1 Company Overview

11.6.2 Financial

11.6.3 Products/ Services Offered

11.6.4 SWOT Analysis

11.7 Ceva Inc.

11.7.1 Company Overview

11.7.2 Financial

11.7.3 Products/ Services Offered

11.7.4 SWOT Analysis

11.8 Cadence Design Systems Inc.

11.8.1 Company Overview

11.8.2 Financial

11.8.3 Products/ Services Offered

11.8.4 SWOT Analysis

11.9 Himax Technologies Inc.

11.9.1 Company Overview

11.9.2 Financial

11.9.3 Products/ Services Offered

11.9.4 SWOT Analysis

11.10 Rockchip Electronics Co., Ltd.

11.10.1 Company Overview

11.10.2 Financial

11.10.3 Products/ Services Offered

11.10.4 SWOT Analysis

12. Use Cases and Best Practices

13. Conclusion

An accurate research report requires proper strategizing as well as implementation. There are multiple factors involved in the completion of good and accurate research report and selecting the best methodology to compete the research is the toughest part. Since the research reports we provide play a crucial role in any company’s decision-making process, therefore we at SNS Insider always believe that we should choose the best method which gives us results closer to reality. This allows us to reach at a stage wherein we can provide our clients best and accurate investment to output ratio.

Each report that we prepare takes a timeframe of 350-400 business hours for production. Starting from the selection of titles through a couple of in-depth brain storming session to the final QC process before uploading our titles on our website we dedicate around 350 working hours. The titles are selected based on their current market cap and the foreseen CAGR and growth.


The 5 steps process:

Step 1: Secondary Research:

Secondary Research or Desk Research is as the name suggests is a research process wherein, we collect data through the readily available information. In this process we use various paid and unpaid databases which our team has access to and gather data through the same. This includes examining of listed companies’ annual reports, Journals, SEC filling etc. Apart from this our team has access to various associations across the globe across different industries. Lastly, we have exchange relationships with various university as well as individual libraries.

Secondary Research

Step 2: Primary Research

When we talk about primary research, it is a type of study in which the researchers collect relevant data samples directly, rather than relying on previously collected data.  This type of research is focused on gaining content specific facts that can be sued to solve specific problems. Since the collected data is fresh and first hand therefore it makes the study more accurate and genuine.

We at SNS Insider have divided Primary Research into 2 parts.

Part 1 wherein we interview the KOLs of major players as well as the upcoming ones across various geographic regions. This allows us to have their view over the market scenario and acts as an important tool to come closer to the accurate market numbers. As many as 45 paid and unpaid primary interviews are taken from both the demand and supply side of the industry to make sure we land at an accurate judgement and analysis of the market.

This step involves the triangulation of data wherein our team analyses the interview transcripts, online survey responses and observation of on filed participants. The below mentioned chart should give a better understanding of the part 1 of the primary interview.

Primary Research

Part 2: In this part of primary research the data collected via secondary research and the part 1 of the primary research is validated with the interviews from individual consultants and subject matter experts.

Consultants are those set of people who have at least 12 years of experience and expertise within the industry whereas Subject Matter Experts are those with at least 15 years of experience behind their back within the same space. The data with the help of two main processes i.e., FGDs (Focused Group Discussions) and IDs (Individual Discussions). This gives us a 3rd party nonbiased primary view of the market scenario making it a more dependable one while collation of the data pointers.

Step 3: Data Bank Validation

Once all the information is collected via primary and secondary sources, we run that information for data validation. At our intelligence centre our research heads track a lot of information related to the market which includes the quarterly reports, the daily stock prices, and other relevant information. Our data bank server gets updated every fortnight and that is how the information which we collected using our primary and secondary information is revalidated in real time.

Data Bank Validation

Step 4: QA/QC Process

After all the data collection and validation our team does a final level of quality check and quality assurance to get rid of any unwanted or undesired mistakes. This might include but not limited to getting rid of the any typos, duplication of numbers or missing of any important information. The people involved in this process include technical content writers, research heads and graphics people. Once this process is completed the title gets uploader on our platform for our clients to read it.

Step 5: Final QC/QA Process:

This is the last process and comes when the client has ordered the study. In this process a final QA/QC is done before the study is emailed to the client. Since we believe in giving our clients a good experience of our research studies, therefore, to make sure that we do not lack at our end in any way humanly possible we do a final round of quality check and then dispatch the study to the client.

Key Segments:

By Fabrication Process

  • ≤16 nm

  • >16-28 nm

By Application

  • Smartphones

  • Drones

  • Cameras

  • AR/VR

  • ADAS

  • Others

By Vertical

  • Consumer electronics

  • Security and surveillance

  • Automotive

  • Healthcare

  • Others

Request for Segment Customization as per your Business Requirement: Segment Customization Request

Regional Coverage:

North America

  • US

  • Canada

  • Mexico

Europe

  • Eastern Europe

    • Poland

    • Romania

    • Hungary

    • Turkey

    • Rest of Eastern Europe

  • Western Europe

    • Germany

    • France

    • UK

    • Italy

    • Spain

    • Netherlands

    • Switzerland

    • Austria

    • Rest of Western Europe

Asia Pacific

  • China

  • India

  • Japan

  • South Korea

  • Vietnam

  • Singapore

  • Australia

  • Rest of Asia Pacific

Middle East & Africa

  • Middle East

    • UAE

    • Egypt

    • Saudi Arabia

    • Qatar

    • Rest of Middle East

  • Africa

    • Nigeria

    • South Africa

    • Rest of Africa

Latin America

  • Brazil

  • Argentina

  • Colombia

  • Rest of Latin America

Request for Country Level Research Report: Country Level Customization Request

Available Customization

With the given market data, SNS Insider offers customization as per the company’s specific needs. The following customization options are available for the report:

  • Detailed Volume Analysis

  • Criss-Cross segment analysis (e.g. Product X Application)

  • Competitive Product Benchmarking

  • Geographic Analysis

  • Additional countries in any of the regions

  • Customized Data Representation

  • Detailed analysis and profiling of additional market players


  •            5000 (33% Discount)


  •            8950 (40% Discount)


  •            3050 (23% Discount)

Start a Conversation

Hi! Click one of our member below to chat on Phone