image

 Virtual Sensors Market Size & Growth Insights:

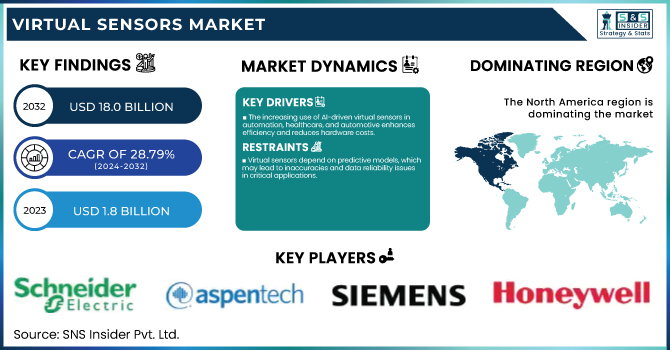
The Virtual Sensors Market Size was valued at USD 1.8 Billion in 2023 and is expected to reach USD 18.0 Billion by 2032, growing at a CAGR of 28.79% from 2024-2032. The adoption of virtual sensors is rising across industries such as automotive, manufacturing, and healthcare due to their cost-effectiveness and ability to enhance operational efficiency. These sensors are becoming more accurate and reliable with advancements in AI-driven algorithms, making them strong alternatives to traditional physical sensors.

Virtual Sensors Market Revenue Analysis

Get E-PDF Sample Report on Virtual Sensors Market - Request Sample Report

The market is witnessing significant regional growth, with key vendors competing based on innovation and industry demand. Virtual sensors also contribute to substantial cost savings by reducing hardware dependency and minimizing maintenance expenses. The report will explore AI and machine learning advancements, the regulatory landscape, integration with IoT and edge computing, and emerging trends shaping the future of the virtual sensors market.

Virtual Sensors Market Dynamis

Drivers

  • The increasing use of AI-driven virtual sensors in automation, healthcare, and automotive enhances efficiency and reduces hardware costs.

The adoption of virtual sensors is further driven by their growing significance in IoT and AI in industrial automation, automotive systems, and healthcare. Virtual sensors are non-physical sensors that use software algorithms to estimate data; thus, they are more cost-effective than physical sensors and allow for better efficiency. From predictive analytics powered by AI that allow you to make data-based decisions accurately and in real-time. With industries rapidly shifting to digital transformation, virtual sensors are scalable, affordable, and cost-effective solutions. Another factor for their increasing adoption is their ability to perform under extreme conditions without deterioration. Next-generation smart systems are poised at the intersection of cloud computing, edge AI, and various IoT deployments, and are expected to utilize virtual sensors extensively.

Restraints

  • Virtual sensors depend on predictive models, which may lead to inaccuracies and data reliability issues in critical applications.

However, virtual sensors have to deal with accuracy and mitigative challenges of data reliability. Discrepancies arise from the fact that these sensors rely on predictive models and software algorithms and not direct physical measurements; inaccuracies in the underlying software or calibration errors can easily lead to errors in buoyancy estimates. However, fields carrying high accuracy demands, like aerospace and healthcare, are somewhat reluctant to replace those physical sensors as they do not know how consistent the measurements are going to be. It is also very important to notice that virtual sensors are also dependent on good quality raw input data coming from the physical sensors, thus errors on the source data may severely affect their performance and accuracy of the output. Continuous improvement in AI with more stringent calibration techniques for AI-generated exhibits will help overcome these challenges and allow for greater acceptance.

Opportunities

  • Virtual sensors play a crucial role in digital twins and smart infrastructure, driving demand across industries like manufacturing and energy.

Large growth opportunities for virtual sensors are anticipated shortly due to the emergence of digital twin technology and smart infrastructure. Digital twins mimic real-world environments with virtual sensors, allowing for predictive maintenance, performance optimization, and improved decision-making. Application areas and sectors such as manufacturing, energy,  and smart cities are using these solutions more and more to enhance operational efficiency and reduce overall costs. In connected systems,  particularly where the automation relies on real-time data analysis, virtual sensors are essential. Virtual sensors will find new market opportunities as investments grow in Industry 4.0, smart grids and intelligent transportation, creating an accelerating market demand for virtual sensors.

Challenges

  • Compatibility issues with legacy systems and complex deployments hinder the seamless adoption of virtual sensors.

The market for virtual sensors faces major challenges, such as difficulties in integrating these sensors with existing IT and operational technology infrastructures. In multiple sectors, legacy systems are found causing a hindrance in virtual sensor implementation unless considerable upgrades are performed. Adoption can be slowed due to compatibility issues, challenges with data sync, and the shortage of experts who can operate Atlas software-based sensor systems. Moreover, operating these virtual sensors, cloud platforms, and edge devices ensure that networking and cybersecurity is a mature process. Addressing these integration challenges will be critical for organizations that want to unlock the full potential of virtual sensor technology.

Virtual Sensors Market Segmentation Overview

By Component

In 2023, the solution segment dominated the market and accounted for significant revenue share, as they are a fundamental part of data collection & analyzing data. Virtual sensor solutions give organizations the ability to monitor processes successfully and to improve operational efficiency; processes can be examined in real time, and the appropriate tools can be deployed to combat loss of efficiency. This has been particularly true for the solutions segment, as the demand for integrated systems for hardware and software-oriented capabilities continues to drive businesses towards integrated offerings that serve to augment data-driven decision-making processes.

The services segment is poised to grow at the fastest CAGR during the forecast period, as organizations are realizing the importance of support and maintenance in the proper functioning of their virtual sensors implementations. Consulting, training, and ongoing technical support are also critical to ensure that the virtual sensor systems are being used efficiently and are growing and changing with the business.

By Deployment

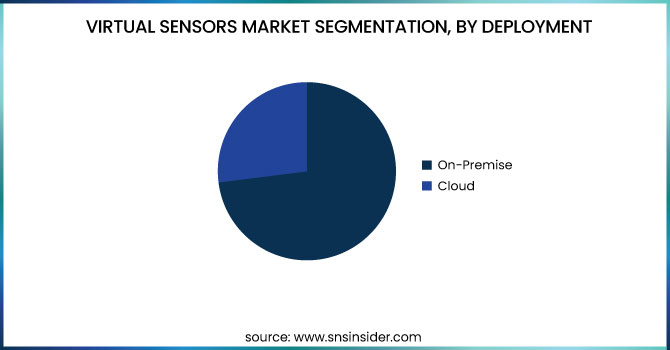
In 2023, the on-premise segment dominated the market and accounted for 73% of the market owing to benefits including data security and control. Due to security concerns, organizations prefer on-premise solutions as sensitive data is managed in-house, and the risk from a third-party data breach is reduced. Such a deployment mode also allows sensor virtualisation assets to be tailored for operational requirements, guaranteeing performance and reliability.

The cloud segment is expected to achieve the fastest compound annual growth rate throughout the forecast period as organizations look for more flexibility and scalability in their operations. Virtual sensors powered by the cloud allow for remote access to data, enabling real-time monitoring and analytics without requiring a massive physical infrastructure. Being able to roll out quickly and having the option to be updated quickly makes it an ideal deployment model for those enterprises looking to improve operational efficiency.

Virtual-Sensors-Market-segmentation-by-Deployment

By End-Use

In 2023, the manufacturing & utilities segment dominated the market and accounted for significant revenue share, due to their vital application in production processes and resource management. Enhanced monitoring capabilities lead to improved efficiency and reduced operational cost by way of predictive maintenance and real-time performance monitoring for these sectors.

The aerospace & defense segment is expected to register the fastest CAGR during the forecast period, due to increasing technological advancements, leading to new opportunities for application of virtual sensors in predictive maintenance and safety monitoring fields. Due to the growing emphasis on operational efficiency and safety in this industry, there is increasing demand for advanced virtual sensing technology that can deliver accurate data analytics and real-time insights into the flow and temperature of the fluid.

Virtual Sensors Market Regional Outlook

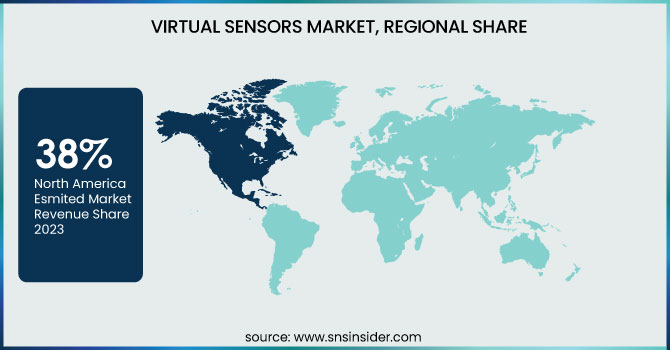
In 2023, North America dominated the market and accounted for 38% of revenue share, owing to its technological infrastructure and increasing implementation of virtual sensors in local industries. High focus on manufacturing, healthcare, and automotive sectors has led major investments in the virtual sensor technologies from the region. These solutions are increasingly being leveraged by organizations to improve operational efficiencies, reduce costs, and enhance decision-making processes.

Asia-Pacific is expected to register the fastest CAGR during the forecast period, Rapid industrialization and rising investments in smart technologies are the major factors driving the growth of the virtual sensors market in the Asia Pacific region. The fastest growing economies such as China, India, and Japan, along with rising adoption of advance monitoring solutions in industries is a major driving factor for the growth of the market.

Virtual-Sensors-Market-Regional-Share

Get Customized Report as Per Your Business Requirement - Request For Customized Report

Key Players

The major key players along with their products are

  • Siemens AG – XHQ Operations Intelligence

  • General Electric (GE) – Predix Digital Twin

  • IBM Corporation – IBM Watson IoT

  • Microsoft Corporation – Azure Digital Twins

  • SAP SE – SAP Predictive Engineering Insights

  • Schneider Electric– EcoStruxure Asset Advisor

  • Rockwell Automation – FactoryTalk Analytics

  • Emerson Electric Co. – Plantweb Digital Ecosystem

  • Honeywell International Inc. – Honeywell Forge

  • ABB Ltd. – ABB Ability Digital Powertrain

  • PTC Inc. – ThingWorx Industrial IoT Platform

  • Bosch Sensortec – BME AI-Studio

  • ANSYS, Inc. – ANSYS Twin Builder

  • Altair Engineering Inc. – Altair SmartWorks

  • Aspen Technology, Inc. – Aspen Mtell

Recent Developments

  • In 2024, Schneider Electric launched updates to its EcoStruxure platform, incorporating virtual sensor technology to improve energy management solutions.

  • In 2024, Rockwell Automation introduced enhancements to its FactoryTalk Analytics, leveraging virtual sensors to provide deeper insights into manufacturing processes.

Virtual Sensors Market Report Scope:

Report Attributes Details
Market Size in 2023 USD 1.8 Billion
Market Size by 2032 USD 18.0 Billion
CAGR CAGR of 28.79% From 2024 to 2032
Base Year 2023
Forecast Period 2024-2032
Historical Data 2020-2022
Report Scope & Coverage Market Size, Segments Analysis, Competitive  Landscape, Regional Analysis, DROC & SWOT Analysis, Forecast Outlook
Key Segments • By Component (Solutions, Services)
• By Deployment (Cloud, On-premise)
• By End-Use (Oil & Gas, Aerospace & Defense, Automotive & Transportation, Healthcare, Manufacturing & Utilities, Electronics, Others)
Regional Analysis/Coverage North America (US, Canada, Mexico), Europe (Eastern Europe [Poland, Romania, Hungary, Turkey, Rest of Eastern Europe] Western Europe] Germany, France, UK, Italy, Spain, Netherlands, Switzerland, Austria, Rest of Western Europe]), Asia Pacific (China, India, Japan, South Korea, Vietnam, Singapore, Australia, Rest of Asia Pacific), Middle East & Africa (Middle East [UAE, Egypt, Saudi Arabia, Qatar, Rest of Middle East], Africa [Nigeria, South Africa, Rest of Africa], Latin America (Brazil, Argentina, Colombia, Rest of Latin America)
Company Profiles Siemens AG, General Electric (GE), IBM Corporation, Microsoft Corporation, SAP SE, Schneider Electric, Rockwell Automation, Emerson Electric Co., Honeywell International Inc., ABB Ltd., PTC Inc., Bosch Sensortec, ANSYS, Inc., Altair Engineering Inc., Aspen Technology, Inc.

Frequently Asked Questions

Ans - The  Virtual Sensors Market was valued at USD 1.8 Billion in 2023 and is expected to reach USD 18.0 Billion by 2032.

Ans- The CAGR of the  Virtual Sensors Market during the forecast period is 28.79% from 2024-2032.

Ans- Asia-Pacific is expected to register the fastest CAGR during the forecast period.

Ans- The increasing use of AI-driven virtual sensors in automation, healthcare, and automotive enhances efficiency and reduces hardware costs.

Ans- Compatibility issues with legacy systems and complex deployments hinder the seamless adoption of virtual sensors.

Table of Contents

1. Introduction

1.1 Market Definition

1.2 Scope (Inclusion and Exclusions)

1.3 Research Assumptions

2. Executive Summary

2.1 Market Overview

2.2 Regional Synopsis

2.3 Competitive Summary

3. Research Methodology

3.1 Top-Down Approach

3.2 Bottom-up Approach

3.3. Data Validation

3.4 Primary Interviews

4. Market Dynamics Impact Analysis

4.1 Market Driving Factors Analysis

4.1.1 Drivers

4.1.2 Restraints

4.1.3 Opportunities

4.1.4 Challenges

4.2 PESTLE Analysis

4.3 Porter’s Five Forces Model

5. Statistical Insights and Trends Reporting

5.1 Adoption Rate of Virtual Sensors, by Industry (Automotive, Manufacturing, Healthcare, etc.)

5.2 Accuracy and Performance Improvements in Virtual Sensors vs. Physical Sensors

5.3 Market Share of Key Virtual Sensor Vendors, by Region

5.4 Cost Savings Achieved Through Virtual Sensor Implementation, by Application

6. Competitive Landscape

6.1 List of Major Companies, By Region

6.2 Market Share Analysis, By Region

6.3 Product Benchmarking

6.3.1 Product specifications and features

6.3.2 Pricing

6.4 Strategic Initiatives

6.4.1 Marketing and promotional activities

6.4.2 Distribution and supply chain strategies

6.4.3 Expansion plans and new product launches

6.4.4 Strategic partnerships and collaborations

6.5 Technological Advancements

6.6 Market Positioning and Branding

7. Virtual Sensors Market Segmentation, By Component

7.1 Chapter Overview

7.2 Solutions

7.2.1 Solutions Market Trends Analysis (2020-2032)

7.2.2 Solutions Market Size Estimates and Forecasts to 2032 (USD Billion)

   7.3 Services

7.3.1 Services Market Trends Analysis (2020-2032)

7.3.2 Services Market Size Estimates and Forecasts to 2032 (USD Billion)

8. Virtual Sensors Market Segmentation, by Deployment

8.1 Chapter Overview

8.2 Cloud

        8.2.1 Cloud Market Trends Analysis (2020-2032)

8.2.2 Cloud Market Size Estimates and Forecasts to 2032 (USD Billion)

8.3 On-premise

8.3.1 On-premise Market Trends Analysis (2020-2032)

8.3.2 On-premise Market Size Estimates and Forecasts to 2032 (USD Billion)

   9. Virtual Sensors Market Segmentation, by End-Use  

9.1 Chapter Overview

9.2 Oil & Gas

        9.2.1 Oil & Gas Market Trends Analysis (2020-2032)

9.2.2 Oil & Gas Market Size Estimates and Forecasts to 2032 (USD Billion)

9.3 Aerospace & Defense

        9.3.1 Aerospace & Defense Market Trends Analysis (2020-2032)

9.3.2 Aerospace & Defense Market Size Estimates and Forecasts to 2032 (USD Billion)

9.4 Automotive & Transportation

        9.4.1 Automotive & Transportation Market Trends Analysis (2020-2032)

9.4.2 Automotive & Transportation Market Size Estimates and Forecasts to 2032 (USD Billion)

9.5 Healthcare

        9.5.1 Healthcare Market Trends Analysis (2020-2032)

9.5.2 Healthcare Market Size Estimates and Forecasts to 2032 (USD Billion)

9.6 Manufacturing & Utilities

        9.6.1 Manufacturing & Utilities Market Trends Analysis (2020-2032)

9.6.2 Manufacturing & Utilities Market Size Estimates and Forecasts to 2032 (USD Billion)

9.7 Electronics

        9.7.1 Electronics Market Trends Analysis (2020-2032)

9.7.2 Electronics Market Size Estimates and Forecasts to 2032 (USD Billion)

9.8 Others

        9.8.1 Others Market Trends Analysis (2020-2032)

9.8.2 Others Market Size Estimates and Forecasts to 2032 (USD Billion)

10. Regional Analysis

10.1 Chapter Overview

10.2 North America

10.2.1 Trends Analysis

10.2.2 North America Virtual Sensors Market Estimates and Forecasts, by Country (2020-2032) (USD Billion)

10.2.3 North America Virtual Sensors Market Estimates and Forecasts, By Component (2020-2032) (USD Billion) 

10.2.4 North America Virtual Sensors Market Estimates and Forecasts, by Deployment (2020-2032) (USD Billion)

10.2.5 North America Virtual Sensors Market Estimates and Forecasts, by End-Use (2020-2032) (USD Billion)

10.2.6 USA

10.2.6.1 USA Virtual Sensors Market Estimates and Forecasts, By Component (2020-2032) (USD Billion)

10.2.6.2 USA Virtual Sensors Market Estimates and Forecasts, by Deployment (2020-2032) (USD Billion)

10.2.6.3 USA Virtual Sensors Market Estimates and Forecasts, by End-Use (2020-2032) (USD Billion)

10.2.7 Canada

10.2.7.1 Canada Virtual Sensors Market Estimates and Forecasts, By Component (2020-2032) (USD Billion)

10.2.7.2 Canada Virtual Sensors Market Estimates and Forecasts, by Deployment (2020-2032) (USD Billion)

10.2.7.3 Canada Virtual Sensors Market Estimates and Forecasts, by End-Use (2020-2032) (USD Billion)

10.2.8 Mexico

10.2.8.1 Mexico Virtual Sensors Market Estimates and Forecasts, By Component (2020-2032) (USD Billion)

10.2.8.2 Mexico Virtual Sensors Market Estimates and Forecasts, by Deployment (2020-2032) (USD Billion)

10.2.8.3 Mexico Virtual Sensors Market Estimates and Forecasts, by End-Use (2020-2032) (USD Billion)

10.3 Europe

10.3.1 Eastern Europe

10.3.1.1 Trends Analysis

10.3.1.2 Eastern Europe Virtual Sensors Market Estimates and Forecasts, by Country (2020-2032) (USD Billion)

10.3.1.3 Eastern Europe Virtual Sensors Market Estimates and Forecasts, By Component (2020-2032) (USD Billion) 

10.3.1.4 Eastern Europe Virtual Sensors Market Estimates and Forecasts, by Deployment (2020-2032) (USD Billion)

10.3.1.5 Eastern Europe Virtual Sensors Market Estimates and Forecasts, by End-Use (2020-2032) (USD Billion)

10.3.1.6 Poland

10.3.1.6.1 Poland Virtual Sensors Market Estimates and Forecasts, By Component (2020-2032) (USD Billion)

10.3.1.6.2 Poland Virtual Sensors Market Estimates and Forecasts, by Deployment (2020-2032) (USD Billion)

10.3.1.6.3 Poland Virtual Sensors Market Estimates and Forecasts, by End-Use (2020-2032) (USD Billion)

10.3.1.7 Romania

10.3.1.7.1 Romania Virtual Sensors Market Estimates and Forecasts, By Component (2020-2032) (USD Billion)

10.3.1.7.2 Romania Virtual Sensors Market Estimates and Forecasts, by Deployment (2020-2032) (USD Billion)

10.3.1.7.3 Romania Virtual Sensors Market Estimates and Forecasts, by End-Use (2020-2032) (USD Billion)

10.3.1.8 Hungary

10.3.1.8.1 Hungary Virtual Sensors Market Estimates and Forecasts, By Component (2020-2032) (USD Billion)

10.3.1.8.2 Hungary Virtual Sensors Market Estimates and Forecasts, by Deployment (2020-2032) (USD Billion)

10.3.1.8.3 Hungary Virtual Sensors Market Estimates and Forecasts, by End-Use (2020-2032) (USD Billion)

10.3.1.9 Turkey

10.3.1.9.1 Turkey Virtual Sensors Market Estimates and Forecasts, By Component (2020-2032) (USD Billion)

10.3.1.9.2 Turkey Virtual Sensors Market Estimates and Forecasts, by Deployment (2020-2032) (USD Billion)

10.3.1.9.3 Turkey Virtual Sensors Market Estimates and Forecasts, by End-Use (2020-2032) (USD Billion)

10.3.1.10 Rest of Eastern Europe

10.3.1.10.1 Rest of Eastern Europe Virtual Sensors Market Estimates and Forecasts, By Component (2020-2032) (USD Billion)

10.3.1.10.2 Rest of Eastern Europe Virtual Sensors Market Estimates and Forecasts, by Deployment (2020-2032) (USD Billion)

10.3.1.10.3 Rest of Eastern Europe Virtual Sensors Market Estimates and Forecasts, by End-Use (2020-2032) (USD Billion)

10.3.2 Western Europe

10.3.2.1 Trends Analysis

10.3.2.2 Western Europe Virtual Sensors Market Estimates and Forecasts, by Country (2020-2032) (USD Billion)

10.3.2.3 Western Europe Virtual Sensors Market Estimates and Forecasts, By Component (2020-2032) (USD Billion) 

10.3.2.4 Western Europe Virtual Sensors Market Estimates and Forecasts, by Deployment (2020-2032) (USD Billion)

10.3.2.5 Western Europe Virtual Sensors Market Estimates and Forecasts, by End-Use (2020-2032) (USD Billion)

10.3.2.6 Germany

10.3.2.6.1 Germany Virtual Sensors Market Estimates and Forecasts, By Component (2020-2032) (USD Billion)

10.3.2.6.2 Germany Virtual Sensors Market Estimates and Forecasts, by Deployment (2020-2032) (USD Billion)

10.3.2.6.3 Germany Virtual Sensors Market Estimates and Forecasts, by End-Use (2020-2032) (USD Billion)

10.3.2.7 France

10.3.2.7.1 France Virtual Sensors Market Estimates and Forecasts, By Component (2020-2032) (USD Billion)

10.3.2.7.2 France Virtual Sensors Market Estimates and Forecasts, by Deployment (2020-2032) (USD Billion)

10.3.2.7.3 France Virtual Sensors Market Estimates and Forecasts, by End-Use (2020-2032) (USD Billion)

10.3.2.8 UK

10.3.2.8.1 UK Virtual Sensors Market Estimates and Forecasts, By Component (2020-2032) (USD Billion)

10.3.2.8.2 UK Virtual Sensors Market Estimates and Forecasts, by Deployment (2020-2032) (USD Billion)

10.3.2.8.3 UK Virtual Sensors Market Estimates and Forecasts, by End-Use (2020-2032) (USD Billion)

10.3.2.9 Italy

10.3.2.9.1 Italy Virtual Sensors Market Estimates and Forecasts, By Component (2020-2032) (USD Billion)

10.3.2.9.2 Italy Virtual Sensors Market Estimates and Forecasts, by Deployment (2020-2032) (USD Billion)

10.3.2.9.3 Italy Virtual Sensors Market Estimates and Forecasts, by End-Use (2020-2032) (USD Billion)

10.3.2.10 Spain

10.3.2.10.1 Spain Virtual Sensors Market Estimates and Forecasts, By Component (2020-2032) (USD Billion)

10.3.2.10.2 Spain Virtual Sensors Market Estimates and Forecasts, by Deployment (2020-2032) (USD Billion)

10.3.2.10.3 Spain Virtual Sensors Market Estimates and Forecasts, by End-Use (2020-2032) (USD Billion)

10.3.2.11 Netherlands

10.3.2.11.1 Netherlands Virtual Sensors Market Estimates and Forecasts, By Component (2020-2032) (USD Billion)

10.3.2.11.2 Netherlands Virtual Sensors Market Estimates and Forecasts, by Deployment (2020-2032) (USD Billion)

10.3.2.11.3 Netherlands Virtual Sensors Market Estimates and Forecasts, by End-Use (2020-2032) (USD Billion)

10.3.2.12 Switzerland

10.3.2.12.1 Switzerland Virtual Sensors Market Estimates and Forecasts, By Component (2020-2032) (USD Billion)

10.3.2.12.2 Switzerland Virtual Sensors Market Estimates and Forecasts, by Deployment (2020-2032) (USD Billion)

10.3.2.12.3 Switzerland Virtual Sensors Market Estimates and Forecasts, by End-Use (2020-2032) (USD Billion)

10.3.2.13 Austria

10.3.2.13.1 Austria Virtual Sensors Market Estimates and Forecasts, By Component (2020-2032) (USD Billion)

10.3.2.13.2 Austria Virtual Sensors Market Estimates and Forecasts, by Deployment (2020-2032) (USD Billion)

10.3.2.13.3 Austria Virtual Sensors Market Estimates and Forecasts, by End-Use (2020-2032) (USD Billion)

10.3.2.14 Rest of Western Europe

10.3.2.14.1 Rest of Western Europe Virtual Sensors Market Estimates and Forecasts, By Component (2020-2032) (USD Billion)

10.3.2.14.2 Rest of Western Europe Virtual Sensors Market Estimates and Forecasts, by Deployment (2020-2032) (USD Billion)

10.3.2.14.3 Rest of Western Europe Virtual Sensors Market Estimates and Forecasts, by End-Use (2020-2032) (USD Billion)

10.4 Asia Pacific

10.4.1 Trends Analysis

10.4.2 Asia Pacific Virtual Sensors Market Estimates and Forecasts, by Country (2020-2032) (USD Billion)

10.4.3 Asia Pacific Virtual Sensors Market Estimates and Forecasts, By Component (2020-2032) (USD Billion) 

10.4.4 Asia Pacific Virtual Sensors Market Estimates and Forecasts, by Deployment (2020-2032) (USD Billion)

10.4.5 Asia Pacific Virtual Sensors Market Estimates and Forecasts, by End-Use (2020-2032) (USD Billion)

10.4.6 China

10.4.6.1 China Virtual Sensors Market Estimates and Forecasts, By Component (2020-2032) (USD Billion)

10.4.6.2 China Virtual Sensors Market Estimates and Forecasts, by Display (2020-2032) (USD Billion)

10.4.6.3 China Virtual Sensors Market Estimates and Forecasts, by End-Use (2020-2032) (USD Billion)

10.4.7 India

10.4.7.1 India Virtual Sensors Market Estimates and Forecasts, By Component (2020-2032) (USD Billion)

10.4.7.2 India Virtual Sensors Market Estimates and Forecasts, by Deployment (2020-2032) (USD Billion)

10.4.7.3 India Virtual Sensors Market Estimates and Forecasts, by End-Use (2020-2032) (USD Billion)

10.4.8 Japan

10.4.8.1 Japan Virtual Sensors Market Estimates and Forecasts, By Component (2020-2032) (USD Billion)

10.4.8.2 Japan Virtual Sensors Market Estimates and Forecasts, by Deployment (2020-2032) (USD Billion)

10.4.8.3 Japan Virtual Sensors Market Estimates and Forecasts, by End-Use (2020-2032) (USD Billion)

10.4.9 South Korea

10.4.9.1 South Korea Virtual Sensors Market Estimates and Forecasts, By Component (2020-2032) (USD Billion)

10.4.9.2 South Korea Virtual Sensors Market Estimates and Forecasts, by Deployment (2020-2032) (USD Billion)

10.4.9.3 South Korea Virtual Sensors Market Estimates and Forecasts, by End-Use (2020-2032) (USD Billion)

10.4.10 Vietnam

10.4.10.1 Vietnam Virtual Sensors Market Estimates and Forecasts, By Component (2020-2032) (USD Billion)

10.4.10.2 Vietnam Virtual Sensors Market Estimates and Forecasts, by Deployment (2020-2032) (USD Billion)

10.4.10.3 Vietnam Virtual Sensors Market Estimates and Forecasts, by End-Use (2020-2032) (USD Billion)

10.4.11 Singapore

10.4.11.1 Singapore Virtual Sensors Market Estimates and Forecasts, By Component (2020-2032) (USD Billion)

10.4.11.2 Singapore Virtual Sensors Market Estimates and Forecasts, by Deployment (2020-2032) (USD Billion)

10.4.11.3 Singapore Virtual Sensors Market Estimates and Forecasts, by End-Use (2020-2032) (USD Billion)

10.4.12 Australia

10.4.12.1 Australia Virtual Sensors Market Estimates and Forecasts, By Component (2020-2032) (USD Billion)

10.4.12.2 Australia Virtual Sensors Market Estimates and Forecasts, by Deployment (2020-2032) (USD Billion)

10.4.12.3 Australia Virtual Sensors Market Estimates and Forecasts, by End-Use (2020-2032) (USD Billion)

10.4.13 Rest of Asia Pacific

10.4.13.1 Rest of Asia Pacific Virtual Sensors Market Estimates and Forecasts, By Component (2020-2032) (USD Billion)

10.4.13.2 Rest of Asia Pacific Virtual Sensors Market Estimates and Forecasts, by Deployment (2020-2032) (USD Billion)

10.4.13.3 Rest of Asia Pacific Virtual Sensors Market Estimates and Forecasts, by End-Use (2020-2032) (USD Billion)

10.5 Middle East and Africa

10.5.1 Middle East

10.5.1.1 Trends Analysis

10.5.1.2 Middle East Virtual Sensors Market Estimates and Forecasts, by Country (2020-2032) (USD Billion)

10.5.1.3 Middle East Virtual Sensors Market Estimates and Forecasts, By Component (2020-2032) (USD Billion) 

10.5.1.4 Middle East Virtual Sensors Market Estimates and Forecasts, by Deployment (2020-2032) (USD Billion)

10.5.1.5 Middle East Virtual Sensors Market Estimates and Forecasts, by End-Use (2020-2032) (USD Billion)

10.5.1.6 UAE

10.5.1.6.1 UAE Virtual Sensors Market Estimates and Forecasts, By Component (2020-2032) (USD Billion)

10.5.1.6.2 UAE Virtual Sensors Market Estimates and Forecasts, by Deployment (2020-2032) (USD Billion)

10.5.1.6.3 UAE Virtual Sensors Market Estimates and Forecasts, by End-Use (2020-2032) (USD Billion)

10.5.1.7 Egypt

10.5.1.7.1 Egypt Virtual Sensors Market Estimates and Forecasts, By Component (2020-2032) (USD Billion)

10.5.1.7.2 Egypt Virtual Sensors Market Estimates and Forecasts, by Deployment (2020-2032) (USD Billion)

10.5.1.7.3 Egypt Virtual Sensors Market Estimates and Forecasts, by End-Use (2020-2032) (USD Billion)

10.5.1.8 Saudi Arabia

10.5.1.8.1 Saudi Arabia Virtual Sensors Market Estimates and Forecasts, By Component (2020-2032) (USD Billion)

10.5.1.8.2 Saudi Arabia Virtual Sensors Market Estimates and Forecasts, by Deployment (2020-2032) (USD Billion)

10.5.1.8.3 Saudi Arabia Virtual Sensors Market Estimates and Forecasts, by End-Use (2020-2032) (USD Billion)

10.5.1.9 Qatar

10.5.1.9.1 Qatar Virtual Sensors Market Estimates and Forecasts, By Component (2020-2032) (USD Billion)

10.5.1.9.2 Qatar Virtual Sensors Market Estimates and Forecasts, by Deployment (2020-2032) (USD Billion)

10.5.1.9.3 Qatar Virtual Sensors Market Estimates and Forecasts, by End-Use (2020-2032) (USD Billion)

10.5.1.10 Rest of Middle East

10.5.1.10.1 Rest of Middle East Virtual Sensors Market Estimates and Forecasts, By Component (2020-2032) (USD Billion)

10.5.1.10.2 Rest of Middle East Virtual Sensors Market Estimates and Forecasts, by Deployment (2020-2032) (USD Billion)

10.5.1.10.3 Rest of Middle East Virtual Sensors Market Estimates and Forecasts, by End-Use (2020-2032) (USD Billion)

10.5.2 Africa

10.5.2.1 Trends Analysis

10.5.2.2 Africa Virtual Sensors Market Estimates and Forecasts, by Country (2020-2032) (USD Billion)

10.5.2.3 Africa Virtual Sensors Market Estimates and Forecasts, By Component (2020-2032) (USD Billion) 

10.5.2.4 Africa Virtual Sensors Market Estimates and Forecasts, by Deployment (2020-2032) (USD Billion)

10.5.2.5 Africa Virtual Sensors Market Estimates and Forecasts, by End-Use (2020-2032) (USD Billion)

10.5.2.6 South Africa

10.5.2.6.1 South Africa Virtual Sensors Market Estimates and Forecasts, By Component (2020-2032) (USD Billion)

10.5.2.6.2 South Africa Virtual Sensors Market Estimates and Forecasts, by Deployment (2020-2032) (USD Billion)

10.5.2.6.3 South Africa Virtual Sensors Market Estimates and Forecasts, by End-Use (2020-2032) (USD Billion)

10.5.2.7 Nigeria

10.5.2.7.1 Nigeria Virtual Sensors Market Estimates and Forecasts, By Component (2020-2032) (USD Billion)

10.5.2.7.2 Nigeria Virtual Sensors Market Estimates and Forecasts, by Deployment (2020-2032) (USD Billion)

10.5.2.7.3 Nigeria Virtual Sensors Market Estimates and Forecasts, by End-Use (2020-2032) (USD Billion)

10.5.2.8 Rest of Africa

10.5.2.8.1 Rest of Africa Virtual Sensors Market Estimates and Forecasts, By Component (2020-2032) (USD Billion)

10.5.2.8.2 Rest of Africa Virtual Sensors Market Estimates and Forecasts, by Deployment (2020-2032) (USD Billion)

10.5.2.8.3 Rest of Africa Virtual Sensors Market Estimates and Forecasts, by End-Use (2020-2032) (USD Billion)

10.6 Latin America

10.6.1 Trends Analysis

10.6.2 Latin America Virtual Sensors Market Estimates and Forecasts, by Country (2020-2032) (USD Billion)

10.6.3 Latin America Virtual Sensors Market Estimates and Forecasts, By Component (2020-2032) (USD Billion) 

10.6.4 Latin America Virtual Sensors Market Estimates and Forecasts, by Deployment (2020-2032) (USD Billion)

10.6.5 Latin America Virtual Sensors Market Estimates and Forecasts, by End-Use (2020-2032) (USD Billion)

10.6.6 Brazil

10.6.6.1 Brazil Virtual Sensors Market Estimates and Forecasts, By Component (2020-2032) (USD Billion)

10.6.6.2 Brazil Virtual Sensors Market Estimates and Forecasts, by Deployment (2020-2032) (USD Billion)

10.6.6.3 Brazil Virtual Sensors Market Estimates and Forecasts, by End-Use (2020-2032) (USD Billion)

10.6.7 Argentina

10.6.7.1 Argentina Virtual Sensors Market Estimates and Forecasts, By Component (2020-2032) (USD Billion)

10.6.7.2 Argentina Virtual Sensors Market Estimates and Forecasts, by Deployment (2020-2032) (USD Billion)

10.6.7.3 Argentina Virtual Sensors Market Estimates and Forecasts, by End-Use (2020-2032) (USD Billion)

10.6.8 Colombia

10.6.8.1 Colombia Virtual Sensors Market Estimates and Forecasts, By Component (2020-2032) (USD Billion)

10.6.8.2 Colombia Virtual Sensors Market Estimates and Forecasts, by Deployment (2020-2032) (USD Billion)

10.6.8.3 Colombia Virtual Sensors Market Estimates and Forecasts, by End-Use (2020-2032) (USD Billion)

10.6.9 Rest of Latin America

10.6.9.1 Rest of Latin America Virtual Sensors Market Estimates and Forecasts, By Component (2020-2032) (USD Billion)

10.6.9.2 Rest of Latin America Virtual Sensors Market Estimates and Forecasts, by Enterprise Size (2020-2032) (USD Billion)

10.6.9.3 Rest of Latin America Virtual Sensors Market Estimates and Forecasts, by End-Use (2020-2032) (USD Billion)

11. Company Profiles

11.1     Siemens AG


              11.1.1 Company Overview

11.1.2 Financial

11.1.3 Products/ Services Offered

11.1.4 SWOT Analysis

11.2 General Electric (GE)


             11.2.1 Company Overview

11.2.2 Financial

11.2.3 Products/ Services Offered

11.2.4 SWOT Analysis

11.3 IBM Corporation

              11.3.1 Company Overview

11.3.2 Financial

11.3.3 Products/ Services Offered

11.3.4 SWOT Analysis

11.4 Microsoft Corporation

             11.4.1 Company Overview

11.4.2 Financial

11.4.3 Products/ Services Offered

11.4.4 SWOT Analysis

11.5 SAP SE

              11.5.1 Company Overview

11.5.2 Financial

11.5.3 Products/ Services Offered

11.5.4 SWOT Analysis

11.6 Schneider Electric

             11.6.1 Company Overview

11.6.2 Financial

11.6.3 Products/ Services Offered

11.6.4 SWOT Analysis

11.7 Rockwell Automation

             11.7.1 Company Overview

11.7.2 Financial

11.7.3 Products/ Services Offered

11.7.4 SWOT Analysis

11.8 Emerson Electric Co.

             11.8.1 Company Overview

11.8.2 Financial

11.8.3 Products/ Services Offered

11.8.4 SWOT Analysis

11.9 Honeywell International Inc.

             11.9.1 Company Overview

11.9.2 Financial

11.9.3 Products/ Services Offered

11.9.4 SWOT Analysis

11.10 ABB Ltd.

             11.10.1 Company Overview

11.10.2 Financial

11.10.3 Products/ Services Offered

11.10.4 SWOT Analysis

12. Use Cases and Best Practices

13. Conclusion

An accurate research report requires proper strategizing as well as implementation. There are multiple factors involved in the completion of good and accurate research report and selecting the best methodology to compete the research is the toughest part. Since the research reports we provide play a crucial role in any company’s decision-making process, therefore we at SNS Insider always believe that we should choose the best method which gives us results closer to reality. This allows us to reach at a stage wherein we can provide our clients best and accurate investment to output ratio.

Each report that we prepare takes a timeframe of 350-400 business hours for production. Starting from the selection of titles through a couple of in-depth brain storming session to the final QC process before uploading our titles on our website we dedicate around 350 working hours. The titles are selected based on their current market cap and the foreseen CAGR and growth.


The 5 steps process:

Step 1: Secondary Research:

Secondary Research or Desk Research is as the name suggests is a research process wherein, we collect data through the readily available information. In this process we use various paid and unpaid databases which our team has access to and gather data through the same. This includes examining of listed companies’ annual reports, Journals, SEC filling etc. Apart from this our team has access to various associations across the globe across different industries. Lastly, we have exchange relationships with various university as well as individual libraries.

Secondary Research

Step 2: Primary Research

When we talk about primary research, it is a type of study in which the researchers collect relevant data samples directly, rather than relying on previously collected data.  This type of research is focused on gaining content specific facts that can be sued to solve specific problems. Since the collected data is fresh and first hand therefore it makes the study more accurate and genuine.

We at SNS Insider have divided Primary Research into 2 parts.

Part 1 wherein we interview the KOLs of major players as well as the upcoming ones across various geographic regions. This allows us to have their view over the market scenario and acts as an important tool to come closer to the accurate market numbers. As many as 45 paid and unpaid primary interviews are taken from both the demand and supply side of the industry to make sure we land at an accurate judgement and analysis of the market.

This step involves the triangulation of data wherein our team analyses the interview transcripts, online survey responses and observation of on filed participants. The below mentioned chart should give a better understanding of the part 1 of the primary interview.

Primary Research

Part 2: In this part of primary research the data collected via secondary research and the part 1 of the primary research is validated with the interviews from individual consultants and subject matter experts.

Consultants are those set of people who have at least 12 years of experience and expertise within the industry whereas Subject Matter Experts are those with at least 15 years of experience behind their back within the same space. The data with the help of two main processes i.e., FGDs (Focused Group Discussions) and IDs (Individual Discussions). This gives us a 3rd party nonbiased primary view of the market scenario making it a more dependable one while collation of the data pointers.

Step 3: Data Bank Validation

Once all the information is collected via primary and secondary sources, we run that information for data validation. At our intelligence centre our research heads track a lot of information related to the market which includes the quarterly reports, the daily stock prices, and other relevant information. Our data bank server gets updated every fortnight and that is how the information which we collected using our primary and secondary information is revalidated in real time.

Data Bank Validation

Step 4: QA/QC Process

After all the data collection and validation our team does a final level of quality check and quality assurance to get rid of any unwanted or undesired mistakes. This might include but not limited to getting rid of the any typos, duplication of numbers or missing of any important information. The people involved in this process include technical content writers, research heads and graphics people. Once this process is completed the title gets uploader on our platform for our clients to read it.

Step 5: Final QC/QA Process:

This is the last process and comes when the client has ordered the study. In this process a final QA/QC is done before the study is emailed to the client. Since we believe in giving our clients a good experience of our research studies, therefore, to make sure that we do not lack at our end in any way humanly possible we do a final round of quality check and then dispatch the study to the client.

Key Industry Segments:

By Component

  • Solutions

  • Services

By Deployment

  • Cloud

  • On-premise

By End-Use

  • Oil & Gas

  • Aerospace & Defense

  • Automotive & Transportation

  • Healthcare

  • Manufacturing & Utilities

  • Electronics

  • Others

Request for Segment Customization as per your Business Requirement: Segment Customization Request

Regional Coverage:

North America

  • US

  • Canada

  • Mexico

Europe

  • Eastern Europe

    • Poland

    • Romania

    • Hungary

    • Turkey

    • Rest of Eastern Europe

  • Western Europe

    • Germany

    • France

    • UK

    • Italy

    • Spain

    • Netherlands

    • Switzerland

    • Austria

    • Rest of Western Europe

Asia Pacific

  • China

  • India

  • Japan

  • South Korea

  • Vietnam

  • Singapore

  • Australia

  • Rest of Asia Pacific

Middle East & Africa

  • Middle East

    • UAE

    • Egypt

    • Saudi Arabia

    • Qatar

    • Rest of Middle East

  • Africa

    • Nigeria

    • South Africa

    • Rest of Africa

Latin America

  • Brazil

  • Argentina

  • Colombia

  • Rest of Latin America

Request for Country Level Research Report: Country Level Customization Request

Available Customization

With the given market data, SNS Insider offers customization as per the company’s specific needs. The following customization options are available for the report:

  • Detailed Volume Analysis

  • Criss-Cross segment analysis (e.g. Product X Application)

  • Competitive Product Benchmarking

  • Geographic Analysis

  • Additional countries in any of the regions

  • Customized Data Representation

  • Detailed analysis and profiling of additional market players


  •            5000 (33% Discount)


  •            8950 (40% Discount)


  •            3050 (23% Discount)

Start a Conversation

Hi! Click one of our member below to chat on Phone