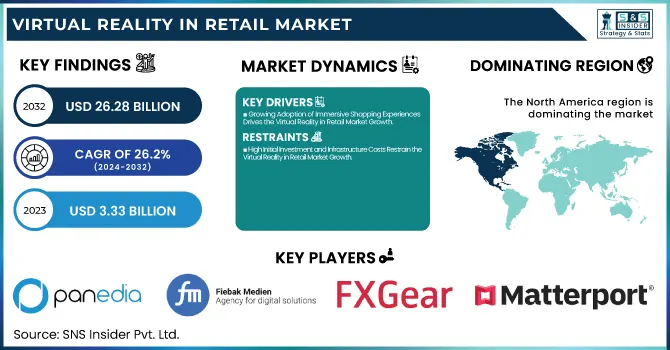
The Virtual Reality in Retail Market Size was valued at USD 3.33 Billion in 2023 and is expected to reach USD 26.28 Billion by 2032 and grow at a CAGR of 26.2% over the forecast period 2024-2032. The Market is revolutionizing consumer-brand interactions through immersive shopping experiences. Retailers are adopting VR for virtual showrooms, product visualization, and personalized shopping, enhancing engagement and reducing return rates.
To Get more information on Virtual Reality in Retail Market - Request Free Sample Report
Advancements like AI-driven assistants, haptic feedback, and 360-degree views are driving adoption, especially in fashion, home décor, and automotive retail. Growth is fueled by declining VR costs, rising internet penetration, and increased investments. Sustainability concerns are also pushing retailers toward virtual storefronts. Despite challenges like high costs and limited awareness, major retailers are embracing VR, shaping a hybrid, immersive future bridging physical and online shopping.
Growing Adoption of Immersive Shopping Experiences Drives the Virtual Reality in Retail Market Growth
The increasing demand for immersive and interactive shopping experiences is a major driver of the Virtual Reality (VR) in the Retail Market. Consumers are seeking engaging, personalized, and lifelike shopping environments, prompting retailers to integrate VR into their business models. Virtual showrooms, 360-degree product views, and digital try-ons enhance customer engagement and decision-making, reducing return rates and improving satisfaction. The rapid advancements in AI-driven virtual assistants and haptic feedback technologies further elevate the VR shopping experience.
Additionally, e-commerce giants and brick-and-mortar retailers are investing in VR to stay competitive, leveraging the technology to bridge the gap between online and in-store shopping. As more brands embrace VR to provide seamless, interactive experiences, the market is expected to witness significant growth. The expansion of high-speed internet and 5G networks is also accelerating VR adoption, ensuring smoother, more realistic virtual retail experiences. This trend is reshaping consumer expectations, driving the future of retail.
High Initial Investment and Infrastructure Costs Restrain the Virtual Reality in Retail Market Growth
Despite its potential, the high cost of implementing VR technology remains a significant restraint for the Virtual Reality Retail Market. Retailers must invest in VR hardware, software development, and digital content creation, which can be expensive, especially for small and medium-sized businesses. The cost of high-end VR headsets, motion tracking systems, and interactive digital interfaces further adds to the financial burden.
Additionally, creating realistic, high-quality VR shopping environments requires extensive technical expertise and continuous updates, increasing operational expenses. Many retailers also struggle with the need for specialized infrastructure, such as powerful computing systems, cloud-based data storage, and high-speed connectivity, to ensure smooth performance. Furthermore, customer adoption is still limited, with some shoppers hesitant to engage with VR shopping due to unfamiliarity or lack of accessibility to VR devices. These financial and technological barriers slow down the widespread adoption of VR in retail, restraining overall market growth.
Rising Integration of Artificial Intelligence with Virtual Reality Presents a Lucrative Opportunity for Virtual Reality in Retail Market
The combination of Artificial Intelligence (AI) and Virtual Reality (VR) is opening new opportunities for the retail market, enhancing customer engagement and personalization. AI-powered virtual shopping assistants, smart recommendation engines, and data-driven insights are redefining the online retail experience by offering consumers tailored product suggestions and real-time assistance. AI enhances realistic avatars, voice recognition, and interactive chatbots within VR environments, improving customer interaction and decision-making.
Additionally, AI-driven automated VR store designs and product simulations reduce development costs and time, making VR more accessible to retailers. As AI continues to advance, its integration with VR will create hyper-personalized shopping experiences, predictive analytics for consumer behavior, and more efficient virtual store operations, driving new revenue streams for businesses and accelerating VR adoption in the retail industry.
Limited Consumer Awareness and Accessibility Pose Challenges for Virtual Reality in Retail Market Growth
The Virtual Reality in Retail Market is the lack of consumer awareness and accessibility to VR technology. While major retailers are investing in VR solutions, many consumers are unfamiliar with how to navigate virtual shopping environments or use VR devices effectively. Limited availability of affordable, high-quality VR headsets and the need for high-speed internet further hinder widespread adoption.
Additionally, some consumers are hesitant to transition from traditional shopping experiences to fully immersive digital platforms due to concerns over ease of use, security, and overall practicality. The lack of standardized VR interfaces across different retailers also creates inconsistency, leading to potential frustration for shoppers. Retailers must invest in consumer education, user-friendly VR applications, and seamless device compatibility to drive mass adoption. Until VR in retail becomes more accessible and intuitive, overcoming this challenge remains critical for unlocking its full market potential.
By Device
The Head-Mounted Devices (HMDs) segment accounted for the largest revenue share of 62% in 2023, driven by the increasing adoption of immersive shopping experiences in retail. HMDs, such as VR headsets and smart glasses, offer consumers 360-degree product visualization, virtual store navigation, and digital try-ons, revolutionizing the shopping experience. Leading companies continue to enhance their VR offerings, launching lighter, high-resolution, and wireless VR headsets to improve accessibility and comfort for users. The rapid expansion of 5G networks and cloud-based VR platforms is making HMD adoption seamless, eliminating latency issues. With enhanced affordability and wider consumer awareness, the HMD segment is expected to maintain its dominance, shaping the future of retail engagement.
The Gesture Tracking Device (GTD) segment is projected to grow at the highest CAGR of 27.39% during the forecast period, fueled by the rising demand for touchless, intuitive interactions in virtual retail spaces. Gesture tracking technology enables users to navigate virtual stores, interact with digital products, and make selections using natural hand movements, eliminating the need for physical controllers. This segment is gaining traction among retailers seeking seamless, contact-free shopping solutions, particularly in the post-pandemic era. As consumers demand hyper-realistic shopping experiences, the gesture-based VR segment is set to redefine digital retail interactions, offering a frictionless and immersive alternative to traditional shopping methods.
By Application
The Planning & Designing segment led the Virtual Reality in Retail Market with a 31% revenue share in 2023, driven by increasing retailer adoption of VR-powered store layouts, product placements, and interior design simulations. Virtual reality enables businesses to create realistic 3D store prototypes, allowing retailers to optimize their layouts before physical execution, reducing costs and inefficiencies.
Additionally, immersive collaborative VR environments are enabling remote teams to co-create store designs and evaluate prototypes, accelerating decision-making. With growing advancements in cloud-based VR solutions and real-time rendering, the Planning & Designing segment continues to shape retail innovation, making store planning more cost-effective, scalable, and data-driven.
The Advertising & Marketing segment is expected to grow at the highest CAGR of 27.3%, fueled by increasing retailer demand for immersive brand experiences, virtual product showcases, and interactive ad campaigns. VR marketing allows businesses to create engaging storytelling experiences, enabling customers to interact with products before purchasing. Retailers are utilizing VR pop-up stores, 360-degree ad placements, and AI-driven personalized experiences to capture consumer attention in a crowded digital space. Advancements in eye-tracking and behavioral analytics allow businesses to measure customer interactions with VR ads, optimizing ad placements and content strategy. Luxury brands, e-commerce giants, and automotive retailers are increasingly investing in virtual reality advertising to differentiate themselves from competitors.
By Vertical
The Food & Beverage (F&B) segment held the largest revenue share of 36% in 2023, driven by the increasing adoption of VR-powered virtual dining experiences, digital food ordering simulations, and immersive brand storytelling. Restaurants, supermarkets, and food manufacturers are leveraging VR to enhance customer engagement through virtual product tastings, 3D menu visualizations, and interactive farm-to-table experiences.
Additionally, virtual restaurant walkthroughs and immersive dining concepts are transforming how customers interact with food brands. Fast-food chains and fine dining establishments are integrating VR-powered training modules for staff to enhance operational efficiency and customer service. The expansion of VR-based personalized nutrition plans and interactive grocery shopping experiences is further fueling market growth.
The Clothing segment is expected to grow at the highest CAGR of 28.0%, driven by the rising demand for virtual try-ons, 3D garment visualization, and interactive fashion experiences. Retailers and fashion brands are deploying AI-powered VR fitting rooms, allowing customers to digitally try on outfits in real time, reducing return rates and enhancing shopping convenience. Innovations in gesture-controlled shopping, body-scanning technology, and digital fashion avatars are transforming the online shopping experience. Luxury brands and fast-fashion retailers are integrating metaverse-based fashion stores, offering exclusive VR fashion previews and interactive runway shows.
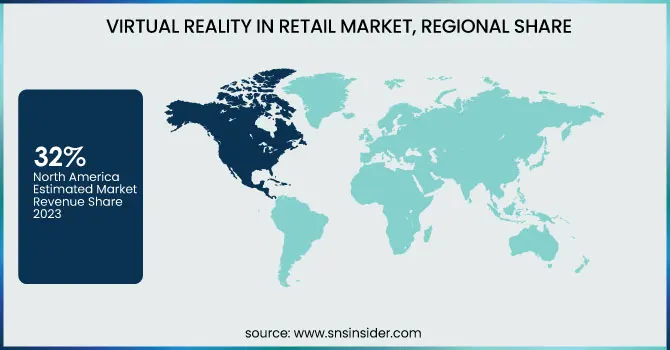
North America held the largest share of 32% in the Virtual Reality Retail Market in 2023, driven by high consumer adoption, technological advancements, and significant investments in immersive retail solutions. The presence of leading VR technology providers and retail giants has accelerated the adoption of virtual storefronts, VR-powered shopping assistants, and AI-integrated virtual try-ons. Major retailers and e-commerce platforms are leveraging high-speed internet, 5G connectivity, and cloud-based VR solutions to enhance online shopping experiences. For instance, luxury fashion brands and home improvement retailers in the U.S. have deployed VR showrooms, allowing customers to explore products in 3D before making a purchase.
Additionally, North America's strong startup ecosystem and venture capital funding for VR innovation continue to fuel market expansion. With rising consumer preference for personalized and immersive shopping experiences, North America remains the dominant region, driving innovation and setting global retail VR trends.
Europe is projected to grow at the Fastest CAGR of 27.5%, fueled by the rapid adoption of VR-based retail experiences, government initiatives for digital transformation, and increasing consumer demand for immersive shopping. Retailers across Europe are investing in VR-powered virtual fitting rooms, interactive product visualizations, and AR-VR hybrid shopping solutions, particularly in the fashion, automotive, and home décor sectors.
For example, fashion retailers in France and Germany have launched VR shopping platforms, allowing customers to browse and try on outfits virtually.
Additionally, sustainability-conscious European brands are utilizing VR-based supply chain transparency tools, enabling consumers to track product sourcing and ethical practices. With increasing consumer engagement in virtual brand experiences and metaverse commerce, Europe is emerging as the fastest-growing region, redefining retail through immersive and innovative VR applications.
Get Customized Report as per Your Business Requirement - Enquiry Now
Visualise Creative Ltd. (VR Retail Experiences, 360-Degree Product Visualizations)
VREI (Virtual Showrooms, VR Product Demos)
Panedia Pty Ltd (Virtual Store Tours, 360-Degree Retail Training Modules)
Fieback Medien (Interactive VR Catalogs, Virtual Retail Environments)
FireBirdVR (GuruVR, SaarthiVR)
FXGear Inc. (FXMirror Virtual Fitting Solution, FXMakeup Virtual Try-On)
Koncept VR (VR Product Launches, Virtual Retail Installations)
Matterport, Inc. (Matterport 3D Capture Platform, Virtual Retail Space Tours)
Subvrsive, Inc. (Immersive Retail Campaigns, VR Brand Experiences)
VIAR (VR Training Simulations, Interactive VR Presentations)
WeMakeVR (Virtual Shopping Experiences, VR Product Demonstrations)
Scapic Innovations Pvt. Ltd. (AR/VR E-commerce Solutions, Virtual Try-On Experiences)
In July 2024, Visualise Creative Ltd. announced a job opening for a Web XR Developer, indicating its ongoing commitment to enhancing virtual reality experiences, which could potentially impact the retail sector.
In July 2023, Panedia Pty Ltd. was highlighted in discussions about the expanding virtual reality content creation market in Asia-Pacific, suggesting their active involvement in VR solutions applicable to various sectors, including retail.
| Report Attributes | Details |
|---|---|
| Market Size in 2023 | USD 3.33 Billion |
| Market Size by 2032 | USD 26.88 Billion |
| CAGR | CAGR of 26.2% From 2024 to 2032 |
| Base Year | 2023 |
| Forecast Period | 2024-2032 |
| Historical Data | 2020-2022 |
| Report Scope & Coverage | Market Size, Segments Analysis, Competitive Landscape, Regional Analysis, DROC & SWOT Analysis, Forecast Outlook |
| Key Segments | • By Component (Hardware, Software, Services) • By Device (Head Mounted Devices, Gesture Tracking Device, Projectors & Display Wall) • By Application (Information Systems, Advertising & Marketing, Try-on Solutions, Planning & Designing) • By Vertical (Food & Beverage, Home Products, Clothing, Consumer Electronics) |
| Regional Analysis/Coverage | North America (US, Canada, Mexico), Europe (Eastern Europe [Poland, Romania, Hungary, Turkey, Rest of Eastern Europe] Western Europe] Germany, France, UK, Italy, Spain, Netherlands, Switzerland, Austria, Rest of Western Europe]), Asia Pacific (China, India, Japan, South Korea, Vietnam, Singapore, Australia, Rest of Asia Pacific), Middle East & Africa (Middle East [UAE, Egypt, Saudi Arabia, Qatar, Rest of Middle East], Africa [Nigeria, South Africa, Rest of Africa], Latin America (Brazil, Argentina, Colombia, Rest of Latin America) |
| Company Profiles | Visualise Creative Ltd., VREI, Panedia Pty Ltd, Fieback Medien, FireBirdVR, FXGear Inc., Koncept VR, Matterport, Inc., Subvrsive, Inc., VIAR, WeMakeVR, Scapic Innovations Pvt. Ltd. |
Ans: The Virtual Reality in Retail Market is expected to grow at a CAGR of 26.2% during 2024-2032.
Ans: The Virtual Reality in Retail Market size was USD 3.33 billion in 2023 and is expected to Reach USD 26.28 billion by 2032.
Ans: The major growth factor of Virtual Reality in the Retail Market is the rising demand for immersive and personalized shopping experiences, driven by advancements in VR technology, AI integration, and increasing e-commerce adoption.
Ans: The Planning & Designing segment dominated the Virtual Reality in Retail Market.
Ans: North America dominated the Virtual Reality in Retail Market in 2023.
1. Introduction
1.1 Market Definition
1.2 Scope (Inclusion and Exclusions)
1.3 Research Assumptions
2. Executive Summary
2.1 Market Overview
2.2 Regional Synopsis
2.3 Competitive Summary
3. Research Methodology
3.1 Top-Down Approach
3.2 Bottom-up Approach
3.3. Data Validation
3.4 Primary Interviews
4. Market Dynamics Impact Analysis
4.1 Market Driving Factors Analysis
4.1.1 Drivers
4.1.2 Restraints
4.1.3 Opportunities
4.1.4 Challenges
4.2 PESTLE Analysis
4.3 Porter’s Five Forces Model
5. Statistical Insights and Trends Reporting
5.1 Investment & Funding Trends, 2023
5.2 Cost Analysis, 2023
5.3 Customer Retention & Engagement Metrics, 2023
5.4 Sustainability Impact
6. Competitive Landscape
6.1 List of Major Companies, By Region
6.2 Market Share Analysis, By Region
6.3 Product Benchmarking
6.3.1 Product specifications and features
6.3.2 Pricing
6.4 Strategic Initiatives
6.4.1 Marketing and promotional activities
6.4.2 Distribution and Supply Chain Strategies
6.4.3 Expansion plans and new product launches
6.4.4 Strategic partnerships and collaborations
6.5 Technological Advancements
6.6 Market Positioning and Branding
7. Virtual Reality in Retail Market Segmentation, By Component
7.1 Chapter Overview
7.2 Hardware
7.2.1 Hardware Market Trends Analysis (2020-2032)
7.2.2 Hardware Market Size Estimates and Forecasts to 2032 (USD Billion)
7.3 Software
7.3.1 Software Market Trends Analysis (2020-2032)
7.3.2 Software Market Size Estimates and Forecasts to 2032 (USD Billion)
7.4 Services
7.4.1 Services Market Trends Analysis (2020-2032)
7.4.2 Services Market Size Estimates and Forecasts to 2032 (USD Billion)
8. Virtual Reality in Retail Market Segmentation, By Device
8.1 Chapter Overview
8.2 Head Mounted Devices
8.2.1 Head-Mounted Devices Market Trends Analysis (2020-2032)
8.2.2 Head-Mounted Devices Market Size Estimates and Forecasts to 2032 (USD Billion)
8.3 Gesture Tracking Device
8.3.1 Gesture Tracking Device Market Trends Analysis (2020-2032)
8.3.2 Gesture Tracking Device Market Size Estimates and Forecasts to 2032 (USD Billion)
8.4 Projectors & Display Wall
8.4.1 Projectors & Display Wall Market Trends Analysis (2020-2032)
8.4.2 Projectors & Display Wall Market Size Estimates and Forecasts to 2032 (USD Billion)
9. Virtual Reality in Retail Market Segmentation, By Application
9.1 Chapter Overview
9.2 Information Systems
9.2.1 Information Systems Market Trends Analysis (2020-2032)
9.2.2 Information Systems Market Size Estimates and Forecasts to 2032 (USD Billion)
9.3 Advertising & Marketing
9.3.1 Advertising & Marketing Market Trends Analysis (2020-2032)
9.3.2 Advertising & Marketing Market Size Estimates and Forecasts to 2032 (USD Billion)
9.4 Try-on Solutions
9.4.1 Try-on Solutions Market Trends Analysis (2020-2032)
9.4.2 Try-on Solutions Market Size Estimates and Forecasts to 2032 (USD Billion)
9.5 Planning & Designing
9.5.1 Planning & Designing Market Trends Analysis (2020-2032)
9.5.2 Planning & Designing Market Size Estimates and Forecasts to 2032 (USD Billion)
10. Virtual Reality in Retail Market Segmentation, By Vertical
10.1 Chapter Overview
10.2 Food & Beverage
10.2.1 Food & Beverage Market Trends Analysis (2020-2032)
10.2.2 Food & Beverage Market Size Estimates and Forecasts to 2032 (USD Billion)
10.3 Home Products
10.3.1 Home Products Market Trends Analysis (2020-2032)
10.3.2 Home Products Market Size Estimates and Forecasts to 2032 (USD Billion)
10.4 Clothing
10.4.1 Clothing Market Trends Analysis (2020-2032)
10.4.2 Clothing Market Size Estimates and Forecasts to 2032 (USD Billion)
10.5 Consumer Electronics
10.5.1 Consumer Electronics Market Trends Analysis (2020-2032)
10.5.2 Consumer Electronics Market Size Estimates and Forecasts to 2032 (USD Billion)
11. Regional Analysis
11.1 Chapter Overview
11.2 North America
11.2.1 Trends Analysis
11.2.2 North America Virtual Reality in Retail Market Estimates and Forecasts, by Country (2020-2032) (USD Billion)
11.2.3 North America Virtual Reality in Retail Market Estimates and Forecasts, By Component (2020-2032) (USD Billion)
11.2.4 North America Virtual Reality in Retail Market Estimates and Forecasts, By Device (2020-2032) (USD Billion)
11.2.5 North America Virtual Reality in Retail Market Estimates and Forecasts, By Application (2020-2032) (USD Billion)
11.2.6 North America Virtual Reality in Retail Market Estimates and Forecasts, By Vertical(2020-2032) (USD Billion)
11.2.7 USA
11.2.7.1 USA Virtual Reality in Retail Market Estimates and Forecasts, By Component (2020-2032) (USD Billion)
11.2.7.2 USA Virtual Reality in Retail Market Estimates and Forecasts, By Device (2020-2032) (USD Billion)
11.2.7.3 USA Virtual Reality in Retail Market Estimates and Forecasts, By Application (2020-2032) (USD Billion)
11.2.7.4 USA Virtual Reality in Retail Market Estimates and Forecasts, By Vertical(2020-2032) (USD Billion)
11.2.8 Canada
11.2.8.1 Canada Virtual Reality in Retail Market Estimates and Forecasts, By Component (2020-2032) (USD Billion)
11.2.8.2 Canada Virtual Reality in Retail Market Estimates and Forecasts, By Device (2020-2032) (USD Billion)
11.2.8.3 Canada Virtual Reality in Retail Market Estimates and Forecasts, By Application (2020-2032) (USD Billion)
11.2.8.4 Canada Virtual Reality in Retail Market Estimates and Forecasts, By Vertical (2020-2032) (USD Billion)
11.2.9 Mexico
11.2.9.1 Mexico Virtual Reality in Retail Market Estimates and Forecasts, By Component (2020-2032) (USD Billion)
11.2.9.2 Mexico Virtual Reality in Retail Market Estimates and Forecasts, By Device (2020-2032) (USD Billion)
11.2.9.3 Mexico Virtual Reality in Retail Market Estimates and Forecasts, By Application (2020-2032) (USD Billion)
11.2.9.4 Mexico Virtual Reality in Retail Market Estimates and Forecasts, By Vertical (2020-2032) (USD Billion)
11.3 Europe
11.3.1 Eastern Europe
11.3.1.1 Trends Analysis
11.3.1.2 Eastern Europe Virtual Reality in Retail Market Estimates and Forecasts, by Country (2020-2032) (USD Billion)
11.3.1.3 Eastern Europe Virtual Reality in Retail Market Estimates and Forecasts, By Component (2020-2032) (USD Billion)
11.3.1.4 Eastern Europe Virtual Reality in Retail Market Estimates and Forecasts, By Device (2020-2032) (USD Billion)
11.3.1.5 Eastern Europe Virtual Reality in Retail Market Estimates and Forecasts, By Application (2020-2032) (USD Billion)
11.3.1.6 Eastern Europe Virtual Reality in Retail Market Estimates and Forecasts, By Vertical(2020-2032) (USD Billion)
11.3.1.7 Poland
11.3.1.7.1 Poland Virtual Reality in Retail Market Estimates and Forecasts, By Component (2020-2032) (USD Billion)
11.3.1.7.2 Poland Virtual Reality in Retail Market Estimates and Forecasts, By Device (2020-2032) (USD Billion)
11.3.1.7.3 Poland Virtual Reality in Retail Market Estimates and Forecasts, By Application (2020-2032) (USD Billion)
11.3.1.7.4 Poland Virtual Reality in Retail Market Estimates and Forecasts, By Vertical(2020-2032) (USD Billion)
11.3.1.8 Romania
11.3.1.8.1 Romania Virtual Reality in Retail Market Estimates and Forecasts, By Component (2020-2032) (USD Billion)
11.3.1.8.2 Romania Virtual Reality in Retail Market Estimates and Forecasts, By Device (2020-2032) (USD Billion)
11.3.1.8.3 Romania Virtual Reality in Retail Market Estimates and Forecasts, By Application (2020-2032) (USD Billion)
11.3.1.8.4 Romania Virtual Reality in Retail Market Estimates and Forecasts, By Vertical (2020-2032) (USD Billion)
11.3.1.9 Hungary
11.3.1.9.1 Hungary Virtual Reality in Retail Market Estimates and Forecasts, By Component (2020-2032) (USD Billion)
11.3.1.9.2 Hungary Virtual Reality in Retail Market Estimates and Forecasts, By Device (2020-2032) (USD Billion)
11.3.1.9.3 Hungary Virtual Reality in Retail Market Estimates and Forecasts, By Application (2020-2032) (USD Billion)
11.3.1.9.4 Hungary Virtual Reality in Retail Market Estimates and Forecasts, By Vertical (2020-2032) (USD Billion)
11.3.1.10 Turkey
11.3.1.10.1 Turkey Virtual Reality in Retail Market Estimates and Forecasts, By Component (2020-2032) (USD Billion)
11.3.1.10.2 Turkey Virtual Reality in Retail Market Estimates and Forecasts, By Device (2020-2032) (USD Billion)
11.3.1.10.3 Turkey Virtual Reality in Retail Market Estimates and Forecasts, By Application (2020-2032) (USD Billion)
11.3.1.10.4 Turkey Virtual Reality in Retail Market Estimates and Forecasts, By Vertical (2020-2032) (USD Billion)
11.3.1.11 Rest of Eastern Europe
11.3.1.11.1 Rest of Eastern Europe Virtual Reality in Retail Market Estimates and Forecasts, By Component (2020-2032) (USD Billion)
11.3.1.11.2 Rest of Eastern Europe Virtual Reality in Retail Market Estimates and Forecasts, By Device (2020-2032) (USD Billion)
11.3.1.11.3 Rest of Eastern Europe Virtual Reality in Retail Market Estimates and Forecasts, By Application (2020-2032) (USD Billion)
11.3.1.11.4 Rest of Eastern Europe Virtual Reality in Retail Market Estimates and Forecasts, By Vertical (2020-2032) (USD Billion)
11.3.2 Western Europe
11.3.2.1 Trends Analysis
11.3.2.2 Western Europe Virtual Reality in Retail Market Estimates and Forecasts, by Country (2020-2032) (USD Billion)
11.3.2.3 Western Europe Virtual Reality in Retail Market Estimates and Forecasts, By Component (2020-2032) (USD Billion)
11.3.2.4 Western Europe Virtual Reality in Retail Market Estimates and Forecasts, By Device (2020-2032) (USD Billion)
11.3.2.5 Western Europe Virtual Reality in Retail Market Estimates and Forecasts, By Application (2020-2032) (USD Billion)
11.3.2.6 Western Europe Virtual Reality in Retail Market Estimates and Forecasts, By Vertical (2020-2032) (USD Billion)
11.3.2.7 Germany
11.3.2.7.1 Germany Virtual Reality in Retail Market Estimates and Forecasts, By Component (2020-2032) (USD Billion)
11.3.2.7.2 Germany Virtual Reality in Retail Market Estimates and Forecasts, By Device (2020-2032) (USD Billion)
11.3.2.7.3 Germany Virtual Reality in Retail Market Estimates and Forecasts, By Application (2020-2032) (USD Billion)
11.3.2.7.4 Germany Virtual Reality in Retail Market Estimates and Forecasts, By Vertical (2020-2032) (USD Billion)
11.3.2.8 France
11.3.2.8.1 France Virtual Reality in Retail Market Estimates and Forecasts, By Component (2020-2032) (USD Billion)
11.3.2.8.2 France Virtual Reality in Retail Market Estimates and Forecasts, By Device (2020-2032) (USD Billion)
11.3.2.8.3 France Virtual Reality in Retail Market Estimates and Forecasts, By Application (2020-2032) (USD Billion)
11.3.2.8.4 France Virtual Reality in Retail Market Estimates and Forecasts, By Vertical (2020-2032) (USD Billion)
11.3.2.9 UK
11.3.2.9.1 UK Virtual Reality in Retail Market Estimates and Forecasts, By Component (2020-2032) (USD Billion)
11.3.2.9.2 UK Virtual Reality in Retail Market Estimates and Forecasts, By Device (2020-2032) (USD Billion)
11.3.2.9.3 UK Virtual Reality in Retail Market Estimates and Forecasts, By Application (2020-2032) (USD Billion)
11.3.2.9.4 UK Virtual Reality in Retail Market Estimates and Forecasts, By Vertical (2020-2032) (USD Billion)
11.3.2.10 Italy
11.3.2.10.1 Italy Virtual Reality in Retail Market Estimates and Forecasts, By Component (2020-2032) (USD Billion)
11.3.2.10.2 Italy Virtual Reality in Retail Market Estimates and Forecasts, By Device (2020-2032) (USD Billion)
11.3.2.10.3 Italy Virtual Reality in Retail Market Estimates and Forecasts, By Application (2020-2032) (USD Billion)
11.3.2.10.4 Italy Virtual Reality in Retail Market Estimates and Forecasts, By Vertical (2020-2032) (USD Billion)
11.3.2.11 Spain
11.3.2.11.1 Spain Virtual Reality in Retail Market Estimates and Forecasts, By Component (2020-2032) (USD Billion)
11.3.2.11.2 Spain Virtual Reality in Retail Market Estimates and Forecasts, By Device (2020-2032) (USD Billion)
11.3.2.11.3 Spain Virtual Reality in Retail Market Estimates and Forecasts, By Application (2020-2032) (USD Billion)
11.3.2.11.4 Spain Virtual Reality in Retail Market Estimates and Forecasts, By Vertical (2020-2032) (USD Billion)
11.3.2.12 Netherlands
11.3.2.12.1 Netherlands Virtual Reality in Retail Market Estimates and Forecasts, By Component (2020-2032) (USD Billion)
11.3.2.12.2 Netherlands Virtual Reality in Retail Market Estimates and Forecasts, By Device (2020-2032) (USD Billion)
11.3.2.12.3 Netherlands Virtual Reality in Retail Market Estimates and Forecasts, By Application (2020-2032) (USD Billion)
11.3.2.12.4 Netherlands Virtual Reality in Retail Market Estimates and Forecasts, By Vertical (2020-2032) (USD Billion)
11.3.2.13 Switzerland
11.3.2.13.1 Switzerland Virtual Reality in Retail Market Estimates and Forecasts, By Component (2020-2032) (USD Billion)
11.3.2.13.2 Switzerland Virtual Reality in Retail Market Estimates and Forecasts, By Device (2020-2032) (USD Billion)
11.3.2.13.3 Switzerland Virtual Reality in Retail Market Estimates and Forecasts, By Application (2020-2032) (USD Billion)
11.3.2.13.4 Switzerland Virtual Reality in Retail Market Estimates and Forecasts, By Vertical (2020-2032) (USD Billion)
11.3.2.14 Austria
11.3.2.14.1 Austria Virtual Reality in Retail Market Estimates and Forecasts, By Component (2020-2032) (USD Billion)
11.3.2.14.2 Austria Virtual Reality in Retail Market Estimates and Forecasts, By Device (2020-2032) (USD Billion)
11.3.2.14.3 Austria Virtual Reality in Retail Market Estimates and Forecasts, By Application (2020-2032) (USD Billion)
11.3.2.14.4 Austria Virtual Reality in Retail Market Estimates and Forecasts, By Vertical (2020-2032) (USD Billion)
11.3.2.15 Rest of Western Europe
11.3.2.15.1 Rest of Western Europe Virtual Reality in Retail Market Estimates and Forecasts, By Component (2020-2032) (USD Billion)
11.3.2.15.2 Rest of Western Europe Virtual Reality in Retail Market Estimates and Forecasts, By Device (2020-2032) (USD Billion)
11.3.2.15.3 Rest of Western Europe Virtual Reality in Retail Market Estimates and Forecasts, By Application (2020-2032) (USD Billion)
11.3.2.15.4 Rest of Western Europe Virtual Reality in Retail Market Estimates and Forecasts, By Vertical (2020-2032) (USD Billion)
11.4 Asia Pacific
11.4.1 Trends Analysis
11.4.2 Asia Pacific Virtual Reality in Retail Market Estimates and Forecasts, by Country (2020-2032) (USD Billion)
11.4.3 Asia Pacific Virtual Reality in Retail Market Estimates and Forecasts, By Component (2020-2032) (USD Billion)
11.4.4 Asia Pacific Virtual Reality in Retail Market Estimates and Forecasts, By Device (2020-2032) (USD Billion)
11.4.5 Asia Pacific Virtual Reality in Retail Market Estimates and Forecasts, By Application (2020-2032) (USD Billion)
11.4.6 Asia Pacific Virtual Reality in Retail Market Estimates and Forecasts, By Vertical (2020-2032) (USD Billion)
11.4.7 China
11.4.7.1 China Virtual Reality in Retail Market Estimates and Forecasts, By Component (2020-2032) (USD Billion)
11.4.7.2 China Virtual Reality in Retail Market Estimates and Forecasts, By Device (2020-2032) (USD Billion)
11.4.7.3 China Virtual Reality in Retail Market Estimates and Forecasts, By Application (2020-2032) (USD Billion)
11.4.7.4 China Virtual Reality in Retail Market Estimates and Forecasts, By Vertical (2020-2032) (USD Billion)
11.4.8 India
11.4.8.1 India Virtual Reality in Retail Market Estimates and Forecasts, By Component (2020-2032) (USD Billion)
11.4.8.2 India Virtual Reality in Retail Market Estimates and Forecasts, By Device (2020-2032) (USD Billion)
11.4.8.3 India Virtual Reality in Retail Market Estimates and Forecasts, By Application (2020-2032) (USD Billion)
11.4.8.4 India Virtual Reality in Retail Market Estimates and Forecasts, By Vertical (2020-2032) (USD Billion)
11.4.9 Japan
11.4.9.1 Japan Virtual Reality in Retail Market Estimates and Forecasts, By Component (2020-2032) (USD Billion)
11.4.9.2 Japan Virtual Reality in Retail Market Estimates and Forecasts, By Device (2020-2032) (USD Billion)
11.4.9.3 Japan Virtual Reality in Retail Market Estimates and Forecasts, By Application (2020-2032) (USD Billion)
11.4.9.4 Japan Virtual Reality in Retail Market Estimates and Forecasts, By Vertical (2020-2032) (USD Billion)
11.4.10 South Korea
11.4.10.1 South Korea Virtual Reality in Retail Market Estimates and Forecasts, By Component (2020-2032) (USD Billion)
11.4.10.2 South Korea Virtual Reality in Retail Market Estimates and Forecasts, By Device (2020-2032) (USD Billion)
11.4.10.3 South Korea Virtual Reality in Retail Market Estimates and Forecasts, By Application (2020-2032) (USD Billion)
11.4.10.4 South Korea Virtual Reality in Retail Market Estimates and Forecasts, By Vertical (2020-2032) (USD Billion)
11.4.11 Vietnam
11.4.11.1 Vietnam Virtual Reality in Retail Market Estimates and Forecasts, By Component (2020-2032) (USD Billion)
11.4.11.2 Vietnam Virtual Reality in Retail Market Estimates and Forecasts, By Device (2020-2032) (USD Billion)
11.4.11.3 Vietnam Virtual Reality in Retail Market Estimates and Forecasts, By Application (2020-2032) (USD Billion)
11.4.11.4 Vietnam Virtual Reality in Retail Market Estimates and Forecasts, By Vertical (2020-2032) (USD Billion)
11.4.12 Singapore
11.4.12.1 Singapore Virtual Reality in Retail Market Estimates and Forecasts, By Component (2020-2032) (USD Billion)
11.4.12.2 Singapore Virtual Reality in Retail Market Estimates and Forecasts, By Device (2020-2032) (USD Billion)
11.4.12.3 Singapore Virtual Reality in Retail Market Estimates and Forecasts, By Application (2020-2032) (USD Billion)
11.4.12.4 Singapore Virtual Reality in Retail Market Estimates and Forecasts, By Vertical (2020-2032) (USD Billion)
11.4.13 Australia
11.4.13.1 Australia Virtual Reality in Retail Market Estimates and Forecasts, By Component (2020-2032) (USD Billion)
11.4.13.2 Australia Virtual Reality in Retail Market Estimates and Forecasts, By Device (2020-2032) (USD Billion)
11.4.13.3 Australia Virtual Reality in Retail Market Estimates and Forecasts, By Application (2020-2032) (USD Billion)
11.4.13.4 Australia Virtual Reality in Retail Market Estimates and Forecasts, By Vertical (2020-2032) (USD Billion)
11.4.14 Rest of Asia Pacific
11.4.14.1 Rest of Asia Pacific Virtual Reality in Retail Market Estimates and Forecasts, By Component (2020-2032) (USD Billion)
11.4.14.2 Rest of Asia Pacific Virtual Reality in Retail Market Estimates and Forecasts, By Device (2020-2032) (USD Billion)
11.4.14.3 Rest of Asia Pacific Virtual Reality in Retail Market Estimates and Forecasts, By Application (2020-2032) (USD Billion)
11.4.14.4 Rest of Asia Pacific Virtual Reality in Retail Market Estimates and Forecasts, By Vertical (2020-2032) (USD Billion)
11.5 Middle East and Africa
11.5.1 Middle East
11.5.1.1 Trends Analysis
11.5.1.2 Middle East Virtual Reality in Retail Market Estimates and Forecasts, by Country (2020-2032) (USD Billion)
11.5.1.3 Middle East Virtual Reality in Retail Market Estimates and Forecasts, By Component (2020-2032) (USD Billion)
11.5.1.4 Middle East Virtual Reality in Retail Market Estimates and Forecasts, By Device (2020-2032) (USD Billion)
11.5.1.5 Middle East Virtual Reality in Retail Market Estimates and Forecasts, By Application (2020-2032) (USD Billion)
11.5.1.6 Middle East Virtual Reality in Retail Market Estimates and Forecasts, By Vertical (2020-2032) (USD Billion)
11.5.1.7 UAE
11.5.1.7.1 UAE Virtual Reality in Retail Market Estimates and Forecasts, By Component (2020-2032) (USD Billion)
11.5.1.7.2 UAE Virtual Reality in Retail Market Estimates and Forecasts, By Device (2020-2032) (USD Billion)
11.5.1.7.3 UAE Virtual Reality in Retail Market Estimates and Forecasts, By Application (2020-2032) (USD Billion)
11.5.1.7.4 UAE Virtual Reality in Retail Market Estimates and Forecasts, By Vertical (2020-2032) (USD Billion)
11.5.1.8 Egypt
11.5.1.8.1 Egypt Virtual Reality in Retail Market Estimates and Forecasts, By Component (2020-2032) (USD Billion)
11.5.1.8.2 Egypt Virtual Reality in Retail Market Estimates and Forecasts, By Device (2020-2032) (USD Billion)
11.5.1.8.3 Egypt Virtual Reality in Retail Market Estimates and Forecasts, By Application (2020-2032) (USD Billion)
11.5.1.8.4 Egypt Virtual Reality in Retail Market Estimates and Forecasts, By Vertical (2020-2032) (USD Billion)
11.5.1.9 Saudi Arabia
11.5.1.9.1 Saudi Arabia Virtual Reality in Retail Market Estimates and Forecasts, By Component (2020-2032) (USD Billion)
11.5.1.9.2 Saudi Arabia Virtual Reality in Retail Market Estimates and Forecasts, By Device (2020-2032) (USD Billion)
11.5.1.9.3 Saudi Arabia Virtual Reality in Retail Market Estimates and Forecasts, By Application (2020-2032) (USD Billion)
11.5.1.9.4 Saudi Arabia Virtual Reality in Retail Market Estimates and Forecasts, By Vertical (2020-2032) (USD Billion)
11.5.1.10 Qatar
11.5.1.10.1 Qatar Virtual Reality in Retail Market Estimates and Forecasts, By Component (2020-2032) (USD Billion)
11.5.1.10.2 Qatar Virtual Reality in Retail Market Estimates and Forecasts, By Device (2020-2032) (USD Billion)
11.5.1.10.3 Qatar Virtual Reality in Retail Market Estimates and Forecasts, By Application (2020-2032) (USD Billion)
11.5.1.10.4 Qatar Virtual Reality in Retail Market Estimates and Forecasts, By Vertical (2020-2032) (USD Billion)
11.5.1.11 Rest of Middle East
11.5.1.11.1 Rest of Middle East Virtual Reality in Retail Market Estimates and Forecasts, By Component (2020-2032) (USD Billion)
11.5.1.11.2 Rest of Middle East Virtual Reality in Retail Market Estimates and Forecasts, By Device (2020-2032) (USD Billion)
11.5.1.11.3 Rest of Middle East Virtual Reality in Retail Market Estimates and Forecasts, By Application (2020-2032) (USD Billion)
11.5.1.11.4 Rest of Middle East Virtual Reality in Retail Market Estimates and Forecasts, By Vertical (2020-2032) (USD Billion)
11.5.2 Africa
11.5.2.1 Trends Analysis
11.5.2.2 Africa Virtual Reality in Retail Market Estimates and Forecasts, by Country (2020-2032) (USD Billion)
11.5.2.3 Africa Virtual Reality in Retail Market Estimates and Forecasts, By Component (2020-2032) (USD Billion)
11.5.2.4 Africa Virtual Reality in Retail Market Estimates and Forecasts, By Device (2020-2032) (USD Billion)
11.5.2.5 Africa Virtual Reality in Retail Market Estimates and Forecasts, By Application (2020-2032) (USD Billion)
11.5.2.6 Africa Virtual Reality in Retail Market Estimates and Forecasts, By Vertical (2020-2032) (USD Billion)
11.5.2.7 South Africa
11.5.2.7.1 South Africa Virtual Reality in Retail Market Estimates and Forecasts, By Component (2020-2032) (USD Billion)
11.5.2.7.2 South Africa Virtual Reality in Retail Market Estimates and Forecasts, By Device (2020-2032) (USD Billion)
11.5.2.7.3 South Africa Virtual Reality in Retail Market Estimates and Forecasts, By Application (2020-2032) (USD Billion)
11.5.2.7.4 South Africa Virtual Reality in Retail Market Estimates and Forecasts, By Vertical (2020-2032) (USD Billion)
11.5.2.8 Nigeria
11.5.2.8.1 Nigeria Virtual Reality in Retail Market Estimates and Forecasts, By Component (2020-2032) (USD Billion)
11.5.2.8.2 Nigeria Virtual Reality in Retail Market Estimates and Forecasts, By Device (2020-2032) (USD Billion)
11.5.2.8.3 Nigeria Virtual Reality in Retail Market Estimates and Forecasts, By Application (2020-2032) (USD Billion)
11.5.2.8.4 Nigeria Virtual Reality in Retail Market Estimates and Forecasts, By Vertical (2020-2032) (USD Billion)
11.5.2.9 Rest of Africa
11.5.2.9.1 Rest of Africa Virtual Reality in Retail Market Estimates and Forecasts, By Component (2020-2032) (USD Billion)
11.5.2.9.2 Rest of Africa Virtual Reality in Retail Market Estimates and Forecasts, By Device (2020-2032) (USD Billion)
11.5.2.9.3 Rest of Africa Virtual Reality in Retail Market Estimates and Forecasts, By Application (2020-2032) (USD Billion)
11.5.2.9.4 Rest of Africa Virtual Reality in Retail Market Estimates and Forecasts, By Vertical (2020-2032) (USD Billion)
11.6 Latin America
11.6.1 Trends Analysis
11.6.2 Latin America Virtual Reality in Retail Market Estimates and Forecasts, by Country (2020-2032) (USD Billion)
11.6.3 Latin America Virtual Reality in Retail Market Estimates and Forecasts, By Component (2020-2032) (USD Billion)
11.6.4 Latin America Virtual Reality in Retail Market Estimates and Forecasts, By Device (2020-2032) (USD Billion)
11.6.5 Latin America Virtual Reality in Retail Market Estimates and Forecasts, By Application (2020-2032) (USD Billion)
11.6.6 Latin America Virtual Reality in Retail Market Estimates and Forecasts, By Vertical (2020-2032) (USD Billion)
11.6.7 Brazil
11.6.7.1 Brazil Virtual Reality in Retail Market Estimates and Forecasts, By Component (2020-2032) (USD Billion)
11.6.7.2 Brazil Virtual Reality in Retail Market Estimates and Forecasts, By Device (2020-2032) (USD Billion)
11.6.7.3 Brazil Virtual Reality in Retail Market Estimates and Forecasts, By Application (2020-2032) (USD Billion)
11.6.7.4 Brazil Virtual Reality in Retail Market Estimates and Forecasts, By Vertical (2020-2032) (USD Billion)
11.6.8 Argentina
11.6.8.1 Argentina Virtual Reality in Retail Market Estimates and Forecasts, By Component (2020-2032) (USD Billion)
11.6.8.2 Argentina Virtual Reality in Retail Market Estimates and Forecasts, By Device (2020-2032) (USD Billion)
11.6.8.3 Argentina Virtual Reality in Retail Market Estimates and Forecasts, By Application (2020-2032) (USD Billion)
11.6.8.4 Argentina Virtual Reality in Retail Market Estimates and Forecasts, By Vertical (2020-2032) (USD Billion)
11.6.9 Colombia
11.6.9.1 Colombia Virtual Reality in Retail Market Estimates and Forecasts, By Component (2020-2032) (USD Billion)
11.6.9.2 Colombia Virtual Reality in Retail Market Estimates and Forecasts, By Device (2020-2032) (USD Billion)
11.6.9.3 Colombia Virtual Reality in Retail Market Estimates and Forecasts, By Application (2020-2032) (USD Billion)
11.6.9.4 Colombia Virtual Reality in Retail Market Estimates and Forecasts, By Vertical (2020-2032) (USD Billion)
11.6.10 Rest of Latin America
11.6.10.1 Rest of Latin America Virtual Reality in Retail Market Estimates and Forecasts, By Component (2020-2032) (USD Billion)
11.6.10.2 Rest of Latin America Virtual Reality in Retail Market Estimates and Forecasts, By Device (2020-2032) (USD Billion)
11.6.10.3 Rest of Latin America Virtual Reality in Retail Market Estimates and Forecasts, By Application (2020-2032) (USD Billion)
11.6.10.4 Rest of Latin America Virtual Reality in Retail Market Estimates and Forecasts, By Vertical (2020-2032) (USD Billion)
12. Company Profiles
12.1 Visualise Creative Ltd.
12.1.1 Company Overview
12.1.2 Financial
12.1.3 Products/ Services Offered
12.1.4 SWOT Analysis
12.2 VREI
12.2.1 Company Overview
12.2.2 Financial
12.2.3 Products/ Services Offered
12.2.4 SWOT Analysis
12.3 Panedia Pty Ltd
12.3.1 Company Overview
12.3.2 Financial
12.3.3 Products/ Services Offered
12.3.4 SWOT Analysis
12.4 Fieback Medien
12.4.1 Company Overview
12.4.2 Financial
12.4.3 Products/ Services Offered
12.4.4 SWOT Analysis
12.5 FireBirdVR
12.5.1 Company Overview
12.5.2 Financial
12.5.3 Products/ Services Offered
12.5.4 SWOT Analysis
12.6 FXGear Inc.
12.6.1 Company Overview
12.6.2 Financial
12.6.3 Products/ Services Offered
12.6.4 SWOT Analysis
12.7 Koncept VR
12.7.1 Company Overview
12.7.2 Financial
12.7.3 Products/ Services Offered
12.7.4 SWOT Analysis
12.8 Matterport, Inc.
12.8.1 Company Overview
12.8.2 Financial
12.8.3 Products/ Services Offered
12.8.4 SWOT Analysis
12.9 Subvrsive, Inc.
12.9.1 Company Overview
12.9.2 Financial
12.9.3 Products/ Services Offered
12.9.4 SWOT Analysis
12.10 VIAR
12.10.1 Company Overview
12.10.2 Financial
12.10.3 Products/ Services Offered
12.10.4 SWOT Analysis
13. Use Cases and Best Practices
14. Conclusion
An accurate research report requires proper strategizing as well as implementation. There are multiple factors involved in the completion of good and accurate research report and selecting the best methodology to compete the research is the toughest part. Since the research reports we provide play a crucial role in any company’s decision-making process, therefore we at SNS Insider always believe that we should choose the best method which gives us results closer to reality. This allows us to reach at a stage wherein we can provide our clients best and accurate investment to output ratio.
Each report that we prepare takes a timeframe of 350-400 business hours for production. Starting from the selection of titles through a couple of in-depth brain storming session to the final QC process before uploading our titles on our website we dedicate around 350 working hours. The titles are selected based on their current market cap and the foreseen CAGR and growth.
The 5 steps process:
Step 1: Secondary Research:
Secondary Research or Desk Research is as the name suggests is a research process wherein, we collect data through the readily available information. In this process we use various paid and unpaid databases which our team has access to and gather data through the same. This includes examining of listed companies’ annual reports, Journals, SEC filling etc. Apart from this our team has access to various associations across the globe across different industries. Lastly, we have exchange relationships with various university as well as individual libraries.

Step 2: Primary Research
When we talk about primary research, it is a type of study in which the researchers collect relevant data samples directly, rather than relying on previously collected data. This type of research is focused on gaining content specific facts that can be sued to solve specific problems. Since the collected data is fresh and first hand therefore it makes the study more accurate and genuine.
We at SNS Insider have divided Primary Research into 2 parts.
Part 1 wherein we interview the KOLs of major players as well as the upcoming ones across various geographic regions. This allows us to have their view over the market scenario and acts as an important tool to come closer to the accurate market numbers. As many as 45 paid and unpaid primary interviews are taken from both the demand and supply side of the industry to make sure we land at an accurate judgement and analysis of the market.
This step involves the triangulation of data wherein our team analyses the interview transcripts, online survey responses and observation of on filed participants. The below mentioned chart should give a better understanding of the part 1 of the primary interview.

Part 2: In this part of primary research the data collected via secondary research and the part 1 of the primary research is validated with the interviews from individual consultants and subject matter experts.
Consultants are those set of people who have at least 12 years of experience and expertise within the industry whereas Subject Matter Experts are those with at least 15 years of experience behind their back within the same space. The data with the help of two main processes i.e., FGDs (Focused Group Discussions) and IDs (Individual Discussions). This gives us a 3rd party nonbiased primary view of the market scenario making it a more dependable one while collation of the data pointers.
Step 3: Data Bank Validation
Once all the information is collected via primary and secondary sources, we run that information for data validation. At our intelligence centre our research heads track a lot of information related to the market which includes the quarterly reports, the daily stock prices, and other relevant information. Our data bank server gets updated every fortnight and that is how the information which we collected using our primary and secondary information is revalidated in real time.

Step 4: QA/QC Process
After all the data collection and validation our team does a final level of quality check and quality assurance to get rid of any unwanted or undesired mistakes. This might include but not limited to getting rid of the any typos, duplication of numbers or missing of any important information. The people involved in this process include technical content writers, research heads and graphics people. Once this process is completed the title gets uploader on our platform for our clients to read it.
Step 5: Final QC/QA Process:
This is the last process and comes when the client has ordered the study. In this process a final QA/QC is done before the study is emailed to the client. Since we believe in giving our clients a good experience of our research studies, therefore, to make sure that we do not lack at our end in any way humanly possible we do a final round of quality check and then dispatch the study to the client.
By Component
Hardware
Software
Services
By Device
Head Mounted Devices
Gesture Tracking Device
Projectors & Display Wall
By Application
Information Systems
Advertising & Marketing
Try-on Solutions
Planning & Designing
By Vertical
Food & Beverage
Home Products
Clothing
Consumer Electronics
Request for Segment Customization as per your Business Requirement: Segment Customization Request
Regional Coverage:
North America
US
Canada
Mexico
Europe
Eastern Europe
Poland
Romania
Hungary
Turkey
Rest of Eastern Europe
Western Europe
Germany
France
UK
Italy
Spain
Netherlands
Switzerland
Austria
Rest of Western Europe
Asia Pacific
China
India
Japan
South Korea
Vietnam
Singapore
Australia
Rest of Asia Pacific
Middle East & Africa
Middle East
UAE
Egypt
Saudi Arabia
Qatar
Rest of Middle East
Africa
Nigeria
South Africa
Rest of Africa
Latin America
Brazil
Argentina
Colombia
Rest of Latin America
Request for Country Level Research Report: Country Level Customization Request
Available Customization
With the given market data, SNS Insider offers customization as per the company’s specific needs. The following customization options are available for the report:
Detailed Volume Analysis
Criss-Cross segment analysis (e.g. Product X Application)
Competitive Product Benchmarking
Geographic Analysis
Additional countries in any of the regions
Customized Data Representation
Detailed analysis and profiling of additional market players
The MEMS Gyroscopes Market Size was valued at USD 2.11 Billion in 2023 and is expected to grow at a CAGR of 6.58% to reach USD 3.72 Billion by 2032.
The AI Infrastructure Market Size was valued at USD 36.35 billion in 2023 and is expected to grow at a CAGR of 29.06% to reach USD 360.59 billion by 2032.
The Automotive PCB Market Size was valued at USD 10.50 billion in 2023 and is expected to grow at a CAGR of 5.58% to reach USD 17.08 billion by 2032.
The Integrated Passive Devices Market was valued at USD 1.28 billion in 2023 and is projected to reach USD 2.44 billion by 2032, growing at a CAGR of 7.43% from 2024 to 2032.
Super Hi-Vision Market was valued at USD 920 Million in 2023 and is expected to reach USD 4320 Million by 2032, growing at a CAGR of 18.89% from 2024-2032
The All-Flash Array Market Size was valued at USD 14.59 billion in 2023 and is expected to grow at a CAGR of 19.93% to reach USD 74.62 billion by 2032.

Hi! Click one of our member below to chat on Phone
© 2025 All Rights Reserved by SNS Insider Pvt Ltd


