Virtual Prototype Market Report Scope & Overview:
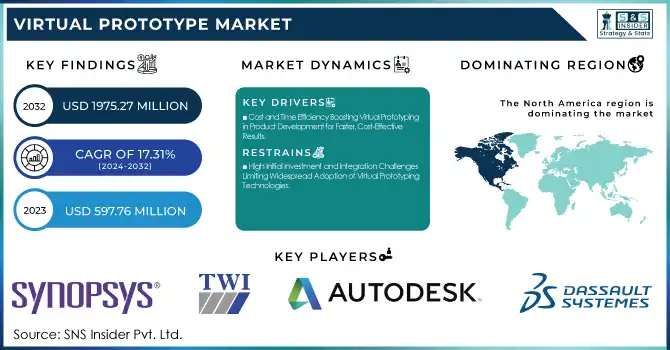
The Virtual Prototype Market was valued at USD 597.76 million in 2023 and is expected to reach USD 1975.27 million by 2032, growing at a CAGR of 17.31% from 2024-2032. The market's adoption rate is increasing as industries seek cost-effective ways to enhance product development processes. Investment trends show a shift toward advanced simulation technologies to streamline operations. Cost savings are a major driver, with virtual prototypes reducing the need for physical models and prototypes. As a result, customer satisfaction is improving due to faster, more accurate product iterations and enhanced design accuracy.
To Get more information on Virtual Prototype Market - Request Free Sample Report
Virtual Prototype Market Dynamics
Drivers
-
Cost and Time Efficiency Boosting Virtual Prototyping in Product Development for Faster, Cost-Effective Results
Saving time and money required for physical models and large amounts of testing, virtual prototypes effectively reduced time and expenses involved in the product development process. Since they enable designers and manufacturers to test and adjust their ideas in a virtual format, they are able to make rapid design changes without the use of expensive materials or production of physical prototypes. This not only speeds up development cycles but also allows teams to allocate resources more efficiently, ultimately leading to increased productivity and less waste. The capacity to simulate different conditions and product functionalities virtually means that companies can provide high-quality products sooner and at a lower price, and virtual prototyping is an essential tool in today's competitive marketplaces.
Restraints
-
High Initial Investment and Integration Challenges Limiting Widespread Adoption of Virtual Prototyping Technologies
The large up-front costs involved with sophisticated simulation hardware and software are a big limitation for most firms. Virtual prototyping is done with specialized software, high-power computing hardware, and highly qualified experts, making it expensive for small- to medium-sized organizations. The issue is further that firms must learn to integrate the technologies into current processes, sometimes involving heavy training and considerable lead time to come up to speed. The recurring requirement of software updates, maintenance, and staff training also contributes to the cost. This pairing of high initial costs and complexity of integration may discourage some organizations from adopting virtual prototyping fully, slowing its general adoption in the long run despite cost savings and efficiency benefits.
Opportunities
-
Emerging Technologies and Digital Transformation Driving Growth Opportunities in Virtual Prototyping Across Diverse Industries
The integration of machine learning and AI in virtual prototyping has the potential to highly improve predictive analytics and design optimization, which makes it possible to develop smarter, more efficient prototypes. Growing demands for bespoke solutions in industries have created prospects for virtual prototyping, which facilitates rapid and easy changes in line with customer-specific requirements. Broader uses in various fields such as healthcare, robotics, and consumer electronics also offer opportunities for growth. Furthermore, incorporating IoT provides real-time data feedback, yet another enhancement in prototype testing and iteration. As the world considers sustainability, virtual prototyping comes in as a green solution, saving on material wastage. Additionally, the widespread digital revolution across sectors brings with it an ideal match in virtual prototyping, fueling uptake and innovation in the industry.
Challenges
-
Data Security, High Costs, and Integration Challenges Hindering Widespread Adoption of Virtual Prototyping Technologies
Virtual prototyping involves the use of sensitive data, which raises concerns over cybersecurity risks and intellectual property protection. The significant initial investment required for advanced software, hardware, and skilled personnel can also pose a challenge, particularly for smaller companies. Furthermore, integrating virtual prototyping into existing workflows often demands substantial time, resources, and training, complicating adoption. The absence of standardized processes across industries might cause compatibility problems, hindering easy collaboration. Further, in some industries, there may be less understanding of the technology and its adoption can be delayed for large-scale application. Lastly, overdependence on digital tools and systems poses the risk of being disrupted during system downtime or technical breakdowns, adding to the market's potential for growth hurdles.
Virtual Prototype Market Segment Analysis
By Deployment
The Cloud segment led the Virtual Prototype Market with the largest revenue share of approximately 66% in 2023 based on its flexibility, scalability, and affordability. Cloud-based products allow businesses to leverage high-performance computing capabilities at a low cost of entry, making them perfect for small, medium, and large businesses alike. Remote storage and processing of large volumes of data improve global team collaboration, while periodic maintenance and updates minimize operational expenses and provide state-of-the-art technology.
The On-premise segment is anticipated to expand at the fastest CAGR of approximately 15.72% during 2024-2032 due to the growing importance of data security and control over proprietary designs among companies. On-premise solutions provide companies with complete ownership of their infrastructure, lowering the risk of data privacy and cybersecurity threats. Since industries like defense and aerospace demand strict adherence to regulatory standards, on-premise virtual prototyping offers a more secure and compliant platform for sensitive projects.
By Vertical
The Automotive segment led the Virtual Prototype Market with the largest revenue share of nearly 33% in 2023 because the automotive industry is witnessing increasing demand for quick design cycles and testing. Virtual prototyping enables manufacturers to optimize vehicle design, increase performance, and minimize time-to-market without incurring expensive physical prototypes. With advancements in electric vehicles and autonomous driving technology, virtual prototyping aids the creation of intricate systems and fuels innovation in the automotive industry.
The Consumer Electronics segment will have the fastest CAGR of around 16.79% from 2024-2032 due to sustained growth in demand for innovative and customized electronic devices. Virtual prototyping facilitates fast development, testing, and refinement of new consumer electronics products at lower cost and time with guaranteed high-quality designs. The rising focus on product customization, lightweight materials, and sophisticated features in consumer electronics demands more efficient prototyping processes, driving market growth.
By Tools
The Computer-Aided Design (CAD) segment led the Virtual Prototype Market with the largest revenue share of approximately 34% in 2023 because of its central function in product design and development. CAD software allows designers to design precise 3D models, making it critical for creating accurate virtual prototypes. The extensive use of CAD in numerous industries, such as automotive, aerospace, and consumer electronics, propels its leadership. CAD's capability to reduce design iterations and enhance product quality plays a major role in its market dominance.
The Computer-Aided Manufacturing (CAM) segment will witness the fastest CAGR of approximately 16.08% during 2024-2032 as industries remain focused on automation and accuracy in manufacturing. CAM software is combined with CAD systems, enhancing the production process by automating machining, 3D printing, and CNC operations. With manufacturers looking for more effective, economical, and precise manufacturing processes, the use of CAM technology is growing at a very fast pace, propelling its robust growth in the virtual prototyping market.
Regional Analysis
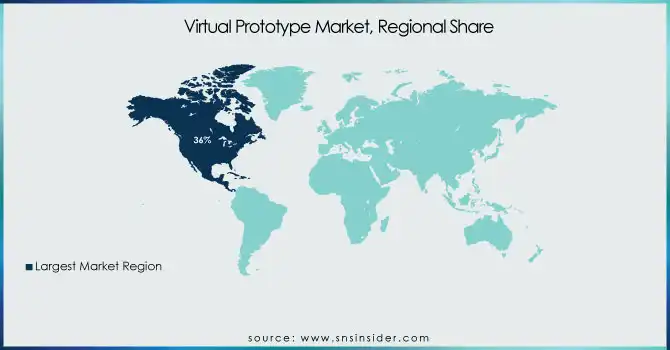
North America led the Virtual Prototype Market with the largest revenue share of around 36% in 2023 because it has a dominant presence of industries with high levels of technology such as automotive, aerospace, and defense. Its high investment in R&D and innovation, and early adoption of digital transformation, have fueled extensive adoption of virtual prototyping. North America's mature infrastructure, educated workforce, and presence of leading players all further cement its position as the leader in the virtual prototyping market.
Asia Pacific will grow at the fastest CAGR of approximately 16.58% during 2024-2032 due to rising investments by nations in the region, such as China, Japan, and India, in cutting-edge manufacturing technologies. Rising automotive, electronics, and manufacturing industries in Asia Pacific are boosting demand for virtual prototyping solutions. Moreover, the high rate of digitalization of industries and government support for innovation and infrastructure development also supports the region's high rate of adoption and growth in virtual prototyping technologies.
Get Customized Report as per Your Business Requirement - Enquiry Now
Key Players
-
Synopsys, Inc. (DesignWare, Virtualizer)
-
TWI Ltd. (Prototyping Services, Virtual Reality Systems)
-
Autodesk Inc. (Fusion 360, AutoCAD)
-
Carbon Design Systems (Carbon Platform, Carbon Designer)
-
ESI Group (Virtual Performance Solution, Visual-Environment)
-
Arm Limited (Cortex-M Processor, Arm Development Studio)
-
Cadence Design Systems, Inc. (PSpice, Virtuoso)
-
Siemens (NX, Teamcenter)
-
PTC (Creo, Windchill)
-
ENCORE (Virtual Testbench, Simulation Environment)
-
Bentley Systems (MicroStation, OpenRoads Designer)
-
Oracle (Oracle Virtualization, Oracle Cloud)
-
IBM (IBM Cloud, IBM Engineering Lifecycle Management)
-
COMSOL (COMSOL Multiphysics, COMSOL Server)
-
Dassault Systemes (CATIA, DELMIA)
-
MathWorks (MATLAB, Simulink)
-
ANSYS (ANSYS Mechanical, ANSYS Fluent)
-
Altair Engineering (HyperWorks, Altair Smart Learning)
-
NVIDIA (CUDA, NVIDIA DRIVE)
-
Magillem (Magillem Designer, Virtual Prototyping)
-
Imperas Software Ltd. (Virtual Platform SDK, OVPsim)
-
Agilent Technologies (Advanced Design System, PathWave)
-
Imagination Technologies (PowerVR, MIPS)
-
Qualcomm (Snapdragon, QDSP)
-
Mentor Graphics (Calibre, Questa)
Recent Developments:
-
In September 2024, Synopsys launched the ImSym Imaging System Simulator, a virtual prototyping platform designed to accelerate the development of imaging systems by integrating lenses, sensors, and image signal processors.
-
In January 2025, NVIDIA unveiled its Cosmos platform at CES, designed to advance "physical AI" by simulating real-world scenarios for robots and autonomous vehicles, enhancing AI decision-making through synthetic data.
| Report Attributes | Details |
|---|---|
| Market Size in 2023 | USD 597.76 Million |
| Market Size by 2032 | USD 1975.27 Million |
| CAGR | CAGR of 14.26% From 2024 to 2032 |
| Base Year | 2023 |
| Forecast Period | 2024-2032 |
| Historical Data | 2020-2022 |
| Report Scope & Coverage | Market Size, Segments Analysis, Competitive Landscape, Regional Analysis, DROC & SWOT Analysis, Forecast Outlook |
| Key Segments | • By Tool (Computer Aided Design (CAD), Computer Aided Engineering (CAE), Computer Aided Manufacturing (CAM), Computational Fluid Dynamics (CFD), Finite Element Analysis (FEA)) • By Deployment (On-premise, Cloud) • By Vertical (Aerospace, Automotive, Healthcare, Consumer Electronics, Telecom, Others) |
| Regional Analysis/Coverage | North America (US, Canada, Mexico), Europe (Eastern Europe [Poland, Romania, Hungary, Turkey, Rest of Eastern Europe] Western Europe] Germany, France, UK, Italy, Spain, Netherlands, Switzerland, Austria, Rest of Western Europe]), Asia Pacific (China, India, Japan, South Korea, Vietnam, Singapore, Australia, Rest of Asia Pacific), Middle East & Africa (Middle East [UAE, Egypt, Saudi Arabia, Qatar, Rest of Middle East], Africa [Nigeria, South Africa, Rest of Africa], Latin America (Brazil, Argentina, Colombia, Rest of Latin America) |
| Company Profiles | Synopsys, Inc., TWI Ltd., Autodesk Inc., Carbon Design Systems, ESI Group, Arm Limited, Cadence Design Systems, Inc., Siemens, PTC, ENCORE, Bentley Systems, Oracle, IBM, COMSOL, Dassault Systemes, MathWorks, ANSYS, Altair Engineering, NVIDIA, Magillem, Imperas Software Ltd., Agilent Technologies, Imagination Technologies, Qualcomm, Mentor Graphics. |
