Virtual Influencer Market Report Scope & Overview:
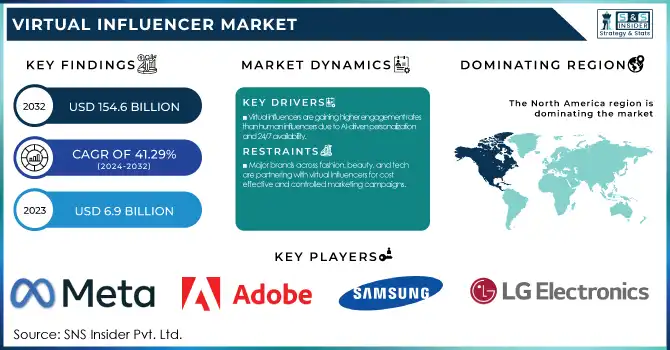
The Virtual Influencer Market was valued at USD 9.75 Billion in 2025E and is expected to reach USD 154.83 Billion by 2033, growing at a CAGR of 41.29% from 2026-2033.
The Virtual Influencer Market is experiencing rapid growth as virtual influencers achieve engagement rates comparable to human influencers, benefiting from controlled narratives, round-the-clock availability, and increasing consumer acceptance. Platform preferences vary regionally, with Instagram and TikTok dominating in Western markets, while WeChat and Douyin lead in Asia. Brand collaborations with virtual influencers have risen significantly from 2020 to 2023, particularly in industries like fashion, beauty, and gaming. Advancements in AI and CGI technologies are further enhancing the realism and interactivity of virtual influencers. The report also explores evolving monetization strategies, regulatory considerations, and the impact of AI-driven personalization on the future of virtual influence.
Virtual Influencer Market Size and Forecast:
-
Market Size in 2025E: USD 9.75 Billion
-
Market Size by 2033: USD 154.83 Billion
-
CAGR: 41.29% from 2026 to 2033
-
Base Year: 2025
-
Forecast Period: 2026–2033
-
Historical Data: 2022–2024
To Get more information on Virtual Influencer Market - Request Free Sample Report
Virtual Influencer Market Highlights:
-
High Engagement and AI Personalization Virtual influencers achieve higher engagement rates than human influencers due to AI-driven personalization, 24/7 availability, and consistent messaging. Brands can see up to 3x more engagement on platforms like Instagram and TikTok compared to human influencers
-
Controlled and Cost-Effective Marketing Global brands in fashion, beauty, gaming, and technology leverage virtual influencers for cost-effective campaigns, ensuring controlled messaging and minimizing risks associated with human influencers
-
Growing Adoption by Major Brands Companies like Prada, Balenciaga, and Samsung are increasingly partnering with virtual influencers, reflecting the shift of the USD 21 billion influencer marketing industry toward digital experiences
-
Advancements in Realism and Emotional Intelligence AI, CGI, and deep learning enhance virtual influencers’ realism, interactive capabilities, and emotional intelligence, enabling them to communicate more naturally with audiences
-
Technological Platforms Enable Creation Tools like Unreal Engine and MetaHuman Creator allow brands to design highly detailed virtual influencers capable of expressing diverse emotions and engaging audiences effectively
-
Expansion Beyond Social Media AI-powered avatars are increasingly being applied in industries such as customer service, gaming, and virtual commerce, creating new opportunities for investment, innovation, and market growth
The U.S. Virtual Influencer market size was valued at an estimated USD 4.25 billion in 2025 and is projected to reach USD 68.90 billion by 2033, growing at a CAGR of 39.8% over the forecast period 2026–2033. Market growth is driven by the rising adoption of virtual influencers across social media, digital advertising, gaming, fashion, and entertainment industries. Brands are increasingly leveraging AI-generated personas to deliver consistent messaging, enhance audience engagement, and reduce risks associated with human influencers. Additionally, advancements in artificial intelligence, computer-generated imagery (CGI), and metaverse platforms, along with growing investments in immersive digital marketing strategies, are significantly accelerating market expansion and strengthening the growth outlook of the U.S. virtual influencer market during the forecast period.
Virtual Influencer Market Drivers:
-
Virtual influencers are gaining higher engagement rates than human influencers due to AI-driven personalization and 24/7 availability.
Virtual influencers are a force to be reckoned with, as virtual influencers allow for fresh storytelling, constant availability, and consistent messaging that you simply cannot get with a human influencer. Audiences have found them interesting, new and sometimes even more relatable with AI-based customization, which has led to higher engagement in this space. According to 2024 research, it discovered that brands could get up to 3x more engagement for the same amount of money when choosing virtual influencers over regular influencers in platforms like Instagram and TikTok. Brands use them for controlled messaging and creative campaigns with little of the risk that can come from using a human influencer. With AI advancements to create more realistic and emotionally engaging, this will lead to rapidly increasing the consumer trust toward virtual influencers, even more in the market.
Virtual Influencer Market Restraints:
-
Major brands across fashion, beauty, and tech are partnering with virtual influencers for cost-effective and controlled marketing campaigns.
Virtual influencers are drawing attention from global brands for marketing, especially in the fashion, beauty, gaming, and technology sectors. Gen Z and millennial marketers have already used virtual influencers in promotional campaigns for brands like Prada, Balenciaga and Samsung. Such personalities powered by AI serve as cost-effective substitutes that allow brands to maintain full control of the content being created and ensure that messages at the respective brands are in harmony. As the social media landscape shifts and the USD 21 billion influencer marketing industry veers toward greater digital experiences and engagement, investments continue to grow toward virtual influencer partnerships. With AI and CGI Technology evolving together, there will be chances for many more brands to include virtual influencers as an aspect of their marketing mix.
Virtual Influencer Market Opportunities:
-
Advancements in AI, CGI, and deep learning are enhancing virtual influencers' realism, emotional intelligence, and interactive capabilities.
AI, CGI, and deep learning technologies are increasingly utilized for hyperscale creation of hyper-talented hyper-real virtual influencers. With the help of advanced animation techniques, voice synthesis from AI-driven personalized voices, and emotional intelligence enhancements, these personalities can now communicate seamlessly and realistically as they interact on screen. platforms like Unreal Engine and MetaHuman Creator have made it easier for brands to create virtual influencers that are highly detailed and can express a myriad of different emotions. With AI-powered avatars eventually gaining real-time interaction capabilities, we will see these applications also used outside social media in other industries such as customer service, gaming, and virtual commerce. This trend is anticipated to lead to more investments and innovation in the market, making them look more realistic and engaging.
Virtual Influencer Market Segment Analysis:
By Type
In 2025, the human avatar segment dominated the market, accounting for the largest revenue share of over 66%. This growth is due to the continuing need in the industry for realistic, relatable virtual influencers and the ability to reach consumers emotionally. Since human avatars are often designed with traits, aesthetics, and qualities that are intended to resonate with target audiences, they become effective tools of brand storytelling and engagement. Moreover, recent technologies, such as AI and CGI, have bettered the avatars for a more genuine experience for consumers to get more faith and dependency on brands, thereby providing lucrative growth for the segment.
The non-human segment is estimated to exhibit the fastest CAGR during the 2026 - 2033. Such demand for unique non-human avatars are leading to rapid growth by offering infinite ways to virtually design avatars in a competitive digital marketplace.
By Offering
The solution segment dominated the market and accounted for the largest revenue share in the virtual influencer market in 2025, due to the growing need for innovative and comprehensive marketing solutions that seamlessly integrate virtual influencers into brand development strategies and plans. The businesses are comparatively understanding the effectiveness of virtual influencers in improving their consumer engagement and efficiency, and hence want to tap the solution providers who can provide the tailored services, ensuring the implementation process is seamless.
The services segment is projected to register a significant CAGR from 2026 -2033 due to the rise in complexity in the management of campaigns related to virtual influencers. Brands are demanding more ROI, which means consulting, analytics, and reporting. These services enable effective creation and management of virtual influencers at scale, while enacting advanced technologies for leveraging audience interaction on multiple channels.
By End-Use
The fashion & lifestyle segment dominated the market and held the largest revenue share in 2025, as virtual influencers are being increasingly adopted as trendsetters and brand ambassadors for fashion & lifestyle industries among others. In particular, virtual influencers are very useful for promoting various types of products, including clothing, accessories, and beauty items, because they represent the aesthetics and values of target consumers.
The food & entertainment segment is projected to register the fastest CAGR as the search for entertaining and relatable content rises among the youth. From hosting interactive cooking shows and food-centric livestreams to creating anticipation for entertainment events, virtual influencers are also being leveraged to connect brands with consumers.
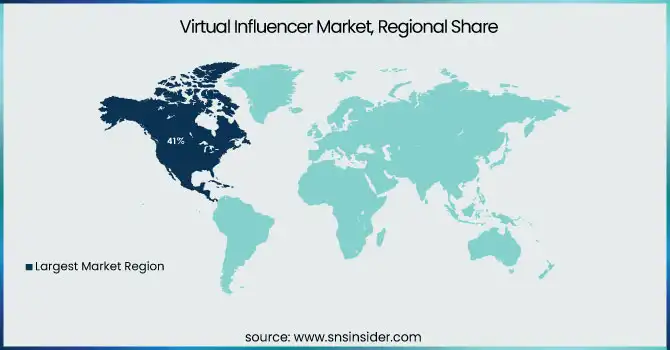
Virtual Influencer Market Regional Analysis:
North America Virtual Influencer Market Trends:
The North America dominated the market and accounted for 41% in 2025. The rapid advancements of artificial intelligence and the improvement of computer-generated imagery allow the creation of realistic digital representation and graphical intelligence, so this growth comes. In a time where many brands and businesses are looking for innovative ways to appeal to audiences who have long since digitized with the rise of technology, the virtual influencer is becoming an appealing option due to their cost-effective nature in comparison to their traditional counterparts, while offering a soort of customizable content that meets the exact values of a brand.
Asia-Pacific Virtual Influencer Market Trends:
Asia Pacific is expected to expand at the fastest CAGR during the forecast period, due to the growing demand for creative promotional techniques and high acceptance of social media sites. Successfully used for brand endorsements and storytelling, virtual influencers have become a powerful tool as brands navigate the digital-savvy consumers.
Europe Virtual Influencer Market Trends:
Europe is witnessing steady growth as fashion, beauty, and lifestyle brands increasingly leverage virtual influencers for campaigns. The region benefits from strong technology infrastructure and early adoption of AI and CGI tools, enabling more realistic and engaging digital personalities
Latin America Virtual Influencer Market Trends:
Latin America is emerging as a key market for virtual influencers due to rising social media usage and demand for innovative marketing approaches. Brands in the region are experimenting with virtual influencers to reach younger audiences with interactive and customizable content
Middle East and Africa Virtual Influencer Market Trends:
The Middle East and Africa market is growing steadily as luxury, fashion, and technology brands adopt virtual influencers for brand promotion. Increased internet penetration, mobile adoption, and interest in digital marketing campaigns drive the use of AI-powered virtual personalities
Get Customized Report as per Your Business Requirement - Enquiry Now
Virtual Influencer Market Key Players:
-
Meta – Lil Miquela
-
Baidu – Xiaoyang
-
Samsung – SAM
-
Tencent – Tianyu
-
Adobe – Virtual YouTuber AI Tools
-
Superplastic – Janky & Guggimon
-
Brud – Bermuda
-
Aww Inc. – Imma
-
LG Electronics – Reah Keem
-
Shudu – The Diigitals
-
Zepeto (Naver Z) – Zepeto Avatars
-
Epic Games – Unreal MetaHumans
-
Soul Machines – Digital Humans AI
-
Camee – Virtual Influencer Platform
-
Synthesia – AI Video Avatars
Virtual Influencer Market Competitive Landscape:
COVER Corporation, established on June 13, 2016, is a Japanese virtual entertainment company and the parent of Hololive Production. Headquartered in Tokyo, it specializes in VTuber management, virtual concerts, and media mix ventures including merchandising and music. COVER went public on the Tokyo Stock Exchange in 2023 and has expanded globally, creating innovative AI-driven virtual talent and immersive digital experiences.
-
Hololive (Cover Corporation) – February 2024 , Mori Calliope, a virtual YouTuber under Hololive, sold out a 4,000-person concert at the Hollywood Palladium in Los Angeles, marking a significant milestone for virtual influencers in live entertainment.
The Clueless is a Barcelona-based creative agency founded in 2023 by Rubén Cruz and Diana Núñez. The agency gained prominence with the creation of Aitana López, Spain’s first AI-generated influencer, introduced in late 2023. Aitana, a 25-year-old virtual model with pink hair, was developed to address challenges faced with human models and has since become a notable figure in the digital influencer space. The Clueless continues to innovate in AI-driven influencer marketing, offering brands a unique approach to digital representation.
-
The Clueless – December 2024, The Spanish company introduced Aitana López, a virtual model who gained over 340,000 Instagram followers and collaborated with brands like BIG, earning up to €10,000 monthly.
Balmain Beauty, established in 2022 through a partnership with Estée Lauder, launched its inaugural fragrance collection, Les Éternels de Balmain, in September 2024. This line features eight all-gender eaux de parfum, blending Pierre Balmain’s Parisian heritage with Olivier Rousteing’s contemporary vision. The fragrances include reimagined versions of classic scents like Vent Vert, Ivoire, Ébène, and Carbone, alongside new creations such as Sel d’Ambre and Bronze. The bottles, designed to be refillable and recyclable, pay homage to Balmain's first perfume flacon from 1946
-
Balmain – September 2024, The fashion house expanded its virtual army by integrating AI-generated models into campaigns, reflecting a broader industry trend towards digital representation.
| Report Attributes | Details |
|---|---|
| Market Size in 2025E | USD 9.75 Billion |
| Market Size by 2033 | USD 154.83 Billion |
| CAGR | CAGR of 41.29% From 2026 to 2033 |
| Base Year | 2025 |
| Forecast Period | 2026-2033 |
| Historical Data | 2022-2024 |
| Report Scope & Coverage | Market Size, Segments Analysis, Competitive Landscape, Regional Analysis, DROC & SWOT Analysis, Forecast Outlook |
| Key Segments | • By Type (Non-human, Human Avatar) • By Offering (Solutions, Services) • By End-Use (Food & Entertainment, Sports & Fitness, Banking & Finance, Travel & Holiday, Fashion & Lifestyle, Others) |
| Regional Analysis/Coverage | North America (US, Canada, Mexico), Europe (Eastern Europe [Poland, Romania, Hungary, Turkey, Rest of Eastern Europe] Western Europe] Germany, France, UK, Italy, Spain, Netherlands, Switzerland, Austria, Rest of Western Europe]), Asia Pacific (China, India, Japan, South Korea, Vietnam, Singapore, Australia, Rest of Asia Pacific), Middle East & Africa (Middle East [UAE, Egypt, Saudi Arabia, Qatar, Rest of Middle East], Africa [Nigeria, South Africa, Rest of Africa], Latin America (Brazil, Argentina, Colombia, Rest of Latin America) |
| Company Profiles |
Meta, Baidu, Samsung, Tencent, Adobe, Superplastic, Brud, Aww Inc., LG Electronics, Shudu, Zepeto (Naver Z), Epic Games, Soul Machines, Camee, Synthesia, Lightfarm Studios, Anam, Virtual Spirits, Supernormal, CodeMiko |
