image

Virtual Fitting Room Market Report Scope & Overview:

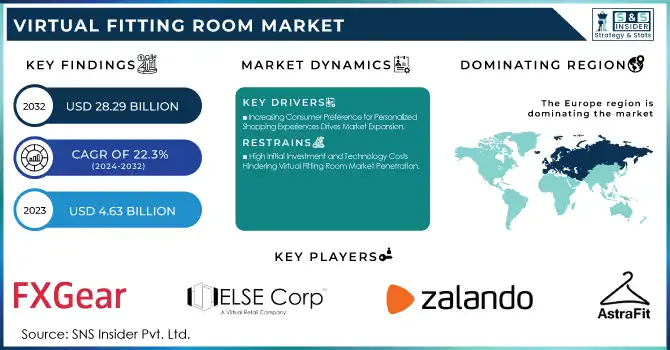
The Virtual Fitting Room Market Size was valued at USD 4.63 Billion in 2023 and is expected to reach USD 28.29 Billion by 2032 and grow at a CAGR of 22.3% over the forecast period 2024-2032.

Virtual Fitting Room Market Revenue Analysis

Get More Information on Virtual Fitting Room Market - Request Sample Report

The market analysis includes key factors like technological advancements, customer adoption rates, and evolving consumer behavior. Examining AI, AR, and VR integration trends, alongside social media influence, highlights growth drivers such as personalized shopping demand and e-commerce expansion, showcasing the future potential of virtual fitting solutions across industries.

Virtual Fitting Room Market Dynamics

Key Driver:

  • Increasing Consumer Preference for Personalized Shopping Experiences Drives Market Expansion

As consumers increasingly seek tailored shopping experiences, the demand for personalized solutions is fueling the growth of the Virtual Fitting Room Market. Virtual fitting rooms allow a consumer to try on his or her clothing virtually and offer the client personalization over a body type, size, and style. This enables enhanced customer satisfaction, decreased return rates, and improved shopping experience. As e-commerce continues to dominate the retail sector, the shift towards virtual fitting rooms has made it easier for brands to offer an effective, interactive, and engaging platform that attracts more online shoppers, thereby driving market growth.

Restraint

  • High Initial Investment and Technology Costs Hindering Virtual Fitting Room Market Penetration

One of the significant challenges faced by businesses in adopting virtual fitting rooms is the high initial investment required for advanced technology and infrastructure. Incorporating technologies such as augmented reality (AR) and artificial intelligence (AI) requires significant capital investment, and the means of maintenance have to be continuously sustained. These technologies probably will not easily find their way to smaller retailers, especially those dealing with less generous budgets. The high cost of implementation and specialized technical skills required increase the entry and expansion barrier for most businesses seeking a share in the virtual fitting room market, thus reducing market penetration.

Opportunity

  • Growth in Online Fashion Retail and E-Commerce Creates Lucrative Opportunities for Virtual Fitting Room Adoption

The rapid growth of online fashion retail and e-commerce presents a significant opportunity for virtual fitting rooms to gain widespread adoption. The rise in consumers buying fashion online means the demand for solutions that decrease uncertainty and improve the virtual shopping experience is growing. Virtual fitting rooms can be designed to replicate the in-store experience by offering precise size recommendations and visualizations of how clothes will look on individual bodies. This innovation will help brands decrease return rates and increase customer satisfaction, making it a valuable tool for online fashion retailers looking to improve sales and customer loyalty.

Challenge

  • Technological Limitations and Accuracy Concerns Impacting the Effectiveness of Virtual Fitting Rooms

One of the primary challenges for virtual fitting room solutions is overcoming technological limitations and addressing concerns regarding the accuracy of fit. Though augmented reality (AR) and artificial intelligence (AI) have progressed to new heights, poor body measurements, inaccurate virtual display of clothes, and the limitation in garment design customization may reduce user experience. Therefore, it is very crucial for companies, while virtual fitting rooms continue to grow, to develop this technology so that consumers get an exact and real fit. Consumer acceptance is key in achieving these goals in the retail industry.

Virtual Fitting Room Market Segments Analysis

By Component

In 2023, the Software segment of the Virtual Fitting Room Market accounted for the largest share of revenue, holding 47%. Growth can be attributed primarily to the augmented reality (AR) and artificial intelligence (AI) technologies used in delivering highly realistic and interactive virtual fitting experiences. Software developers continue to increase the accuracy and realism of virtual try-ons while addressing issues relating to size fitting, texture rendering, and the virtual body.

The Services segment to witness the fastest CAGR of 24.21% during the forecast period. This growth is mainly due to the increasing demand for customized implementation, integration, and maintenance services associated with virtual fitting room technology. Service providers are playing an essential role in helping retailers integrate virtual fitting room solutions seamlessly into their platforms and ensuring the technology performs efficiently.

By End Use

In 2023, the Virtual Stores segment of the Virtual Fitting Room Market led with the largest share of revenue at 63%. This is driven by the growth in e-commerce and the need for digital transformation in retail. Virtual fitting rooms allow online shoppers to try on clothes virtually, thereby improving the online shopping experience by increasing fit accuracy and reducing returns. Rising demands for convenience and digital shopping experience are further promoting virtual fitting rooms in virtual stores, and market growth, leading to further the expansion of the role of AI and AR in changing the scenario of e-commerce.

The Physical Stores segment is projected to experience the fastest CAGR of 23.28% during the forecasted period. This is due to the growing trend of omnichannel retailing, where physical stores are integrating virtual fitting room technology to enhance in-store customer experiences. Physical retailers are adopting augmented reality (AR) and interactive mirrors to bridge the gap between the online and offline shopping experiences.

For example, L'Oreal and Sephora have launched augmented reality-based beauty try-ons in stores, enabling customers to visualize cosmetics in real time.

By Application

In 2023, the Apparel segment dominated the Virtual Fitting Room Market, holding the largest revenue share of 43%. The growth is mainly driven by the increased need for the virtual shopping experience in the fashion industry. Virtual fitting rooms in the apparel retail area propose an innovation that allows customers to try on clothes virtually to avoid returns because of the wrong size. The apparel segment remains the highest adopter in the market with virtual fitting rooms, as they enhance customer involvement, reduce the rate of return, and have a positive overall shopping experience.

The Beauty and Cosmetics segment is projected to experience the fastest CAGR of 25.23% during the forecasted period, reflecting the growing demand for virtual try-on solutions in the beauty industry. As consumers are increasingly seeking online beauty shopping experiences, virtual fitting rooms have become a must for visualizing how makeup products like lipsticks, eyeshadows, and foundations will look on their skin tones.
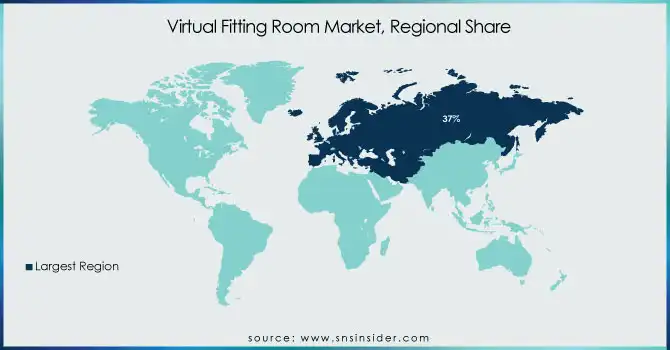
Regional Analysis

In 2023, Europe dominated the Virtual Fitting Room Market, holding a significant share, estimated to be around 37% of the total market revenue. Augmented reality and artificial intelligence are the most widely adopted advanced technologies in Europe, which can highly contribute to the fashion and retail industries' technology adoption. European countries, especially the UK, France, and Germany, have been highly focused on virtual fitting room solutions early on due to a strong focus on optimizing customer experiences through e-commerce.

For example, ASOS and Zalando, two of Europe's largest fashion retailers, have incorporated virtual fitting technologies into their platforms to enhance customer engagement and reduce return rates.

The Asia Pacific region is the fastest-growing market in the Virtual Fitting Room sector, with an estimated CAGR of 25.67% during the forecast period. The remarkable growth is led by the booming e-commerce sector, increased usage of smartphones, and adoption of retail technologies like AR and AI in the countries like China, Japan, and India. Consumers of these countries expect innovative and tailored shopping experiences since they are relatively tech-savvy.

Virtual-Fitting-Room-Market-Regional-Share

Do You Need any Customization Research on Virtual Fitting Room Market - Enquire Now

Key Players

Some of the major players in the Virtual Fitting Room Market are:

  • Astrafit (AstraFit Virtual Fitting Solution, Size Recommendation Engine)

  • Zalando (Zalando Virtual Fitting Room, Zalando Size Advisor)

  • Else Corp (ELSE-ware Virtual Fitting, ELSE AI-Powered Size Matching)

  • FXGear Inc. (FXMirror Virtual Try-On, FXFit 3D Body Scanning)

  • Metail (MeModel Virtual Try-On, Metail Fit Technology)

  • Fit Analytics (Fit Finder, Fit Connect)

  • Zugara Inc. (Virtual Dressing Room, AR Retail Fitting)

  • SIZEBAY (Sizebay Fit Advisor, Virtual Size Recommendation)

  • Magic Mirror (Magic Mirror Smart Fitting, AI-Powered Virtual Try-On)

  • Memomi Labs Inc. (Memory Mirror, Virtual Try-On Platform)

  • SenseMi (SenseMi AI Fit, Virtual Dressing Room)

  • triMirror (triMirror Real-Time Fitting, 3D Virtual Try-On)

  • Virtusize (Virtusize Size Guide, Virtual Fitting Room)

  • Visualook (Visualook AR Fitting, AI-Based Size Estimator)

  • Reactive Reality GmbH (PictoFit Virtual Try-On, AI Fit Customization)

Recent Trends

  • In October 2024, Zalando launched an enhanced virtual fitting room feature, allowing customers to try on clothes virtually using photos to generate accurate 3D avatars. This initiative aimed to reduce the company's high return rate, with size issues accounting for a third of returns.

Virtual Fitting Room Market Report Scope:

Report Attributes Details
Market Size in 2023 US$ 4.63 Billion
Market Size by 2032 US$ 28.29 Billion
CAGR CAGR of 22.3 % From 2024 to 2032
Base Year 2023
Forecast Period 2024-2032
Historical Data 2020-2022
Report Scope & Coverage Market Size, Segments Analysis, Competitive  Landscape, Regional Analysis, DROC & SWOT Analysis, Forecast Outlook
Key Segments • By Component (Hardware, Software [On-premise, Cloud], Services [Installation, Support & Maintenance, Consulting]) 
• By Application (Apparel, Beauty and Cosmetics, Eyewear, Footwear, Others) 
• By End Use (Physical Stores, Virtual Stores)  
Regional Analysis/Coverage North America (US, Canada, Mexico), Europe (Eastern Europe [Poland, Romania, Hungary, Turkey, Rest of Eastern Europe] Western Europe] Germany, France, UK, Italy, Spain, Netherlands, Switzerland, Austria, Rest of Western Europe]), Asia Pacific (China, India, Japan, South Korea, Vietnam, Singapore, Australia, Rest of Asia Pacific), Middle East & Africa (Middle East [UAE, Egypt, Saudi Arabia, Qatar, Rest of Middle East], Africa [Nigeria, South Africa, Rest of Africa], Latin America (Brazil, Argentina, Colombia, Rest of Latin America)
Company Profiles AstraFit, Zalando, ELSE Corp Srl, FXGear Inc., Metail, Fit Analytics, Zugara Inc., SIZEBAY, Magic Mirror, Memomi Labs Inc., SenseMi, triMirror, Virtusize, Visualook, Reactive Reality GmbH.


Frequently Asked Questions

Ans: The Virtual Fitting Room Market is expected to grow at a CAGR of 22.3% during 2024-2032.

Ans: The Virtual Fitting Room Market size was USD 4.63 billion in 2023 and is expected to Reach USD 28.29 billion by 2032.

Ans: The major growth factor of the Virtual Fitting Room Market is the increasing demand for personalized and convenient shopping experiences in the e-commerce sector.


Ans: The software segment dominated the Virtual Fitting Room Market.

Ans: Europe dominated the Virtual Fitting Room Market in 2023.

Table Of Contents

1. Introduction

1.1 Market Definition

1.2 Scope (Inclusion and Exclusions)

1.3 Research Assumptions

2. Executive Summary

2.1 Market Overview

2.2 Regional Synopsis

2.3 Competitive Summary

3. Research Methodology

3.1 Top-Down Approach

3.2 Bottom-up Approach

3.3. Data Validation

3.4 Primary Interviews

4. Market Dynamics Impact Analysis

4.1 Market Driving Factors Analysis

4.1.1 Drivers

4.1.2 Restraints

4.1.3 Opportunities

4.1.4 Challenges

4.2 PESTLE Analysis

4.3 Porter’s Five Forces Model

5. Statistical Insights and Trends Reporting

5.1 Customer Demographics (2023)

5.2 Consumer Engagement Metrics

5.3 Consumer Satisfaction and Feedback

5.4 Investment and Funding Trends

6. Competitive Landscape

6.1 List of Major Companies, By Region

6.2 Market Share Analysis, By Region

6.3 Product Benchmarking

6.3.1 Product specifications and features

6.3.2 Pricing

6.4 Strategic Initiatives

6.4.1 Marketing and promotional activities

6.4.2 Distribution and supply chain strategies

6.4.3 Expansion plans and new product launches

6.4.4 Strategic partnerships and collaborations

6.5 Technological Advancements

6.6 Market Positioning and Branding

7. Virtual Fitting Room Market Segmentation, By Component

7.1 Chapter Overview

7.2 Hardware

7.2.1 Hardware Market Trends Analysis (2020-2032)

7.2.2 Hardware Market Size Estimates and Forecasts to 2032 (USD Billion)

7.3 Software

7.3.1 Software Market Trends Analysis (2020-2032)

7.3.2 Software Market Size Estimates and Forecasts to 2032 (USD Billion)

7.3.3 On-premise

7.3.3.1 On-premise Market Trends Analysis (2020-2032)

7.3.3.2 On-premise Market Size Estimates and Forecasts to 2032 (USD Billion)

7.3.4 Cloud

7.3.4.1 Cloud Market Trends Analysis (2020-2032)

7.3.4.2 Cloud Market Size Estimates and Forecasts to 2032 (USD Billion)

7.4 Services

7.4.1 Services Market Trends Analysis (2020-2032)

7.4.2 Services Market Size Estimates and Forecasts to 2032 (USD Billion)

7.4.3 Installation

7.4.3.1 Installation Market Trends Analysis (2020-2032)

7.4.3.2 Installation Market Size Estimates and Forecasts to 2032 (USD Billion)

7.4.4 Support & Maintenance

7.4.4.1 Support & Maintenance Market Trends Analysis (2020-2032)

7.4.4.2 Support & Maintenance Market Size Estimates and Forecasts to 2032 (USD Billion)

7.4.5 Consulting

7.4.5.1 Consulting Market Trends Analysis (2020-2032)

7.4.5.2 Consulting Market Size Estimates and Forecasts to 2032 (USD Billion)

8. Virtual Fitting Room Market Segmentation, By Application

8.1 Chapter Overview

8.2 Apparel

8.2.1 Apparel Market Trends Analysis (2020-2032)

8.2.2 Apparel Market Size Estimates and Forecasts to 2032 (USD Billion)

8.3 Beauty and Cosmetics

8.3.1 Beauty and Cosmetics Market Trends Analysis (2020-2032)

8.3.2 Beauty and Cosmetics Market Size Estimates and Forecasts to 2032 (USD Billion)

8.4 Eyewear

8.4.1 Eyewear Market Trends Analysis (2020-2032)

8.4.2 Eyewear Market Size Estimates and Forecasts to 2032 (USD Billion)

8.5 Footwear

8.5.1 Footwear Market Trends Analysis (2020-2032)

8.5.2 Footwear Market Size Estimates and Forecasts to 2032 (USD Billion)

8.6 Other

8.6.1 Other Market Trends Analysis (2020-2032)

8.6.2 Other Market Size Estimates and Forecasts to 2032 (USD Billion)

9. Virtual Fitting Room Market Segmentation, By End Use

9.1 Chapter Overview

9.2 Physical Stores

9.2.1 Physical Stores Market Trends Analysis (2020-2032)

9.2.2 Physical Stores Market Size Estimates and Forecasts to 2032 (USD Billion)

9.3 Virtual Stores

9.3.1 Virtual Stores Market Trends Analysis (2020-2032)

9.3.2 Virtual Stores Market Size Estimates and Forecasts to 2032 (USD Billion)

10. Regional Analysis

10.1 Chapter Overview

10.2 North America

10.2.1 Trends Analysis

10.2.2 North America Virtual Fitting Room Market Estimates and Forecasts, by Country (2020-2032) (USD Billion)

10.2.3 North America Virtual Fitting Room Market Estimates and Forecasts, By Component (2020-2032) (USD Billion) 

10.2.4 North America Virtual Fitting Room Market Estimates and Forecasts, By Application (2020-2032) (USD Billion)

10.2.5 North America Virtual Fitting Room Market Estimates and Forecasts, By End Use (2020-2032) (USD Billion)

10.2.6 USA

10.2.6.1 USA Virtual Fitting Room Market Estimates and Forecasts, By Component (2020-2032) (USD Billion)

10.2.6.2 USA Virtual Fitting Room Market Estimates and Forecasts, By Application (2020-2032) (USD Billion)

10.2.6.3 USA Virtual Fitting Room Market Estimates and Forecasts, By End Use (2020-2032) (USD Billion)

10.2.7 Canada

10.2.7.1 Canada Virtual Fitting Room Market Estimates and Forecasts, By Component (2020-2032) (USD Billion)

10.2.7.2 Canada Virtual Fitting Room Market Estimates and Forecasts, By Application (2020-2032) (USD Billion)

10.2.7.3 Canada Virtual Fitting Room Market Estimates and Forecasts, By End Use (2020-2032) (USD Billion)

10.2.8 Mexico

10.2.8.1 Mexico Virtual Fitting Room Market Estimates and Forecasts, By Component (2020-2032) (USD Billion)

10.2.8.2 Mexico Virtual Fitting Room Market Estimates and Forecasts, By Application (2020-2032) (USD Billion)

10.2.8.3 Mexico Virtual Fitting Room Market Estimates and Forecasts, By End Use (2020-2032) (USD Billion)

10.3 Europe

10.3.1 Eastern Europe

10.3.1.1 Trends Analysis

10.3.1.2 Eastern Europe Virtual Fitting Room Market Estimates and Forecasts, by Country (2020-2032) (USD Billion)

10.3.1.3 Eastern Europe Virtual Fitting Room Market Estimates and Forecasts, By Component (2020-2032) (USD Billion) 

10.3.1.4 Eastern Europe Virtual Fitting Room Market Estimates and Forecasts, By Application (2020-2032) (USD Billion)

10.3.1.5 Eastern Europe Virtual Fitting Room Market Estimates and Forecasts, By End Use (2020-2032) (USD Billion)

10.3.1.6 Poland

10.3.1.6.1 Poland Virtual Fitting Room Market Estimates and Forecasts, By Component (2020-2032) (USD Billion)

10.3.1.6.2 Poland Virtual Fitting Room Market Estimates and Forecasts, By Application (2020-2032) (USD Billion)

10.3.1.6.3 Poland Virtual Fitting Room Market Estimates and Forecasts, By End Use (2020-2032) (USD Billion)

10.3.1.7 Romania

10.3.1.7.1 Romania Virtual Fitting Room Market Estimates and Forecasts, By Component (2020-2032) (USD Billion)

10.3.1.7.2 Romania Virtual Fitting Room Market Estimates and Forecasts, By Application (2020-2032) (USD Billion)

10.3.1.7.3 Romania Virtual Fitting Room Market Estimates and Forecasts, By End Use (2020-2032) (USD Billion)

10.3.1.8 Hungary

10.3.1.8.1 Hungary Virtual Fitting Room Market Estimates and Forecasts, By Component (2020-2032) (USD Billion)

10.3.1.8.2 Hungary Virtual Fitting Room Market Estimates and Forecasts, By Application (2020-2032) (USD Billion)

10.3.1.8.3 Hungary Virtual Fitting Room Market Estimates and Forecasts, By End Use (2020-2032) (USD Billion)

10.3.1.9 Turkey

10.3.1.9.1 Turkey Virtual Fitting Room Market Estimates and Forecasts, By Component (2020-2032) (USD Billion)

10.3.1.9.2 Turkey Virtual Fitting Room Market Estimates and Forecasts, By Application (2020-2032) (USD Billion)

10.3.1.9.3 Turkey Virtual Fitting Room Market Estimates and Forecasts, By End Use (2020-2032) (USD Billion)

10.3.1.10 Rest of Eastern Europe

10.3.1.10.1 Rest of Eastern Europe Virtual Fitting Room Market Estimates and Forecasts, By Component (2020-2032) (USD Billion)

10.3.1.10.2 Rest of Eastern Europe Virtual Fitting Room Market Estimates and Forecasts, By Application (2020-2032) (USD Billion)

10.3.1.10.3 Rest of Eastern Europe Virtual Fitting Room Market Estimates and Forecasts, By End Use (2020-2032) (USD Billion)

10.3.2 Western Europe

10.3.2.1 Trends Analysis

10.3.2.2 Western Europe Virtual Fitting Room Market Estimates and Forecasts, by Country (2020-2032) (USD Billion)

10.3.2.3 Western Europe Virtual Fitting Room Market Estimates and Forecasts, By Component (2020-2032) (USD Billion) 

10.3.2.4 Western Europe Virtual Fitting Room Market Estimates and Forecasts, By Application (2020-2032) (USD Billion)

10.3.2.5 Western Europe Virtual Fitting Room Market Estimates and Forecasts, By End Use (2020-2032) (USD Billion)

10.3.2.6 Germany

10.3.2.6.1 Germany Virtual Fitting Room Market Estimates and Forecasts, By Component (2020-2032) (USD Billion)

10.3.2.6.2 Germany Virtual Fitting Room Market Estimates and Forecasts, By Application (2020-2032) (USD Billion)

10.3.2.6.3 Germany Virtual Fitting Room Market Estimates and Forecasts, By End Use (2020-2032) (USD Billion)

10.3.2.7 France

10.3.2.7.1 France Virtual Fitting Room Market Estimates and Forecasts, By Component (2020-2032) (USD Billion)

10.3.2.7.2 France Virtual Fitting Room Market Estimates and Forecasts, By Application (2020-2032) (USD Billion)

10.3.2.7.3 France Virtual Fitting Room Market Estimates and Forecasts, By End Use (2020-2032) (USD Billion)

10.3.2.8 UK

10.3.2.8.1 UK Virtual Fitting Room Market Estimates and Forecasts, By Component (2020-2032) (USD Billion)

10.3.2.8.2 UK Virtual Fitting Room Market Estimates and Forecasts, By Application (2020-2032) (USD Billion)

10.3.2.8.3 UK Virtual Fitting Room Market Estimates and Forecasts, By End Use (2020-2032) (USD Billion)

10.3.2.9 Italy

10.3.2.9.1 Italy Virtual Fitting Room Market Estimates and Forecasts, By Component (2020-2032) (USD Billion)

10.3.2.9.2 Italy Virtual Fitting Room Market Estimates and Forecasts, By Application (2020-2032) (USD Billion)

10.3.2.9.3 Italy Virtual Fitting Room Market Estimates and Forecasts, By End Use (2020-2032) (USD Billion)

10.3.2.10 Spain

10.3.2.10.1 Spain Virtual Fitting Room Market Estimates and Forecasts, By Component (2020-2032) (USD Billion)

10.3.2.10.2 Spain Virtual Fitting Room Market Estimates and Forecasts, By Application (2020-2032) (USD Billion)

10.3.2.10.3 Spain Virtual Fitting Room Market Estimates and Forecasts, By End Use (2020-2032) (USD Billion)

10.3.2.11 Netherlands

10.3.2.11.1 Netherlands Virtual Fitting Room Market Estimates and Forecasts, By Component (2020-2032) (USD Billion)

10.3.2.11.2 Netherlands Virtual Fitting Room Market Estimates and Forecasts, By Application (2020-2032) (USD Billion)

10.3.2.11.3 Netherlands Virtual Fitting Room Market Estimates and Forecasts, By End Use (2020-2032) (USD Billion)

10.3.2.12 Switzerland

10.3.2.12.1 Switzerland Virtual Fitting Room Market Estimates and Forecasts, By Component (2020-2032) (USD Billion)

10.3.2.12.2 Switzerland Virtual Fitting Room Market Estimates and Forecasts, By Application (2020-2032) (USD Billion)

10.3.2.12.3 Switzerland Virtual Fitting Room Market Estimates and Forecasts, By End Use (2020-2032) (USD Billion)

10.3.2.13 Austria

10.3.2.13.1 Austria Virtual Fitting Room Market Estimates and Forecasts, By Component (2020-2032) (USD Billion)

10.3.2.13.2 Austria Virtual Fitting Room Market Estimates and Forecasts, By Application (2020-2032) (USD Billion)

10.3.2.13.3 Austria Virtual Fitting Room Market Estimates and Forecasts, By End Use (2020-2032) (USD Billion)

10.3.2.14 Rest of Western Europe

10.3.2.14.1 Rest of Western Europe Virtual Fitting Room Market Estimates and Forecasts, By Component (2020-2032) (USD Billion)

10.3.2.14.2 Rest of Western Europe Virtual Fitting Room Market Estimates and Forecasts, By Application (2020-2032) (USD Billion)

10.3.2.14.3 Rest of Western Europe Virtual Fitting Room Market Estimates and Forecasts, By End Use (2020-2032) (USD Billion)

10.4 Asia Pacific

10.4.1 Trends Analysis

10.4.2 Asia Pacific Virtual Fitting Room Market Estimates and Forecasts, by Country (2020-2032) (USD Billion)

10.4.3 Asia Pacific Virtual Fitting Room Market Estimates and Forecasts, By Component (2020-2032) (USD Billion) 

10.4.4 Asia Pacific Virtual Fitting Room Market Estimates and Forecasts, By Application (2020-2032) (USD Billion)

10.4.5 Asia Pacific Virtual Fitting Room Market Estimates and Forecasts, By End Use (2020-2032) (USD Billion)

10.4.6 China

10.4.6.1 China Virtual Fitting Room Market Estimates and Forecasts, By Component (2020-2032) (USD Billion)

10.4.6.2 China Virtual Fitting Room Market Estimates and Forecasts, By Application (2020-2032) (USD Billion)

10.4.6.3 China Virtual Fitting Room Market Estimates and Forecasts, By End Use (2020-2032) (USD Billion)

10.4.7 India

10.4.7.1 India Virtual Fitting Room Market Estimates and Forecasts, By Component (2020-2032) (USD Billion)

10.4.7.2 India Virtual Fitting Room Market Estimates and Forecasts, By Application (2020-2032) (USD Billion)

10.4.7.3 India Virtual Fitting Room Market Estimates and Forecasts, By End Use (2020-2032) (USD Billion)

10.4.8 Japan

10.4.8.1 Japan Virtual Fitting Room Market Estimates and Forecasts, By Component (2020-2032) (USD Billion)

10.4.8.2 Japan Virtual Fitting Room Market Estimates and Forecasts, By Application (2020-2032) (USD Billion)

10.4.8.3 Japan Virtual Fitting Room Market Estimates and Forecasts, By End Use (2020-2032) (USD Billion)

10.4.9 South Korea

10.4.9.1 South Korea Virtual Fitting Room Market Estimates and Forecasts, By Component (2020-2032) (USD Billion)

10.4.9.2 South Korea Virtual Fitting Room Market Estimates and Forecasts, By Application (2020-2032) (USD Billion)

10.4.9.3 South Korea Virtual Fitting Room Market Estimates and Forecasts, By End Use (2020-2032) (USD Billion)

10.4.10 Vietnam

10.4.10.1 Vietnam Virtual Fitting Room Market Estimates and Forecasts, By Component (2020-2032) (USD Billion)

10.4.10.2 Vietnam Virtual Fitting Room Market Estimates and Forecasts, By Application (2020-2032) (USD Billion)

10.4.10.3 Vietnam Virtual Fitting Room Market Estimates and Forecasts, By End Use (2020-2032) (USD Billion)

10.4.11 Singapore

10.4.11.1 Singapore Virtual Fitting Room Market Estimates and Forecasts, By Component (2020-2032) (USD Billion)

10.4.11.2 Singapore Virtual Fitting Room Market Estimates and Forecasts, By Application (2020-2032) (USD Billion)

10.4.11.3 Singapore Virtual Fitting Room Market Estimates and Forecasts, By End Use (2020-2032) (USD Billion)

10.4.12 Australia

10.4.12.1 Australia Virtual Fitting Room Market Estimates and Forecasts, By Component (2020-2032) (USD Billion)

10.4.12.2 Australia Virtual Fitting Room Market Estimates and Forecasts, By Application (2020-2032) (USD Billion)

10.4.12.3 Australia Virtual Fitting Room Market Estimates and Forecasts, By End Use (2020-2032) (USD Billion)

10.4.13 Rest of Asia Pacific

10.4.13.1 Rest of Asia Pacific Virtual Fitting Room Market Estimates and Forecasts, By Component (2020-2032) (USD Billion)

10.4.13.2 Rest of Asia Pacific Virtual Fitting Room Market Estimates and Forecasts, By Application (2020-2032) (USD Billion)

10.4.13.3 Rest of Asia Pacific Virtual Fitting Room Market Estimates and Forecasts, By End Use (2020-2032) (USD Billion)

10.5 Middle East and Africa

10.5.1 Middle East

10.5.1.1 Trends Analysis

10.5.1.2 Middle East Virtual Fitting Room Market Estimates and Forecasts, by Country (2020-2032) (USD Billion)

10.5.1.3 Middle East Virtual Fitting Room Market Estimates and Forecasts, By Component (2020-2032) (USD Billion) 

10.5.1.4 Middle East Virtual Fitting Room Market Estimates and Forecasts, By Application (2020-2032) (USD Billion)

10.5.1.5 Middle East Virtual Fitting Room Market Estimates and Forecasts, By End Use (2020-2032) (USD Billion)

10.5.1.6 UAE

10.5.1.6.1 UAE Virtual Fitting Room Market Estimates and Forecasts, By Component (2020-2032) (USD Billion)

10.5.1.6.2 UAE Virtual Fitting Room Market Estimates and Forecasts, By Application (2020-2032) (USD Billion)

10.5.1.6.3 UAE Virtual Fitting Room Market Estimates and Forecasts, By End Use (2020-2032) (USD Billion)

10.5.1.7 Egypt

10.5.1.7.1 Egypt Virtual Fitting Room Market Estimates and Forecasts, By Component (2020-2032) (USD Billion)

10.5.1.7.2 Egypt Virtual Fitting Room Market Estimates and Forecasts, By Application (2020-2032) (USD Billion)

10.5.1.7.3 Egypt Virtual Fitting Room Market Estimates and Forecasts, By End Use (2020-2032) (USD Billion)

10.5.1.8 Saudi Arabia

10.5.1.8.1 Saudi Arabia Virtual Fitting Room Market Estimates and Forecasts, By Component (2020-2032) (USD Billion)

10.5.1.8.2 Saudi Arabia Virtual Fitting Room Market Estimates and Forecasts, By Application (2020-2032) (USD Billion)

10.5.1.8.3 Saudi Arabia Virtual Fitting Room Market Estimates and Forecasts, By End Use (2020-2032) (USD Billion)

10.5.1.9 Qatar

10.5.1.9.1 Qatar Virtual Fitting Room Market Estimates and Forecasts, By Component (2020-2032) (USD Billion)

10.5.1.9.2 Qatar Virtual Fitting Room Market Estimates and Forecasts, By Application (2020-2032) (USD Billion)

10.5.1.9.3 Qatar Virtual Fitting Room Market Estimates and Forecasts, By End Use (2020-2032) (USD Billion)

10.5.1.10 Rest of Middle East

10.5.1.10.1 Rest of Middle East Virtual Fitting Room Market Estimates and Forecasts, By Component (2020-2032) (USD Billion)

10.5.1.10.2 Rest of Middle East Virtual Fitting Room Market Estimates and Forecasts, By Application (2020-2032) (USD Billion)

10.5.1.10.3 Rest of Middle East Virtual Fitting Room Market Estimates and Forecasts, By End Use (2020-2032) (USD Billion)

10.5.2 Africa

10.5.2.1 Trends Analysis

10.5.2.2 Africa Virtual Fitting Room Market Estimates and Forecasts, by Country (2020-2032) (USD Billion)

10.5.2.3 Africa Virtual Fitting Room Market Estimates and Forecasts, By Component (2020-2032) (USD Billion) 

10.5.2.4 Africa Virtual Fitting Room Market Estimates and Forecasts, By Application (2020-2032) (USD Billion)

10.5.2.5 Africa Virtual Fitting Room Market Estimates and Forecasts, By End Use (2020-2032) (USD Billion)

10.5.2.6 South Africa

10.5.2.6.1 South Africa Virtual Fitting Room Market Estimates and Forecasts, By Component (2020-2032) (USD Billion)

10.5.2.6.2 South Africa Virtual Fitting Room Market Estimates and Forecasts, By Application (2020-2032) (USD Billion)

10.5.2.6.3 South Africa Virtual Fitting Room Market Estimates and Forecasts, By End Use (2020-2032) (USD Billion)

10.5.2.7 Nigeria

10.5.2.7.1 Nigeria Virtual Fitting Room Market Estimates and Forecasts, By Component (2020-2032) (USD Billion)

10.5.2.7.2 Nigeria Virtual Fitting Room Market Estimates and Forecasts, By Application (2020-2032) (USD Billion)

10.5.2.7.3 Nigeria Virtual Fitting Room Market Estimates and Forecasts, By End Use (2020-2032) (USD Billion)

10.5.2.8 Rest of Africa

10.5.2.8.1 Rest of Africa Virtual Fitting Room Market Estimates and Forecasts, By Component (2020-2032) (USD Billion)

10.5.2.8.2 Rest of Africa Virtual Fitting Room Market Estimates and Forecasts, By Application (2020-2032) (USD Billion)

10.5.2.8.3 Rest of Africa Virtual Fitting Room Market Estimates and Forecasts, By End Use (2020-2032) (USD Billion)

10.6 Latin America

10.6.1 Trends Analysis

10.6.2 Latin America Virtual Fitting Room Market Estimates and Forecasts, by Country (2020-2032) (USD Billion)

10.6.3 Latin America Virtual Fitting Room Market Estimates and Forecasts, By Component (2020-2032) (USD Billion) 

10.6.4 Latin America Virtual Fitting Room Market Estimates and Forecasts, By Application (2020-2032) (USD Billion)

10.6.5 Latin America Virtual Fitting Room Market Estimates and Forecasts, By End Use (2020-2032) (USD Billion)

10.6.6 Brazil

10.6.6.1 Brazil Virtual Fitting Room Market Estimates and Forecasts, By Component (2020-2032) (USD Billion)

10.6.6.2 Brazil Virtual Fitting Room Market Estimates and Forecasts, By Application (2020-2032) (USD Billion)

10.6.6.3 Brazil Virtual Fitting Room Market Estimates and Forecasts, By End Use (2020-2032) (USD Billion)

10.6.7 Argentina

10.6.7.1 Argentina Virtual Fitting Room Market Estimates and Forecasts, By Component (2020-2032) (USD Billion)

10.6.7.2 Argentina Virtual Fitting Room Market Estimates and Forecasts, By Application (2020-2032) (USD Billion)

10.6.7.3 Argentina Virtual Fitting Room Market Estimates and Forecasts, By End Use (2020-2032) (USD Billion)

10.6.8 Colombia

10.6.8.1 Colombia Virtual Fitting Room Market Estimates and Forecasts, By Component (2020-2032) (USD Billion)

10.6.8.2 Colombia Virtual Fitting Room Market Estimates and Forecasts, By Application (2020-2032) (USD Billion)

10.6.8.3 Colombia Virtual Fitting Room Market Estimates and Forecasts, By End Use (2020-2032) (USD Billion)

10.6.9 Rest of Latin America

10.6.9.1 Rest of Latin America Virtual Fitting Room Market Estimates and Forecasts, By Component (2020-2032) (USD Billion)

10.6.9.2 Rest of Latin America Virtual Fitting Room Market Estimates and Forecasts, By Application (2020-2032) (USD Billion)

10.6.9.3 Rest of Latin America Virtual Fitting Room Market Estimates and Forecasts, By End Use (2020-2032) (USD Billion)

11. Company Profiles

11.1 AstraFit

11.1.1 Company Overview

11.1.2 Financial

11.1.3 Products/ Services Offered

11.1.4 SWOT Analysis

11.2 Zalando

11.2.1 Company Overview

11.2.2 Financial

11.2.3 Products/ Services Offered

11.2.4 SWOT Analysis

11.3 ELSE Corp Srl

11.3.1 Company Overview

11.3.2 Financial

11.3.3 Products/ Services Offered

11.3.4 SWOT Analysis

11.4 FXGear Inc.

11.4.1 Company Overview

11.4.2 Financial

11.4.3 Products/ Services Offered

11.4.4 SWOT Analysis

11.5 Metail

11.5.1 Company Overview

11.5.2 Financial

11.5.3 Products/ Services Offered

11.5.4 SWOT Analysis

11.6 Fit Analytics

11.6.1 Company Overview

11.6.2 Financial

11.6.3 Products/ Services Offered

11.6.4 SWOT Analysis

11.7 Zugara Inc.

11.7.1 Company Overview

11.7.2 Financial

11.7.3 Products/ Services Offered

11.7.4 SWOT Analysis

11.8 SIZEBAY

11.8.1 Company Overview

11.8.2 Financial

11.8.3 Products/ Services Offered

11.8.4 SWOT Analysis

11.9 Magic Mirror

11.9.1 Company Overview

11.9.2 Financial

11.9.3 Products/ Services Offered

11.9.4 SWOT Analysis

11.10 Memomi Labs Inc

11.10.1 Company Overview

11.10.2 Financial

11.10.3 Products/ Services Offered

11.10.4 SWOT Analysis

12. Use Cases and Best Practices

13. Conclusion

An accurate research report requires proper strategizing as well as implementation. There are multiple factors involved in the completion of good and accurate research report and selecting the best methodology to compete the research is the toughest part. Since the research reports we provide play a crucial role in any company’s decision-making process, therefore we at SNS Insider always believe that we should choose the best method which gives us results closer to reality. This allows us to reach at a stage wherein we can provide our clients best and accurate investment to output ratio.

Each report that we prepare takes a timeframe of 350-400 business hours for production. Starting from the selection of titles through a couple of in-depth brain storming session to the final QC process before uploading our titles on our website we dedicate around 350 working hours. The titles are selected based on their current market cap and the foreseen CAGR and growth.


The 5 steps process:

Step 1: Secondary Research:

Secondary Research or Desk Research is as the name suggests is a research process wherein, we collect data through the readily available information. In this process we use various paid and unpaid databases which our team has access to and gather data through the same. This includes examining of listed companies’ annual reports, Journals, SEC filling etc. Apart from this our team has access to various associations across the globe across different industries. Lastly, we have exchange relationships with various university as well as individual libraries.

Secondary Research

Step 2: Primary Research

When we talk about primary research, it is a type of study in which the researchers collect relevant data samples directly, rather than relying on previously collected data.  This type of research is focused on gaining content specific facts that can be sued to solve specific problems. Since the collected data is fresh and first hand therefore it makes the study more accurate and genuine.

We at SNS Insider have divided Primary Research into 2 parts.

Part 1 wherein we interview the KOLs of major players as well as the upcoming ones across various geographic regions. This allows us to have their view over the market scenario and acts as an important tool to come closer to the accurate market numbers. As many as 45 paid and unpaid primary interviews are taken from both the demand and supply side of the industry to make sure we land at an accurate judgement and analysis of the market.

This step involves the triangulation of data wherein our team analyses the interview transcripts, online survey responses and observation of on filed participants. The below mentioned chart should give a better understanding of the part 1 of the primary interview.

Primary Research

Part 2: In this part of primary research the data collected via secondary research and the part 1 of the primary research is validated with the interviews from individual consultants and subject matter experts.

Consultants are those set of people who have at least 12 years of experience and expertise within the industry whereas Subject Matter Experts are those with at least 15 years of experience behind their back within the same space. The data with the help of two main processes i.e., FGDs (Focused Group Discussions) and IDs (Individual Discussions). This gives us a 3rd party nonbiased primary view of the market scenario making it a more dependable one while collation of the data pointers.

Step 3: Data Bank Validation

Once all the information is collected via primary and secondary sources, we run that information for data validation. At our intelligence centre our research heads track a lot of information related to the market which includes the quarterly reports, the daily stock prices, and other relevant information. Our data bank server gets updated every fortnight and that is how the information which we collected using our primary and secondary information is revalidated in real time.

Data Bank Validation

Step 4: QA/QC Process

After all the data collection and validation our team does a final level of quality check and quality assurance to get rid of any unwanted or undesired mistakes. This might include but not limited to getting rid of the any typos, duplication of numbers or missing of any important information. The people involved in this process include technical content writers, research heads and graphics people. Once this process is completed the title gets uploader on our platform for our clients to read it.

Step 5: Final QC/QA Process:

This is the last process and comes when the client has ordered the study. In this process a final QA/QC is done before the study is emailed to the client. Since we believe in giving our clients a good experience of our research studies, therefore, to make sure that we do not lack at our end in any way humanly possible we do a final round of quality check and then dispatch the study to the client.

MARKET SEGMENTATION

  • By Component
    • Hardware

    • Software

      • On-premise

      • Cloud

    • Services

      • Installation

      • Support & Maintenance

      • Consulting

  • By Application

    • Apparel

    • Beauty and Cosmetics

    • Eyewear

    • Footwear

    • Others

  • By End Use

    • Physical Stores

    • Virtual Stores

Request for Segment Customization as per your Business Requirement: Segment Customization Request

REGIONAL COVERAGE:

North America

  • US

  • Canada

  • Mexico

Europe

  • Eastern Europe

    • Poland

    • Romania

    • Hungary

    • Turkey

    • Rest of Eastern Europe

  • Western Europe

    • Germany

    • France

    • UK

    • Italy

    • Spain

    • Netherlands

    • Switzerland

    • Austria

    • Rest of Western Europe

Asia Pacific

  • China

  • India

  • Japan

  • South Korea

  • Vietnam

  • Singapore

  • Australia

  • Rest of Asia Pacific

Middle East & Africa

  • Middle East

    • UAE

    • Egypt

    • Saudi Arabia

    • Qatar

    • Rest of the Middle East

  • Africa

    • Nigeria

    • South Africa

    • Rest of Africa

Latin America

  • Brazil

  • Argentina

  • Colombia

  • Rest Of Latin America

Request for Country Level Research Report: Country Level Customization Request

Available Customization

With the given market data, SNS Insider offers customization as per the company’s specific needs. The following customization options are available for the report:

  • Product Analysis

  • Criss-Cross segment analysis (e.g. Product X Application)

  • Product Matrix which gives a detailed comparison of product portfolio of each company

  • Geographic Analysis

  • Additional countries in any of the regions

  • Company Information

  • Detailed analysis and profiling of additional market players (Up to five)


  •            5000 (33% Discount)


  •            8950 (40% Discount)


  •            3050 (23% Discount)

Start a Conversation

Hi! Click one of our member below to chat on Phone