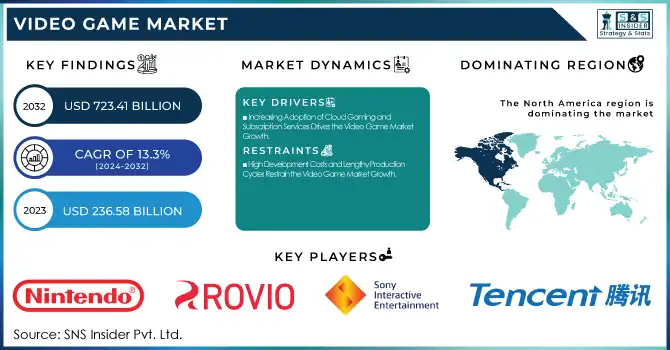
The Video Game Market Size was valued at USD 236.58 Billion in 2023 and is expected to reach USD 723.41 Billion by 2032 and grow at a CAGR of 13.3% over the forecast period 2024-2032. The various statistical insights offer a deeper understanding of the video game market. The demographic analysis covers the age, gender, and income distribution of gamers. Player engagement metrics track playtime, retention, and in-game purchases. Revenue distribution spans platforms, game types, and monetization models. Esports and streaming statistics highlight audience growth and tournament earnings. Developer data includes active studios and indie trends. Hardware trends cover console sales and cloud gaming adoption. Consumer spending, market penetration, and genre popularity reflect industry demand. Employment data showcases workforce growth, providing key insights into industry trends and opportunities.
To get more information on Video Game Market - Request Free Sample Report
Key Drivers:
Increasing Adoption of Cloud Gaming and Subscription Services Drives the Video Game Market Growth
The rising popularity of cloud gaming and subscription-based services is significantly driving the growth of the video game market. Platforms like Xbox Game Pass, PlayStation Plus, and NVIDIA GeForce Now allow gamers to access a vast library of games without the need for expensive hardware. This model reduces entry barriers, making gaming more accessible to a wider audience.
Additionally, cloud gaming eliminates the need for frequent hardware upgrades, enabling players to enjoy high-quality gaming experiences on lower-end devices. With the expansion of 5G and improved internet infrastructure, streaming games seamlessly is becoming more feasible, further fueling adoption. Subscription models provide recurring revenue for developers and publishers, ensuring sustainable growth. Companies are investing heavily in cloud technology, enhancing game performance and reducing latency. As digital distribution continues to replace physical sales, cloud gaming, and subscription services will play a crucial role in shaping the future of the video game industry.
Restrain;
High Development Costs and Lengthy Production Cycles Restrain the Video Game Market Growth
The video game industry faces significant challenges due to rising development costs and extended production timelines, restricting market growth. Modern games require advanced graphics, complex storylines, and immersive gameplay, necessitating substantial investment in technology, talent, and marketing. AAA titles can take several years to develop, increasing financial risks for developers and publishers. Delays in production and post-launch updates further escalate costs, impacting profitability.
Moreover, consumer expectations for high-quality content continue to rise, pressuring studios to invest heavily in innovation and optimization. Indie developers, despite creative ideas, often struggle to compete due to budget constraints. Additionally, unexpected challenges such as software bugs and market fluctuations can lead to costly delays or even cancellations. With development costs surging and production cycles becoming longer, only well-funded studios can afford to release high-budget games consistently, limiting opportunities for smaller developers and creating financial risks in an increasingly competitive market.
Opportunities:
Expansion of Virtual Reality (VR) and Augmented Reality (AR) Creates Lucrative Opportunities in the Video Game Market
The growing adoption of Virtual Reality (VR) and Augmented Reality (AR) is creating significant opportunities in the video game market. Advances in VR headsets, motion tracking, and haptic feedback are enhancing immersive gaming experiences, attracting both casual and hardcore gamers. Companies like Meta, Sony, and HTC are investing in next-generation VR devices, expanding the market potential. AR-based mobile games, such as Pokémon GO, have demonstrated the potential for interactive gaming in real-world environments, driving demand for AR technology.
Additionally, the integration of VR and AR in cloud gaming and esports is opening new revenue streams for developers. The rising affordability of VR headsets and AR-enabled smartphones is making these technologies more accessible. As 5G networks improve latency and streaming capabilities, VR and AR adoption will accelerate further. The expansion of VR and AR gaming presents significant growth opportunities for developers, hardware manufacturers, and content creators in the evolving video game industry.
Challenges:
Cybersecurity Threats and Data Privacy Concerns Pose Challenges for the Video Game Market Growth
Cybersecurity threats and data privacy concerns present significant challenges to the growth of the video game market. With the increasing digitization of gaming, cyberattacks, data breaches, and account hacking have become major risks for players and developers. Online multiplayer games, cloud gaming platforms, and digital marketplaces store vast amounts of user data, making them prime targets for hackers. Unauthorized access to gaming accounts, financial fraud, and identity theft negatively impact consumer trust and can lead to financial losses for companies.
Additionally, concerns over in-game microtransactions and data collection practices have raised regulatory scrutiny, prompting stricter data protection laws. Game publishers must invest in robust security measures, such as encryption and multi-factor authentication, to safeguard user information. However, implementing stringent security protocols can increase operational costs and potentially impact user experience. As cyber threats evolve, maintaining a secure and privacy-compliant gaming environment will remain a key challenge for industry players.
By Device
The Mobile gaming segment accounted for the largest revenue share of 42% in 2023, fueled by the widespread adoption of smartphones, affordable internet access, and the growing popularity of mobile gaming apps. Major companies such as Tencent, Activision Blizzard, and miHoYo continue to dominate the market with high-grossing titles like Honor of Kings, Call of Duty: Mobile, and Genshin Impact.
In 2023, Apple introduced new hardware enhancements in the iPhone 15 series, featuring an improved GPU for better gaming performance, while Qualcomm launched the Snapdragon 8 Gen 3 chipset optimized for high-frame-rate mobile gaming.
Additionally, the expansion of cloud gaming services, including Microsoft’s Xbox Cloud Gaming and NVIDIA’s GeForce Now, is allowing users to play console-quality games on mobile devices, further boosting market growth.
The Console gaming segment is experiencing the highest growth rate, with a projected CAGR of 14.9% during the forecast period, driven by advancements in gaming hardware and exclusive game titles. Sony and Microsoft continue to lead with the PlayStation 5 and Xbox Series X|S, which offer superior graphics, faster load times, and high-performance capabilities.
In 2023, Sony introduced new PlayStation 5 variants, including a slimmer model with an optional detachable disc drive, while Microsoft expanded its Xbox Game Pass subscription service, enhancing digital gaming experiences.
By Type
The Online gaming segment held the largest revenue share in 2023, driven by the rapid expansion of cloud gaming, multiplayer experiences, and the increasing shift toward digital game distribution. Major industry players such as Microsoft, Sony, and Tencent have strengthened their online gaming presence through innovative platforms and services. Microsoft expanded its Xbox Cloud Gaming service, allowing players to stream high-quality games without the need for powerful hardware.
Sony enhanced PlayStation Plus, integrating cloud gaming features and a growing library of multiplayer games. Tencent continued its dominance in online gaming with titles like Honor of Kings and PUBG Mobile, leveraging live-service models and frequent content updates.
Additionally, Epic Games and Valve expanded their online storefronts, reinforcing digital game sales through platforms like the Epic Games Store and Steam. The rise of esports, in-game purchases, and cross-platform multiplayer functionalities further fueled online gaming adoption. As 5G networks improve connectivity and cloud infrastructure advances, online gaming is expected to maintain its dominance, shaping the future of the video game market.
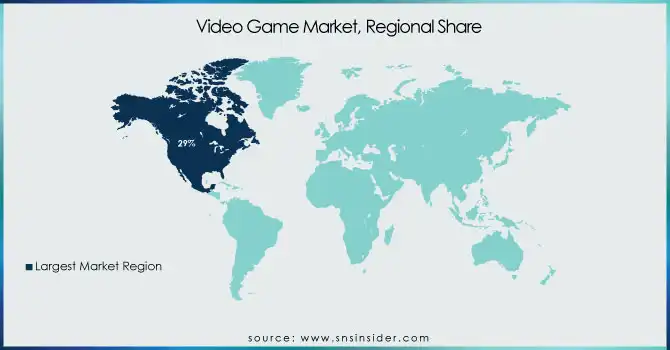
North America led the global video game market in 2023, holding an estimated market share of 29%, driven by strong consumer spending, advanced gaming infrastructure, and the presence of major industry players. Companies like Microsoft, Sony, and Electronic Arts (EA) continue to drive market dominance with successful game franchises, console sales, and digital services. Microsoft’s Xbox Game Pass has gained significant traction, offering a vast library of games on a subscription basis, while Sony’s PlayStation 5 remains one of the best-selling consoles in the region.
Additionally, the North American audience has a high preference for premium AAA games, with titles such as Call of Duty: Modern Warfare III and The Legend of Zelda: Tears of the Kingdom generating record-breaking sales. Strong adoption of new gaming technologies and digital monetization models solidifies North America’s leading position.
The Asia Pacific region is experiencing the highest growth in the video game market, with an estimated CAGR of 14.8%, driven by increasing smartphone penetration, rising esports popularity, and government support for gaming industries. Countries like China, Japan, and South Korea are at the forefront, with companies such as Tencent, NetEase, and Nintendo leading the market.
Additionally, the Indian gaming sector is booming due to the affordability of smartphones and the increasing popularity of mobile esports. With rising disposable incomes, evolving gaming habits, and government-backed gaming initiatives in countries like China and South Korea, the Asia Pacific region is poised for continued rapid expansion.
Get Customized Report as per Your Business Requirement - Enquiry Now
Some of the major players in the Video Game Market are:
Nintendo (Nintendo Switch, The Legend of Zelda: Tears of the Kingdom)
Rovio Entertainment Corporation (Angry Birds 2, Angry Birds Boom!)
Sony Interactive Entertainment Inc. (PlayStation 5, God of War: Ragnarok)
Tencent Holdings Ltd. (Honor of Kings, PUBG Mobile)
Activision Blizzard (Call of Duty: Modern Warfare III, Diablo IV)
Apple Inc. (Apple Arcade, App Store Gaming Platform)
Disney (Disney Dreamlight Valley, Marvel’s Spider-Man 2)
Electronic Arts Inc. (FIFA 24, Apex Legends)
Lucid Games (Destruction AllStars, Switchblade)
Microsoft Corp. (Xbox Series X, Halo Infinite)
September 2024: Rovio Entertainment, in collaboration with Play Mechanix and Raw Thrills, unveiled "Angry Birds Boom!", a new arcade game designed for family entertainment centers. The game features a 65-inch interactive LED display and allows up to two players to launch characters into destructible environments filled with adversaries. Attendees at the IAAPA Expo Europe in Amsterdam previewed the game, with global shipments commencing in late October.
January 2025: Microsoft announced plans to port select Xbox titles, including "Microsoft Flight Simulator 2024" and "Halo: The Master Chief Collection," to Nintendo's upcoming Switch 2 console. Phil Spencer, head of Microsoft's gaming division, expressed enthusiasm for supporting Nintendo's new platform. Further details are anticipated during Nintendo's "Nintendo Direct" event on April 2.
Report Attributes | Details |
---|---|
Market Size in 2023 | US$ 236.58 Billion |
Market Size by 2032 | US$ 723.41 Billion |
CAGR | CAGR of 13.3 % From 2024 to 2032 |
Base Year | 2023 |
Forecast Period | 2024-2032 |
Historical Data | 2020-2022 |
Report Scope & Coverage | Market Size, Segments Analysis, Competitive Landscape, Regional Analysis, DROC & SWOT Analysis, Forecast Outlook |
Key Segments | • By Device (Console, Mobile, Computer) • By Type (Online, Offline) |
Regional Analysis/Coverage | North America (US, Canada, Mexico), Europe (Eastern Europe [Poland, Romania, Hungary, Turkey, Rest of Eastern Europe] Western Europe] Germany, France, UK, Italy, Spain, Netherlands, Switzerland, Austria, Rest of Western Europe]), Asia Pacific (China, India, Japan, South Korea, Vietnam, Singapore, Australia, Rest of Asia Pacific), Middle East & Africa (Middle East [UAE, Egypt, Saudi Arabia, Qatar, Rest of Middle East], Africa [Nigeria, South Africa, Rest of Africa], Latin America (Brazil, Argentina, Colombia, Rest of Latin America) |
Company Profiles | Nintendo, Rovio Entertainment Corporation, Sony Interactive Entertainment Inc., Tencent Holdings Ltd., Activision Blizzard, Apple Inc., Disney, Electronic Arts Inc., Lucid Games, Microsoft Corp. |
Ans: The Video Game Market is expected to grow at a CAGR of 13.3% during 2024-2032.
Ans: The Video Game Market size was USD 236.58 billion in 2023 and is expected to Reach USD 723.41 billion by 2032.
Ans: The major growth factor of the video game market is the rising adoption of digital gaming, cloud gaming, and immersive technologies like AR/VR, driven by increasing internet penetration and mobile gaming expansion.
Ans: The Mobile segment dominated the Video Game Market.
Ans: North America dominated the Video Game Market in 2023.
Table of Content
1. Introduction
1.1 Market Definition
1.2 Scope (Inclusion and Exclusions)
1.3 Research Assumptions
2. Executive Summary
2.1 Market Overview
2.2 Regional Synopsis
2.3 Competitive Summary
3. Research Methodology
3.1 Top-Down Approach
3.2 Bottom-up Approach
3.3. Data Validation
3.4 Primary Interviews
4. Market Dynamics Impact Analysis
4.1 Market Driving Factors Analysis
4.1.2 Drivers
4.1.2 Restraints
4.1.3 Opportunities
4.1.4 Challenges
4.2 PESTLE Analysis
4.3 Porter’s Five Forces Model
5. Statistical Insights and Trends Reporting
5.1 Player Engagement Metrics (2023)
5.2 Esports and Streaming Statistics
5.3 Consumer Spending Trends (2023)
5.4 Employment and Workforce Data
6. Competitive Landscape
6.1 List of Major Companies, By Region
6.2 Market Share Analysis, By Region
6.3 Product Benchmarking
6.3.1 Product specifications and features
6.3.2 Pricing
6.4 Strategic Initiatives
6.4.1 Marketing and promotional activities
6.4.2 Distribution and supply chain strategies
6.4.3 Expansion plans and new product launches
6.4.4 Strategic partnerships and collaborations
6.5 Technological Advancements
6.6 Market Positioning and Branding
7. Video Game Market Segmentation, By Device
7.1 Chapter Overview
7.2 Console
7.2.1 Console Market Trends Analysis (2020-2032)
7.2.2 Console Market Size Estimates and Forecasts to 2032 (USD Billion)
7.3 Mobile
7.3.1 Mobile Market Trends Analysis (2020-2032)
7.3.2 Mobile Market Size Estimates and Forecasts to 2032 (USD Billion)
7.5 Computer
7.5.1 Computer Market Trends Analysis (2020-2032)
7.5.2 Computer Market Size Estimates and Forecasts to 2032 (USD Billion)
8. Video Game Market Segmentation, By Type
8.1 Chapter Overview
8.2 Online
8.2.1 Online Market Trends Analysis (2020-2032)
8.2.2 Online Market Size Estimates and Forecasts to 2032 (USD Billion)
8.3 Offline
8.3.1 Offline Market Trends Analysis (2020-2032)
8.3.2 Offline Market Size Estimates and Forecasts to 2032 (USD Billion)
9. Regional Analysis
9.1 Chapter Overview
9.2 North America
9.2.1 Trends Analysis
9.2.2 North America Video Game Market Estimates and Forecasts, by Country (2020-2032) (USD Billion)
9.2.3 North America Video Game Market Estimates and Forecasts, By Device (2020-2032) (USD Billion)
9.2.4 North America Video Game Market Estimates and Forecasts, By Type (2020-2032) (USD Billion)
9.2.5 USA
9.2.5.1 USA Video Game Market Estimates and Forecasts, By Device (2020-2032) (USD Billion)
9.2.5.2 USA Video Game Market Estimates and Forecasts, By Type (2020-2032) (USD Billion)
9.2.6 Canada
9.2.6.1 Canada Video Game Market Estimates and Forecasts, By Device (2020-2032) (USD Billion)
9.2.6.2 Canada Video Game Market Estimates and Forecasts, By Type (2020-2032) (USD Billion)
9.2.7 Mexico
9.2.7.1 Mexico Video Game Market Estimates and Forecasts, By Device (2020-2032) (USD Billion)
9.2.7.2 Mexico Video Game Market Estimates and Forecasts, By Type (2020-2032) (USD Billion)
9.3 Europe
9.3.1 Eastern Europe
9.3.1.1 Trends Analysis
9.3.1.2 Eastern Europe Video Game Market Estimates and Forecasts, by Country (2020-2032) (USD Billion)
9.3.1.3 Eastern Europe Video Game Market Estimates and Forecasts, By Device (2020-2032) (USD Billion)
9.3.1.4 Eastern Europe Video Game Market Estimates and Forecasts, By Type (2020-2032) (USD Billion)
9.3.1.5 Poland
9.3.1.5.1 Poland Video Game Market Estimates and Forecasts, By Device (2020-2032) (USD Billion)
9.3.1.5.2 Poland Video Game Market Estimates and Forecasts, By Type (2020-2032) (USD Billion)
9.3.1.6 Romania
9.3.1.6.1 Romania Video Game Market Estimates and Forecasts, By Device (2020-2032) (USD Billion)
9.3.1.6.2 Romania Video Game Market Estimates and Forecasts, By Type (2020-2032) (USD Billion)
9.3.1.7 Hungary
9.3.1.7.1 Hungary Video Game Market Estimates and Forecasts, By Device (2020-2032) (USD Billion)
9.3.1.7.2 Hungary Video Game Market Estimates and Forecasts, By Type (2020-2032) (USD Billion)
9.3.1.8 Turkey
9.3.1.8.1 Turkey Video Game Market Estimates and Forecasts, By Device (2020-2032) (USD Billion)
9.3.1.8.2 Turkey Video Game Market Estimates and Forecasts, By Type (2020-2032) (USD Billion)
9.3.1.9 Rest of Eastern Europe
9.3.1.9.1 Rest of Eastern Europe Video Game Market Estimates and Forecasts, By Device (2020-2032) (USD Billion)
9.3.1.9.2 Rest of Eastern Europe Video Game Market Estimates and Forecasts, By Type (2020-2032) (USD Billion)
9.3.2 Western Europe
9.3.2.1 Trends Analysis
9.3.2.2 Western Europe Video Game Market Estimates and Forecasts, by Country (2020-2032) (USD Billion)
9.3.2.3 Western Europe Video Game Market Estimates and Forecasts, By Device (2020-2032) (USD Billion)
9.3.2.4 Western Europe Video Game Market Estimates and Forecasts, By Type (2020-2032) (USD Billion)
9.3.2.5 Germany
9.3.2.5.1 Germany Video Game Market Estimates and Forecasts, By Device (2020-2032) (USD Billion)
9.3.2.5.2 Germany Video Game Market Estimates and Forecasts, By Type (2020-2032) (USD Billion)
9.3.2.6 France
9.3.2.6.1 France Video Game Market Estimates and Forecasts, By Device (2020-2032) (USD Billion)
9.3.2.6.2 France Video Game Market Estimates and Forecasts, By Type (2020-2032) (USD Billion)
9.3.2.7 UK
9.3.2.7.1 UK Video Game Market Estimates and Forecasts, By Device (2020-2032) (USD Billion)
9.3.2.7.2 UK Video Game Market Estimates and Forecasts, By Type (2020-2032) (USD Billion)
9.3.2.8 Italy
9.3.2.8.1 Italy Video Game Market Estimates and Forecasts, By Device (2020-2032) (USD Billion)
9.3.2.8.2 Italy Video Game Market Estimates and Forecasts, By Type (2020-2032) (USD Billion)
9.3.2.9 Spain
9.3.2.9.1 Spain Video Game Market Estimates and Forecasts, By Device (2020-2032) (USD Billion)
9.3.2.9.2 Spain Video Game Market Estimates and Forecasts, By Type (2020-2032) (USD Billion)
9.3.2.10 Netherlands
9.3.2.10.1 Netherlands Video Game Market Estimates and Forecasts, By Device (2020-2032) (USD Billion)
9.3.2.10.2 Netherlands Video Game Market Estimates and Forecasts, By Type (2020-2032) (USD Billion)
9.3.2.11 Switzerland
9.3.2.11.1 Switzerland Video Game Market Estimates and Forecasts, By Device (2020-2032) (USD Billion)
9.3.2.11.2 Switzerland Video Game Market Estimates and Forecasts, By Type (2020-2032) (USD Billion)
9.3.2.12 Austria
9.3.2.12.1 Austria Video Game Market Estimates and Forecasts, By Device (2020-2032) (USD Billion)
9.3.2.12.2 Austria Video Game Market Estimates and Forecasts, By Type (2020-2032) (USD Billion)
9.3.2.13 Rest of Western Europe
9.3.2.13.1 Rest of Western Europe Video Game Market Estimates and Forecasts, By Device (2020-2032) (USD Billion)
9.3.2.13.2 Rest of Western Europe Video Game Market Estimates and Forecasts, By Type (2020-2032) (USD Billion)
9.4 Asia Pacific
9.4.1 Trends Analysis
9.4.2 Asia Pacific Video Game Market Estimates and Forecasts, by Country (2020-2032) (USD Billion)
9.4.3 Asia Pacific Video Game Market Estimates and Forecasts, By Device (2020-2032) (USD Billion)
9.4.4 Asia Pacific Video Game Market Estimates and Forecasts, By Type (2020-2032) (USD Billion)
9.4.5 China
9.4.5.1 China Video Game Market Estimates and Forecasts, By Device (2020-2032) (USD Billion)
9.4.5.2 China Video Game Market Estimates and Forecasts, By Type (2020-2032) (USD Billion)
9.4.6 India
9.4.5.1 India Video Game Market Estimates and Forecasts, By Device (2020-2032) (USD Billion)
9.4.5.2 India Video Game Market Estimates and Forecasts, By Type (2020-2032) (USD Billion)
9.4.5 Japan
9.4.5.1 Japan Video Game Market Estimates and Forecasts, By Device (2020-2032) (USD Billion)
9.4.5.2 Japan Video Game Market Estimates and Forecasts, By Type (2020-2032) (USD Billion)
9.4.6 South Korea
9.4.6.1 South Korea Video Game Market Estimates and Forecasts, By Device (2020-2032) (USD Billion)
9.4.6.2 South Korea Video Game Market Estimates and Forecasts, By Type (2020-2032) (USD Billion)
9.4.7 Vietnam
9.4.7.1 Vietnam Video Game Market Estimates and Forecasts, By Device (2020-2032) (USD Billion)
9.2.7.2 Vietnam Video Game Market Estimates and Forecasts, By Type (2020-2032) (USD Billion)
9.4.8 Singapore
9.4.8.1 Singapore Video Game Market Estimates and Forecasts, By Device (2020-2032) (USD Billion)
9.4.8.2 Singapore Video Game Market Estimates and Forecasts, By Type (2020-2032) (USD Billion)
9.4.9 Australia
9.4.9.1 Australia Video Game Market Estimates and Forecasts, By Device (2020-2032) (USD Billion)
9.4.9.2 Australia Video Game Market Estimates and Forecasts, By Type (2020-2032) (USD Billion)
9.4.10 Rest of Asia Pacific
9.4.10.1 Rest of Asia Pacific Video Game Market Estimates and Forecasts, By Device (2020-2032) (USD Billion)
9.4.10.2 Rest of Asia Pacific Video Game Market Estimates and Forecasts, By Type (2020-2032) (USD Billion)
9.5 Middle East and Africa
9.5.1 Middle East
9.5.1.1 Trends Analysis
9.5.1.2 Middle East Video Game Market Estimates and Forecasts, by Country (2020-2032) (USD Billion)
9.5.1.3 Middle East Video Game Market Estimates and Forecasts, By Device (2020-2032) (USD Billion)
9.5.1.4 Middle East Video Game Market Estimates and Forecasts, By Type (2020-2032) (USD Billion)
9.5.1.5 UAE
9.5.1.5.1 UAE Video Game Market Estimates and Forecasts, By Device (2020-2032) (USD Billion)
9.5.1.5.2 UAE Video Game Market Estimates and Forecasts, By Type (2020-2032) (USD Billion)
9.5.1.6 Egypt
9.5.1.6.1 Egypt Video Game Market Estimates and Forecasts, By Device (2020-2032) (USD Billion)
9.5.1.6.2 Egypt Video Game Market Estimates and Forecasts, By Type (2020-2032) (USD Billion)
9.5.1.7 Saudi Arabia
9.5.1.7.1 Saudi Arabia Video Game Market Estimates and Forecasts, By Device (2020-2032) (USD Billion)
9.5.1.7.2 Saudi Arabia Video Game Market Estimates and Forecasts, By Type (2020-2032) (USD Billion)
9.5.1.8 Qatar
9.5.1.8.1 Qatar Video Game Market Estimates and Forecasts, By Device (2020-2032) (USD Billion)
9.5.1.8.2 Qatar Video Game Market Estimates and Forecasts, By Type (2020-2032) (USD Billion)
9.5.1.9 Rest of Middle East
9.5.1.9.1 Rest of Middle East Video Game Market Estimates and Forecasts, By Device (2020-2032) (USD Billion)
9.5.1.9.2 Rest of Middle East Video Game Market Estimates and Forecasts, By Type (2020-2032) (USD Billion)
9.5.2 Africa
9.5.2.1 Trends Analysis
9.5.2.2 Africa Video Game Market Estimates and Forecasts, by Country (2020-2032) (USD Billion)
9.5.2.3 Africa Video Game Market Estimates and Forecasts, By Device (2020-2032) (USD Billion)
9.5.2.4 Africa Video Game Market Estimates and Forecasts, By Type (2020-2032) (USD Billion)
9.5.2.5 South Africa
9.5.2.5.1 South Africa Video Game Market Estimates and Forecasts, By Device (2020-2032) (USD Billion)
9.5.2.5.2 South Africa Video Game Market Estimates and Forecasts, By Type (2020-2032) (USD Billion)
9.5.2.6 Nigeria
9.5.2.6.1 Nigeria Video Game Market Estimates and Forecasts, By Device (2020-2032) (USD Billion)
9.5.2.6.2 Nigeria Video Game Market Estimates and Forecasts, By Type (2020-2032) (USD Billion)
9.5.2.7 Rest of Africa
9.5.2.7.1 Rest of Africa Video Game Market Estimates and Forecasts, By Device (2020-2032) (USD Billion)
9.5.2.7.2 Rest of Africa Video Game Market Estimates and Forecasts, By Type (2020-2032) (USD Billion)
9.6 Latin America
9.6.1 Trends Analysis
9.6.2 Latin America Video Game Market Estimates and Forecasts, by Country (2020-2032) (USD Billion)
9.6.3 Latin America Video Game Market Estimates and Forecasts, By Device (2020-2032) (USD Billion)
9.6.4 Latin America Video Game Market Estimates and Forecasts, By Type (2020-2032) (USD Billion)
9.6.5 Brazil
9.6.5.1 Brazil Video Game Market Estimates and Forecasts, By Device (2020-2032) (USD Billion)
9.6.5.2 Brazil Video Game Market Estimates and Forecasts, By Type (2020-2032) (USD Billion)
9.6.6 Argentina
9.6.6.1 Argentina Video Game Market Estimates and Forecasts, By Device (2020-2032) (USD Billion)
9.6.6.2 Argentina Video Game Market Estimates and Forecasts, By Type (2020-2032) (USD Billion)
9.6.7 Colombia
9.6.7.1 Colombia Video Game Market Estimates and Forecasts, By Device (2020-2032) (USD Billion)
9.6.7.2 Colombia Video Game Market Estimates and Forecasts, By Type (2020-2032) (USD Billion)
9.6.8 Rest of Latin America
9.6.8.1 Rest of Latin America Video Game Market Estimates and Forecasts, By Device (2020-2032) (USD Billion)
9.6.8.2 Rest of Latin America Video Game Market Estimates and Forecasts, By Type (2020-2032) (USD Billion)
10. Company Profiles
10.1 Nintendo
10.1.1 Company Overview
10.1.2 Financial
10.1.3 Products/ Services Offered
110.1.4 SWOT Analysis
10.2 Rovio Entertainment Corporation
10.2.1 Company Overview
10.2.2 Financial
10.2.3 Products/ Services Offered
10.2.4 SWOT Analysis
10.3 Sony Interactive Entertainment Inc.
10.3.1 Company Overview
10.3.2 Financial
10.3.3 Products/ Services Offered
10.3.4 SWOT Analysis
10.4 Tencent Holdings Ltd.
10.4.1 Company Overview
10.4.2 Financial
10.4.3 Products/ Services Offered
10.4.4 SWOT Analysis
10.5 Activision Blizzard
10.5.1 Company Overview
10.5.2 Financial
10.5.3 Products/ Services Offered
10.5.4 SWOT Analysis
10.6 Apple Inc.
10.6.1 Company Overview
10.6.2 Financial
10.6.3 Products/ Services Offered
10.6.4 SWOT Analysis
10.7 Disney
10.7.1 Company Overview
10.7.2 Financial
10.7.3 Products/ Services Offered
10.7.4 SWOT Analysis
10.8 Electronic Arts Inc.
10.8.1 Company Overview
10.8.2 Financial
10.8.3 Products/ Services Offered
10.8.4 SWOT Analysis
10.9 Lucid Games
10.9.1 Company Overview
10.9.2 Financial
10.9.3 Products/ Services Offered
10.9.4 SWOT Analysis
10.10 Microsoft Corp.
10.9.1 Company Overview
10.9.2 Financial
10.9.3 Products/ Services Offered
10.9.4 SWOT Analysis
11. Use Cases and Best Practices
12. Conclusion
An accurate research report requires proper strategizing as well as implementation. There are multiple factors involved in the completion of good and accurate research report and selecting the best methodology to compete the research is the toughest part. Since the research reports we provide play a crucial role in any company’s decision-making process, therefore we at SNS Insider always believe that we should choose the best method which gives us results closer to reality. This allows us to reach at a stage wherein we can provide our clients best and accurate investment to output ratio.
Each report that we prepare takes a timeframe of 350-400 business hours for production. Starting from the selection of titles through a couple of in-depth brain storming session to the final QC process before uploading our titles on our website we dedicate around 350 working hours. The titles are selected based on their current market cap and the foreseen CAGR and growth.
The 5 steps process:
Step 1: Secondary Research:
Secondary Research or Desk Research is as the name suggests is a research process wherein, we collect data through the readily available information. In this process we use various paid and unpaid databases which our team has access to and gather data through the same. This includes examining of listed companies’ annual reports, Journals, SEC filling etc. Apart from this our team has access to various associations across the globe across different industries. Lastly, we have exchange relationships with various university as well as individual libraries.
Step 2: Primary Research
When we talk about primary research, it is a type of study in which the researchers collect relevant data samples directly, rather than relying on previously collected data. This type of research is focused on gaining content specific facts that can be sued to solve specific problems. Since the collected data is fresh and first hand therefore it makes the study more accurate and genuine.
We at SNS Insider have divided Primary Research into 2 parts.
Part 1 wherein we interview the KOLs of major players as well as the upcoming ones across various geographic regions. This allows us to have their view over the market scenario and acts as an important tool to come closer to the accurate market numbers. As many as 45 paid and unpaid primary interviews are taken from both the demand and supply side of the industry to make sure we land at an accurate judgement and analysis of the market.
This step involves the triangulation of data wherein our team analyses the interview transcripts, online survey responses and observation of on filed participants. The below mentioned chart should give a better understanding of the part 1 of the primary interview.
Part 2: In this part of primary research the data collected via secondary research and the part 1 of the primary research is validated with the interviews from individual consultants and subject matter experts.
Consultants are those set of people who have at least 12 years of experience and expertise within the industry whereas Subject Matter Experts are those with at least 15 years of experience behind their back within the same space. The data with the help of two main processes i.e., FGDs (Focused Group Discussions) and IDs (Individual Discussions). This gives us a 3rd party nonbiased primary view of the market scenario making it a more dependable one while collation of the data pointers.
Step 3: Data Bank Validation
Once all the information is collected via primary and secondary sources, we run that information for data validation. At our intelligence centre our research heads track a lot of information related to the market which includes the quarterly reports, the daily stock prices, and other relevant information. Our data bank server gets updated every fortnight and that is how the information which we collected using our primary and secondary information is revalidated in real time.
Step 4: QA/QC Process
After all the data collection and validation our team does a final level of quality check and quality assurance to get rid of any unwanted or undesired mistakes. This might include but not limited to getting rid of the any typos, duplication of numbers or missing of any important information. The people involved in this process include technical content writers, research heads and graphics people. Once this process is completed the title gets uploader on our platform for our clients to read it.
Step 5: Final QC/QA Process:
This is the last process and comes when the client has ordered the study. In this process a final QA/QC is done before the study is emailed to the client. Since we believe in giving our clients a good experience of our research studies, therefore, to make sure that we do not lack at our end in any way humanly possible we do a final round of quality check and then dispatch the study to the client.
Key Segments:
By Device
Console
Mobile
Computer
By Type
Online
Offline
Request for Segment Customization as per your Business Requirement: Segment Customization Request
Regional Coverage:
North America
US
Canada
Mexico
Europe
Eastern Europe
Poland
Romania
Hungary
Turkey
Rest of Eastern Europe
Western Europe
Germany
France
UK
Italy
Spain
Netherlands
Switzerland
Austria
Rest of Western Europe
Asia Pacific
China
India
Japan
South Korea
Vietnam
Singapore
Australia
Rest of Asia Pacific
Middle East & Africa
Middle East
UAE
Egypt
Saudi Arabia
Qatar
Rest of Middle East
Africa
Nigeria
South Africa
Rest of Africa
Latin America
Brazil
Argentina
Colombia
Rest of Latin America
Request for Country Level Research Report: Country Level Customization Request
Available Customization
With the given market data, SNS Insider offers customization as per the company’s specific needs. The following customization options are available for the report:
Detailed Volume Analysis
Criss-Cross segment analysis (e.g. Product X Application)
Competitive Product Benchmarking
Geographic Analysis
Additional countries in any of the regions
Customized Data Representation
Detailed analysis and profiling of additional market players
The Managed Print Services (MPS) Market was valued at USD 44.9 billion in 2023 and will reach USD 96.1 Billion by 2032, growing at a CAGR of 8.85% by 2032.
QR Code Payments Market was valued at USD 11.8 billion in 2023 and is expected to reach USD 45.9 billion by 2032, growing at a CAGR of 16.27% over 2024-2032.
The Connected Mining Market Size was USD 12.80 billion in 2023 and is expected to reach USD 31.31 Bn by 2032, growing at a CAGR of 10.48% by 2024-2032.
Data Analytics Outsourcing Market Size was valued at USD 11.49 Billion in 2023 and is expected to reach USD 164.33 Billion by 2032 and grow at a CAGR of 34.43% over the forecast period 2024-2032.
The Digital Rights Management Market size was USD 4.9 Billion in 2023, will reach to USD 15.2 Billion by 2032 and grow at a CAGR of 14% by 2024-2032.
Big Data as a Service (BDaaS) market was valued at USD 26.9 billion in 2023 and will reach USD 155.8 Billion by 2032, growing at a CAGR of 21.59% by 2032.
Hi! Click one of our member below to chat on Phone