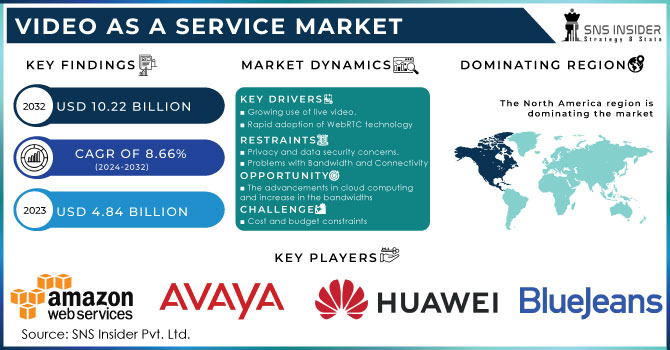
Video as a Service Market Size was valued at USD 5.53 Billion in 2023 and is expected to reach USD 20.35 Billion by 2032 and grow at a CAGR of 15.58% over the forecast period 2024-2032. Our research report indicated adoption rates per industry, organisations using cloud video services, a growth in a number of videos streamed on respective platforms, as well as a revenue per the average user obtained from Video as a Service (VaaS) solutions. Others include statistics which show the actual retention rate concerning customers and various consumption patterns from video-on-demand.
Get more information on Video as a Service (VaaS) Market - Request Sample Report
Drivers:
High-performance, scalable video solutions with optimal cost are seen to drive market demand in this VaaS landscape.
The demand for video-as-a-service (VaaS) is mainly driven by the growing need for cost-effective, scalable, and high-quality video solutions. Due to the flexibility and reduced infrastructure costs, businesses are opting for cloud-based VaaS platforms. Cloud-based solutions are also more reliable, offering high-definition video streaming and improved user experience. With the rapid adoption of remote work, online education and virtual events, VaaS is amplifying demand for such service - per government sources, increased customer engagement for business using VaaS platforms to such an extent that almost half of them now use video conferencing and live streaming in their daily operations.
Advancements in 5G networks are helping push VaaS adoption through enhanced streaming quality and expanding access to real-time video collaboration. The need for seamless integration of video with other enterprise systems, including CRM and marketing automation tools, also fuels this trend. As businesses shift to more flexible and remote models, VaaS is integral to staying competitive.
Restrain:
High initial setup costs and integration complexity may restrict Video as a Service Market growth.
The most significant challenges in the Video as a Service Market are high initial setup costs and integration complexity. Organizations face barriers when adopting cloud-based video solutions because of substantial upfront investments in technology infrastructure and training. Integration with legacy systems, such as CRM tools and content management systems, requires a lot of time, effort, and resources. Organizations generally also experience challenges with respect to the transition of their on-premise video systems to the cloud.
According to U.S. Department of Commerce reports, around one third of SMEs consider the solutions offered by cloud-based providers to be too expensive for deployment. VaaS platforms are also complex, and implementing them can prove challenging for large organizations, particularly when integrating them with other business applications. Despite these hurdles, however, vendors are trying to streamline the adoption process with much more user-friendly solutions; overcoming these hurdles is critical for broad market growth.
Opportunities:
The rising demand for remote collaboration and virtual events offers significant opportunities.
The revolution in remote work, telecommuting, and virtual events opens up a tremendous growth opportunity for the Video as a Service (VaaS) market. Because of flexible work environments and distributed workforces, the demand for cloud-based video solutions has increased much faster than ever. Governments around the world note that the workforce is now heading toward remote and dispersed positions, with the U.S. Bureau of Labour Statistics shows upto 25% rise in telecommuting during the past three years.
Virtual events, webinars, and online training will remain on the rise as organizations increasingly seek to engage employees and customers remotely. VaaS has become necessary for businesses that seek scalable, high-quality video streaming solutions to stay productive, collaborate, and engage with customers in a virtual setting. The Video as a Service Market is projected to grow fast as demand for virtual events and online learning rises. Education, healthcare, and professional services sectors are expected to be the greatest beneficiaries of such growth. Thus, this presents an opportunity for vendors to innovate and capture more market share.
Challenges:
Network latency and bandwidth limitations are significant challenges for VaaS platforms.
One of the key challenges facing the Video as a Service Market is network latency and bandwidth constraints, which are critical in the quality of video streaming and collaboration. Because VaaS depends significantly on internet connectivity for real-time communication, any disruption or degradation in network performance can result in poor video quality, interruptions, or delays. In a study of the government, one can see that broadband infrastructure remains inadequate in rural and underserved areas, which affects the reliability of cloud-based services such as VaaS.
The Federal Communications Commission (FCC) estimated that close to 7 million Americans lack access to high-speed broadband. Network congestion is also common, especially in urban centers at peak usage times. VaaS providers are working on optimizing content delivery through edge computing and regional data centers to address this challenge, but overcoming this issue is still a significant hurdle. These challenges are expected to be mitigated in the future with better internet infrastructure and the rollout of 5G technology.
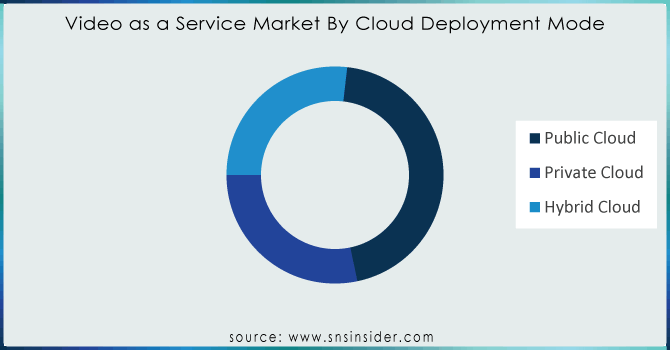
By Cloud Deployment Mode
The Public Cloud was the dominant segment for Video as a Service Market in 2023 with around 44% market share. Public Cloud solutions offer scalability, cost efficiency, and accessibility, which is a strong draw for businesses that wish to avoid the overhead of on-premise infrastructure. In an ongoing trend towards cloud-based services in every industry, Public Cloud solutions will likely remain on top. The segment is expected to grow with the fastest CAGR of 15.67% in the forecast period from 2024 to 2032. The growth is attributed to factors such as increasing demand for flexible and scalable video solutions, remote work, and seamless content delivery.
With the growth in cloud services, this means that various cloud providers are looking to improve their service to better meet the needs of businesses, such as streaming high-quality videos and making real-time communication more robust. Many companies will also be highly likely to shift to public cloud services considering the reduction of costs in infrastructure management and its increase in security measures for SMEs. Private and Hybrid Cloud deployments also make up some portion of the market, mainly due to businesses with unique security or compliance requirements. However, the entire market is still heavily skewed towards the segment of the public cloud, which most businesses opt for VaaS solutions.
By Vertical
The Education segment dominated the Video as a Service Market in 2023, commanding 21% of the market share. Distance learning and virtual classrooms are considered essential to today's education delivery. VaaS platforms provide schools with an effortless way of having online classes, webinars, and virtual collaboration, hence holding a great significance for K-12 as well as higher educational institutions. There has been a rise in the adoption of video-based learning tools, particularly with added interactive elements to promote engagement and bring education closer to more minds.
The Media & Entertainment segment is projected to grow with the fastest CAGR of 16.82% in the forecast period from 2024 to 2032. Rising demands for video streaming services, live events, and content creation tools have been accelerating this growth. Media and entertainment businesses use VaaS to provide High-Definition Video Streaming, deliver personal content in real-time broadcast. Over the Top (OTT) platforms as well as various social media outlets also add their fair share into creating the scalability video infrastructure of OTT which makes VaaS even more on demand in fulfilling consumers' ever increasing expectations regarding on-demand video contents worldwide. Other things being equal, video content production through AI/AR integration would have a profound growth impact, which would emerge as a high-potential area for VaaS.
By Application
The Corporate Communications segment showed the highest share of the market in 2023 at 29%, driven by the increasing demand for seamless communication and collaboration tools across enterprise-sized organizations. VaaS solutions facilitate video conferences, webinars, and internal communication, allowing organizations to improve employee engagement, productivity, and decision-making. That said, this segment has seen much adoption, particularly driven by the trend of hybrid and remote work, which actually requires much virtual face-to-face interaction.
On the other hand, the Broadcast Distribution segment is expected to grow with the fastest CAGR of 16.48% in the forecast period from 2024 to 2032. With the rapid expansion of live streaming services, sports broadcasts, and real-time video distribution, the demand for reliable broadcast infrastructure has surged. This facilitates the delivery of high-quality video to global audiences with minimal latency, opening new opportunities for both broadcasters, news agencies, and event organizers. With the proliferation of platforms like YouTube, Twitch, and more live-streaming services, demand for video distribution solutions is rapidly growing. In addition, with the development of 5G networks and cloud technology, the Broadcast Distribution segment is expected to continue its growth, enabling providers to offer more services and satisfy consumer demand for instant, high-definition video content.
Need any customization research/data on Video as a Service (VaaS) Market - Enquiry Now
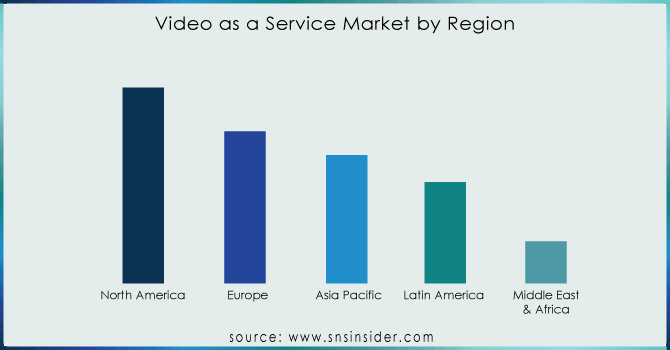
The Video as a Service (VaaS) market is growing rapidly across various geographies, with North America and Asia Pacific emerging as the dominant regions. North America region is leading the pack in 2023, and this is with a 40% market share. This comes about as the region is fast embracing cloud-based video solutions. The United States contributes highly towards the Video as a Service Market because the country hosts significant technology companies along with advanced digital infrastructure. North American businesses, including media, education, healthcare, and corporate sectors, are increasingly using VaaS solutions to improve collaboration, enhance customer engagement, and streamline operations. Advanced cloud services and high-speed internet are also contributing to the region's dominance in the Video as a Service Market.
The Asia Pacific region is projected to lead in terms of growth, with the highest CAGR of 16.18% during the forecast period from 2024 to 2032. For instance, this region has highly developed countries such as China, India, and Japan that have internet penetration at a rapid pace; therefore, the demand for video content surges. The growing middle class in the region, increased access to the internet, and increased demand for on-demand video services are driving the demand for VaaS platforms. The increasing number of remote workers, educational institutions shifting to e-learning, and the rise of streaming platforms further boost the market in this region. The Asia Pacific governments also are encouraging the development of digital initiatives and investment in broadband infrastructure, which should help increase adoption of cloud-based video solutions.
Some of the Major Players in the Video as a Service Market Are
Zoom Video Communications (Zoom Meetings, Zoom Video Webinars)
Vimeo (Vimeo Live, Vimeo OTT)
Cisco Systems, inc (Webex, Cisco Video Surveillance)
Microsoft (Microsoft Teams, Skype for Business)
Amazon web service, inc (Amazon Chime, AWS Media Services)
Google Cloud (Google Meet, YouTube Live)
IBM (IBM Watson Media, IBM Cloud Video)
Brightcove (Brightcove Video Cloud, Brightcove Live)
Kaltura (Kaltura Video Platform, Kaltura Live)
Vonage (Vonage Video Conferencing, Vonage Business Communications)
Adobe (Adobe Connect, Adobe Primetime)
Logitech (Logitech MeetUp, Logitech Rally)
Pexip (Pexip Infinity, Pexip Cloud)
Panasonic (Panasonic Video Conferencing Solutions, Panasonic Live Streaming)
Vidyo (VidyoConnect, Vidyo.io)
PandaStream (PandaStream Cloud Video, PandaStream Live)
Wowza Media Systems (Wowza Streaming Engine, Wowza Cloud)
BlueJeans (BlueJeans Meetings, BlueJeans Events)
Tencent (Tencent Cloud, Tencent Meeting)
Alibaba Cloud (Alibaba Cloud Video, Aliyun Video Streaming)
Major Suppliers (Components, Technologies)
Intel (Semiconductors, Processors)
NVIDIA (Graphics Processing Units, AI Technology)
Qualcomm (Chipsets, Networking Solutions)
Broadcom (Networking Components, Communication Chips)
Microsoft (Cloud Infrastructure, Azure Data Centers)
Amazon (AWS Servers, Storage Solutions)
Akamai Technologies (CDN Services, Security Solutions)
Cisco Systems (Network Routers, Switches)
Arista Networks (Switching Technology, Cloud Networking Solutions)
Hewlett Packard Enterprise (HPE) (Servers, Storage Devices)
Major Clients
Amazon
Microsoft
Tesla
Apple
IBM
Deloitte
Accenture
University of California
HSBC
December 2024: Zoom is enabling its channel partners through the release of its new video SDK resale service. The Zoom Video SDK is now available, and the company is positioning it as a fully programmable software development kit that allows customers to integrate Zoom's core technologies—video, audio, screen sharing, and chat—into their products.
July 2024: Vimeo releases AI video translation for business users. The new feature will reportedly translate videos into any of up to 29 languages, recreating the voice and patterns of speech of the people shown.
| Report Attributes | Details |
|---|---|
| Market Size in 2023 | US$ 5.53 Billion |
| Market Size by 2032 | US$ 20.35 Billion |
| CAGR | CAGR of 15.18 % From 2024 to 2032 |
| Base Year | 2023 |
| Forecast Period | 2024-2032 |
| Historical Data | 2020-2022 |
| Report Scope & Coverage | Market Size, Segments Analysis, Competitive Landscape, Regional Analysis, DROC & SWOT Analysis, Forecast Outlook |
| Key Segments | • By Application (Corporate Communications, Training & Development, Marketing & Client Engagement, Broadcast Distribution, Content Creation & Management, Other), • By Cloud Deployment Mode (Public Cloud, Private Cloud, Hybrid Cloud), • By Vertical (BFSI, Healthcare & Life Sciences, Retail & E-Commerce, IT & Telecom, Education, Government and Public Sector, Media and Entertainment, Others) |
| Regional Analysis/Coverage | North America (US, Canada, Mexico), Europe (Eastern Europe [Poland, Romania, Hungary, Turkey, Rest of Eastern Europe] Western Europe] Germany, France, UK, Italy, Spain, Netherlands, Switzerland, Austria, Rest of Western Europe]), Asia Pacific (China, India, Japan, South Korea, Vietnam, Singapore, Australia, Rest of Asia Pacific), Middle East & Africa (Middle East [UAE, Egypt, Saudi Arabia, Qatar, Rest of Middle East], Africa [Nigeria, South Africa, Rest of Africa], Latin America (Brazil, Argentina, Colombia, Rest of Latin America) |
| Company Profiles | Zoom Video Communications, Vimeo, Cisco Systems, Microsoft, Amazon Web Services (AWS), Google Cloud, IBM, Brightcove, Kaltura, Vonage, Adobe, Logitech, Pexip, Panasonic, Vidyo, PandaStream, Wowza Media Systems, BlueJeans, Tencent, Alibaba Cloud. |
Ans: The Video as a Service Market is expected to grow at a CAGR of 15.58% during 2024-2032.
Ans: Video as a Service Market size was USD 5.53 Billion in 2023 and is expected to Reach USD 20.35 Billion by 2032.
Ans: The major growth factors of the Video as a Service Market is High-performance, scalable video solutions with optimal cost.
Ans: The Education segment dominated the Video as a Service Market.
Ans: North America dominated the Video as a Service Market in 2023.
Table of Content
1. Introduction
1.1 Market Definition
1.2 Scope (Inclusion and Exclusions)
1.3 Research Assumptions
2. Executive Summary
2.1 Market Overview
2.2 Regional Synopsis
2.3 Competitive Summary
3. Research Methodology
3.1 Top-Down Approach
3.2 Bottom-up Approach
3.3. Data Validation
3.4 Primary Interviews
4. Market Dynamics Impact Analysis
4.1 Market Driving Factors Analysis
4.1.1 Drivers
4.1.2 Restraints
4.1.3 Opportunities
4.1.4 Challenges
4.2 PESTLE Analysis
4.3 Porter’s Five Forces Model
5. Statistical Insights and Trends Reporting
5.1 Revenue per the Average User
5.2 Consumption Patterns from Video-On-Demand
5.3 Usage Statistics, 2023
6. Competitive Landscape
6.1 List of Major Companies, By Region
6.2 Market Share Analysis, By Region
6.3 Product Benchmarking
6.3.1 Product specifications and features
6.3.2 Pricing
6.4 Strategic Initiatives
6.4.1 Marketing and promotional activities
6.4.2 Distribution and Supply Chain Strategies
6.4.3 Expansion plans and new product launches
6.4.4 Strategic partnerships and collaborations
6.5 Technological Advancements
6.6 Market Positioning and Branding
7. Video as a Service Market Segmentation, By Cloud Deployment Mode
7.1 Chapter Overview
7.2 Public Cloud
7.2.1 Public Cloud Market Trends Analysis (2020-2032)
7.2.2 Public Cloud Market Size Estimates and Forecasts to 2032 (USD Billion)
7.3 Private Cloud
7.3.1 Private Cloud Market Trends Analysis (2020-2032)
7.3.2 Private Cloud Market Size Estimates and Forecasts to 2032 (USD Billion)
7.4 Hybrid Cloud
7.4.1 Hybrid Cloud Market Trends Analysis (2020-2032)
7.4.2 Hybrid Cloud Market Size Estimates and Forecasts to 2032 (USD Billion)
8. Video as a Service Market Segmentation, By Vertical
8.1 Chapter Overview
8.2 BFSI
8.2.1 BFSI Market Trends Analysis (2020-2032)
8.2.2 BFSI Market Size Estimates and Forecasts to 2032 (USD Billion)
8.3 Healthcare & Life Sciences
8.3.1 Healthcare & Life Sciences Market Trends Analysis (2020-2032)
8.3.2 Healthcare & Life Sciences Market Size Estimates and Forecasts to 2032 (USD Billion)
8.4 Retail & E-Commerce
8.4.1 Retail & E-Commerce Market Trends Analysis (2020-2032)
8.4.2 Retail & E-Commerce Market Size Estimates and Forecasts to 2032 (USD Billion)
8.5 IT & Telecom
8.5.1 IT & Telecom Market Trends Analysis (2020-2032)
8.5.2 IT & Telecom Market Size Estimates And Forecasts To 2032 (USD Billion)
8.6 Education
8.6.1 Education Market Trends Analysis (2020-2032)
8.6.2 Education Market Size Estimates And Forecasts To 2032 (USD Billion)
8.7 Government and Public Sector
8.7.1 Government and Public Sector Market Trends Analysis (2020-2032)
8.7.2 Government and Public Sector Market Size Estimates And Forecasts To 2032 (USD Billion)
8.8 Media and Entertainment
8.8.1 Media and Entertainment Market Trends Analysis (2020-2032)
8.8.2 Media and Entertainment Market Size Estimates And Forecasts To 2032 (USD Billion)
8.9 Others
8.9.1 Others Market Trends Analysis (2020-2032)
8.9.2 Others Market Size Estimates And Forecasts To 2032 (USD Billion)
9. Video as a Service Market Segmentation, By Application
9.1 Chapter Overview
9.2 Corporate Communications
9.2.1 Corporate Communications Market Trends Analysis (2020-2032)
9.2.2 Corporate Communications Market Size Estimates and Forecasts to 2032 (USD Billion)
9.3 Training & Development
9.3.1 Training & Development Market Trends Analysis (2020-2032)
9.3.2 Training & Development Market Size Estimates and Forecasts to 2032 (USD Billion)
9.4 Marketing & Client Engagement
9.4.1 Marketing & Client Engagement Market Trends Analysis (2020-2032)
9.4.2 Marketing & Client Engagement Market Size Estimates and Forecasts to 2032 (USD Billion)
9.5 Broadcast Distribution
9.5.1 Broadcast Distribution Market Trends Analysis (2020-2032)
9.5.2 Broadcast Distribution Market Size Estimates and Forecasts to 2032 (USD Billion)
9.6 Content Creation & Management
9.6.1 Content Creation & Management Market Trends Analysis (2020-2032)
9.6.2 Content Creation & Management Market Size Estimates and Forecasts to 2032 (USD Billion)
9.7 Other
9.7.1 Other Market Trends Analysis (2020-2032)
9.7.2 Other Market Size Estimates And Forecasts To 2032 (USD Billion)
10. Regional Analysis
10.1 Chapter Overview
10.2 North America
10.2.1 Trends Analysis
10.2.2 North America Video as a Service Market Estimates and Forecasts, by Country (2020-2032) (USD Billion)
10.2.3 North America Video as a Service Market Estimates and Forecasts, By Application (2020-2032) (USD Billion)
10.2.4 North America Video as a Service Market Estimates and Forecasts, By Cloud Deployment Mode (2020-2032) (USD Billion)
10.2.5 North America Video as a Service Market Estimates and Forecasts, By Vertical (2020-2032) (USD Billion)
10.2.6 USA
10.2.6.1 USA Video as a Service Market Estimates and Forecasts, By Application (2020-2032) (USD Billion)
10.2.6.2 USA Video as a Service Market Estimates and Forecasts, By Cloud Deployment Mode (2020-2032) (USD Billion)
10.2.6.3 USA Video as a Service Market Estimates and Forecasts, By Vertical (2020-2032) (USD Billion)
10.2.7 Canada
10.2.7.1 Canada Video as a Service Market Estimates and Forecasts, By Application (2020-2032) (USD Billion)
10.2.7.2 Canada Video as a Service Market Estimates and Forecasts, By Cloud Deployment Mode (2020-2032) (USD Billion)
10.2.7.3 Canada Video as a Service Market Estimates and Forecasts, By Vertical (2020-2032) (USD Billion)
10.2.8 Mexico
10.2.8.1 Mexico Video as a Service Market Estimates and Forecasts, By Application (2020-2032) (USD Billion)
10.2.8.2 Mexico Video as a Service Market Estimates and Forecasts, By Cloud Deployment Mode (2020-2032) (USD Billion)
10.2.8.3 Mexico Video as a Service Market Estimates and Forecasts, By Vertical (2020-2032) (USD Billion)
10.3 Europe
10.3.1 Eastern Europe
10.3.1.1 Trends Analysis
10.3.1.2 Eastern Europe Video as a Service Market Estimates and Forecasts, by Country (2020-2032) (USD Billion)
10.3.1.3 Eastern Europe Video as a Service Market Estimates and Forecasts, By Application (2020-2032) (USD Billion)
10.3.1.4 Eastern Europe Video as a Service Market Estimates and Forecasts, By Cloud Deployment Mode (2020-2032) (USD Billion)
10.3.1.5 Eastern Europe Video as a Service Market Estimates and Forecasts, By Vertical (2020-2032) (USD Billion)
10.3.1.6 Poland
10.3.1.6.1 Poland Video as a Service Market Estimates and Forecasts, By Application (2020-2032) (USD Billion)
10.3.1.6.2 Poland Video as a Service Market Estimates and Forecasts, By Cloud Deployment Mode (2020-2032) (USD Billion)
10.3.1.6.3 Poland Video as a Service Market Estimates and Forecasts, By Vertical (2020-2032) (USD Billion)
10.3.1.7 Romania
10.3.1.7.1 Romania Video as a Service Market Estimates and Forecasts, By Application (2020-2032) (USD Billion)
10.3.1.7.2 Romania Video as a Service Market Estimates and Forecasts, By Cloud Deployment Mode (2020-2032) (USD Billion)
10.3.1.7.3 Romania Video as a Service Market Estimates and Forecasts, By Vertical (2020-2032) (USD Billion)
10.3.1.8 Hungary
10.3.1.8.1 Hungary Video as a Service Market Estimates and Forecasts, By Application (2020-2032) (USD Billion)
10.3.1.8.2 Hungary Video as a Service Market Estimates and Forecasts, By Cloud Deployment Mode (2020-2032) (USD Billion)
10.3.1.8.3 Hungary Video as a Service Market Estimates and Forecasts, By Vertical (2020-2032) (USD Billion)
10.3.1.9 Turkey
10.3.1.9.1 Turkey Video as a Service Market Estimates and Forecasts, By Application (2020-2032) (USD Billion)
10.3.1.9.2 Turkey Video as a Service Market Estimates and Forecasts, By Cloud Deployment Mode (2020-2032) (USD Billion)
10.3.1.9.3 Turkey Video as a Service Market Estimates and Forecasts, By Vertical (2020-2032) (USD Billion)
10.3.1.10 Rest of Eastern Europe
10.3.1.10.1 Rest of Eastern Europe Video as a Service Market Estimates and Forecasts, By Application (2020-2032) (USD Billion)
10.3.1.10.2 Rest of Eastern Europe Video as a Service Market Estimates and Forecasts, By Cloud Deployment Mode (2020-2032) (USD Billion)
10.3.1.10.3 Rest of Eastern Europe Video as a Service Market Estimates and Forecasts, By Vertical (2020-2032) (USD Billion)
10.3.2 Western Europe
10.3.2.1 Trends Analysis
10.3.2.2 Western Europe Video as a Service Market Estimates and Forecasts, by Country (2020-2032) (USD Billion)
10.3.2.3 Western Europe Video as a Service Market Estimates and Forecasts, By Application (2020-2032) (USD Billion)
10.3.2.4 Western Europe Video as a Service Market Estimates and Forecasts, By Cloud Deployment Mode (2020-2032) (USD Billion)
10.3.2.5 Western Europe Video as a Service Market Estimates and Forecasts, By Vertical (2020-2032) (USD Billion)
10.3.2.6 Germany
10.3.2.6.1 Germany Video as a Service Market Estimates and Forecasts, By Application (2020-2032) (USD Billion)
10.3.2.6.2 Germany Video as a Service Market Estimates and Forecasts, By Cloud Deployment Mode (2020-2032) (USD Billion)
10.3.2.6.3 Germany Video as a Service Market Estimates and Forecasts, By Vertical (2020-2032) (USD Billion)
10.3.2.7 France
10.3.2.7.1 France Video as a Service Market Estimates and Forecasts, By Application (2020-2032) (USD Billion)
10.3.2.7.2 France Video as a Service Market Estimates and Forecasts, By Cloud Deployment Mode (2020-2032) (USD Billion)
10.3.2.7.3 France Video as a Service Market Estimates and Forecasts, By Vertical (2020-2032) (USD Billion)
10.3.2.8 UK
10.3.2.8.1 UK Video as a Service Market Estimates and Forecasts, By Application (2020-2032) (USD Billion)
10.3.2.8.2 UK Video as a Service Market Estimates and Forecasts, By Cloud Deployment Mode (2020-2032) (USD Billion)
10.3.2.8.3 UK Video as a Service Market Estimates and Forecasts, By Vertical (2020-2032) (USD Billion)
10.3.2.9 Italy
10.3.2.9.1 Italy Video as a Service Market Estimates and Forecasts, By Application (2020-2032) (USD Billion)
10.3.2.9.2 Italy Video as a Service Market Estimates and Forecasts, By Cloud Deployment Mode (2020-2032) (USD Billion)
10.3.2.9.3 Italy Video as a Service Market Estimates and Forecasts, By Vertical (2020-2032) (USD Billion)
10.3.2.10 Spain
10.3.2.10.1 Spain Video as a Service Market Estimates and Forecasts, By Application (2020-2032) (USD Billion)
10.3.2.10.2 Spain Video as a Service Market Estimates and Forecasts, By Cloud Deployment Mode (2020-2032) (USD Billion)
10.3.2.10.3 Spain Video as a Service Market Estimates and Forecasts, By Vertical (2020-2032) (USD Billion)
10.3.2.11 Netherlands
10.3.2.11.1 Netherlands Video as a Service Market Estimates and Forecasts, By Application (2020-2032) (USD Billion)
10.3.2.11.2 Netherlands Video as a Service Market Estimates and Forecasts, By Cloud Deployment Mode (2020-2032) (USD Billion)
10.3.2.11.3 Netherlands Video as a Service Market Estimates and Forecasts, By Vertical (2020-2032) (USD Billion)
10.3.2.12 Switzerland
10.3.2.12.1 Switzerland Video as a Service Market Estimates and Forecasts, By Application (2020-2032) (USD Billion)
10.3.2.12.2 Switzerland Video as a Service Market Estimates and Forecasts, By Cloud Deployment Mode (2020-2032) (USD Billion)
10.3.2.12.3 Switzerland Video as a Service Market Estimates and Forecasts, By Vertical (2020-2032) (USD Billion)
10.3.2.13 Austria
10.3.2.13.1 Austria Video as a Service Market Estimates and Forecasts, By Application (2020-2032) (USD Billion)
10.3.2.13.2 Austria Video as a Service Market Estimates and Forecasts, By Cloud Deployment Mode (2020-2032) (USD Billion)
10.3.2.13.3 Austria Video as a Service Market Estimates and Forecasts, By Vertical (2020-2032) (USD Billion)
10.3.2.14 Rest of Western Europe
10.3.2.14.1 Rest of Western Europe Video as a Service Market Estimates and Forecasts, By Application (2020-2032) (USD Billion)
10.3.2.14.2 Rest of Western Europe Video as a Service Market Estimates and Forecasts, By Cloud Deployment Mode (2020-2032) (USD Billion)
10.3.2.14.3 Rest of Western Europe Video as a Service Market Estimates and Forecasts, By Vertical (2020-2032) (USD Billion)
10.4 Asia Pacific
10.4.1 Trends Analysis
10.4.2 Asia Pacific Video as a Service Market Estimates and Forecasts, by Country (2020-2032) (USD Billion)
10.4.3 Asia Pacific Video as a Service Market Estimates and Forecasts, By Application (2020-2032) (USD Billion)
10.4.4 Asia Pacific Video as a Service Market Estimates and Forecasts, By Cloud Deployment Mode (2020-2032) (USD Billion)
10.4.5 Asia Pacific Video as a Service Market Estimates and Forecasts, By Vertical (2020-2032) (USD Billion)
10.4.6 China
10.4.6.1 China Video as a Service Market Estimates and Forecasts, By Application (2020-2032) (USD Billion)
10.4.6.2 China Video as a Service Market Estimates and Forecasts, By Cloud Deployment Mode (2020-2032) (USD Billion)
10.4.6.3 China Video as a Service Market Estimates and Forecasts, By Vertical (2020-2032) (USD Billion)
10.4.7 India
10.4.7.1 India Video as a Service Market Estimates and Forecasts, By Application (2020-2032) (USD Billion)
10.4.7.2 India Video as a Service Market Estimates and Forecasts, By Cloud Deployment Mode (2020-2032) (USD Billion)
10.4.7.3 India Video as a Service Market Estimates and Forecasts, By Vertical (2020-2032) (USD Billion)
10.4.8 Japan
10.4.8.1 Japan Video as a Service Market Estimates and Forecasts, By Application (2020-2032) (USD Billion)
10.4.8.2 Japan Video as a Service Market Estimates and Forecasts, By Cloud Deployment Mode (2020-2032) (USD Billion)
10.4.8.3 Japan Video as a Service Market Estimates and Forecasts, By Vertical (2020-2032) (USD Billion)
10.4.9 South Korea
10.4.9.1 South Korea Video as a Service Market Estimates and Forecasts, By Application (2020-2032) (USD Billion)
10.4.9.2 South Korea Video as a Service Market Estimates and Forecasts, By Cloud Deployment Mode (2020-2032) (USD Billion)
10.4.9.3 South Korea Video as a Service Market Estimates and Forecasts, By Vertical (2020-2032) (USD Billion)
10.4.10 Vietnam
10.4.10.1 Vietnam Video as a Service Market Estimates and Forecasts, By Application (2020-2032) (USD Billion)
10.4.10.2 Vietnam Video as a Service Market Estimates and Forecasts, By Cloud Deployment Mode (2020-2032) (USD Billion)
10.4.10.3 Vietnam Video as a Service Market Estimates and Forecasts, By Vertical (2020-2032) (USD Billion)
10.4.11 Singapore
10.4.11.1 Singapore Video as a Service Market Estimates and Forecasts, By Application (2020-2032) (USD Billion)
10.4.11.2 Singapore Video as a Service Market Estimates and Forecasts, By Cloud Deployment Mode (2020-2032) (USD Billion)
10.4.11.3 Singapore Video as a Service Market Estimates and Forecasts, By Vertical (2020-2032) (USD Billion)
10.4.12 Australia
10.4.12.1 Australia Video as a Service Market Estimates and Forecasts, By Application (2020-2032) (USD Billion)
10.4.12.2 Australia Video as a Service Market Estimates and Forecasts, By Cloud Deployment Mode (2020-2032) (USD Billion)
10.4.12.3 Australia Video as a Service Market Estimates and Forecasts, By Vertical (2020-2032) (USD Billion)
10.4.13 Rest of Asia Pacific
10.4.13.1 Rest of Asia Pacific Video as a Service Market Estimates and Forecasts, By Application (2020-2032) (USD Billion)
10.4.13.2 Rest of Asia Pacific Video as a Service Market Estimates and Forecasts, By Cloud Deployment Mode (2020-2032) (USD Billion)
10.4.13.3 Rest of Asia Pacific Video as a Service Market Estimates and Forecasts, By Vertical (2020-2032) (USD Billion)
10.5 Middle East and Africa
10.5.1 Middle East
10.5.1.1 Trends Analysis
10.5.1.2 Middle East Video as a Service Market Estimates and Forecasts, by Country (2020-2032) (USD Billion)
10.5.1.3 Middle East Video as a Service Market Estimates and Forecasts, By Application (2020-2032) (USD Billion)
10.5.1.4 Middle East Video as a Service Market Estimates and Forecasts, By Cloud Deployment Mode (2020-2032) (USD Billion)
10.5.1.5 Middle East Video as a Service Market Estimates and Forecasts, By Vertical (2020-2032) (USD Billion)
10.5.1.6 UAE
10.5.1.6.1 UAE Video as a Service Market Estimates and Forecasts, By Application (2020-2032) (USD Billion)
10.5.1.6.2 UAE Video as a Service Market Estimates and Forecasts, By Cloud Deployment Mode (2020-2032) (USD Billion)
10.5.1.6.3 UAE Video as a Service Market Estimates and Forecasts, By Vertical (2020-2032) (USD Billion)
10.5.1.7 Egypt
10.5.1.7.1 Egypt Video as a Service Market Estimates and Forecasts, By Application (2020-2032) (USD Billion)
10.5.1.7.2 Egypt Video as a Service Market Estimates and Forecasts, By Cloud Deployment Mode (2020-2032) (USD Billion)
10.5.1.7.3 Egypt Video as a Service Market Estimates and Forecasts, By Vertical (2020-2032) (USD Billion)
10.5.1.8 Saudi Arabia
10.5.1.8.1 Saudi Arabia Video as a Service Market Estimates and Forecasts, By Application (2020-2032) (USD Billion)
10.5.1.8.2 Saudi Arabia Video as a Service Market Estimates and Forecasts, By Cloud Deployment Mode (2020-2032) (USD Billion)
10.5.1.8.3 Saudi Arabia Video as a Service Market Estimates and Forecasts, By Vertical (2020-2032) (USD Billion)
10.5.1.9 Qatar
10.5.1.9.1 Qatar Video as a Service Market Estimates and Forecasts, By Application (2020-2032) (USD Billion)
10.5.1.9.2 Qatar Video as a Service Market Estimates and Forecasts, By Cloud Deployment Mode (2020-2032) (USD Billion)
10.5.1.9.3 Qatar Video as a Service Market Estimates and Forecasts, By Vertical (2020-2032) (USD Billion)
10.5.1.10 Rest of Middle East
10.5.1.10.1 Rest of Middle East Video as a Service Market Estimates and Forecasts, By Application (2020-2032) (USD Billion)
10.5.1.10.2 Rest of Middle East Video as a Service Market Estimates and Forecasts, By Cloud Deployment Mode (2020-2032) (USD Billion)
10.5.1.10.3 Rest of Middle East Video as a Service Market Estimates and Forecasts, By Vertical (2020-2032) (USD Billion)
10.5.2 Africa
10.5.2.1 Trends Analysis
10.5.2.2 Africa Video as a Service Market Estimates and Forecasts, by Country (2020-2032) (USD Billion)
10.5.2.3 Africa Video as a Service Market Estimates and Forecasts, By Application (2020-2032) (USD Billion)
10.5.2.4 Africa Video as a Service Market Estimates and Forecasts, By Cloud Deployment Mode (2020-2032) (USD Billion)
10.5.2.5 Africa Video as a Service Market Estimates and Forecasts, By Vertical (2020-2032) (USD Billion)
10.5.2.6 South Africa
10.5.2.6.1 South Africa Video as a Service Market Estimates and Forecasts, By Application (2020-2032) (USD Billion)
10.5.2.6.2 South Africa Video as a Service Market Estimates and Forecasts, By Cloud Deployment Mode (2020-2032) (USD Billion)
10.5.2.6.3 South Africa Video as a Service Market Estimates and Forecasts, By Vertical (2020-2032) (USD Billion)
10.5.2.7 Nigeria
10.5.2.7.1 Nigeria Video as a Service Market Estimates and Forecasts, By Application (2020-2032) (USD Billion)
10.5.2.7.2 Nigeria Video as a Service Market Estimates and Forecasts, By Cloud Deployment Mode (2020-2032) (USD Billion)
10.5.2.7.3 Nigeria Video as a Service Market Estimates and Forecasts, By Vertical (2020-2032) (USD Billion)
10.5.2.8 Rest of Africa
10.5.2.8.1 Rest of Africa Video as a Service Market Estimates and Forecasts, By Application (2020-2032) (USD Billion)
10.5.2.8.2 Rest of Africa Video as a Service Market Estimates and Forecasts, By Cloud Deployment Mode (2020-2032) (USD Billion)
10.5.2.8.3 Rest of Africa Video as a Service Market Estimates and Forecasts, By Vertical (2020-2032) (USD Billion)
10.6 Latin America
10.6.1 Trends Analysis
10.6.2 Latin America Video as a Service Market Estimates and Forecasts, by Country (2020-2032) (USD Billion)
10.6.3 Latin America Video as a Service Market Estimates and Forecasts, By Application (2020-2032) (USD Billion)
10.6.4 Latin America Video as a Service Market Estimates and Forecasts, By Cloud Deployment Mode (2020-2032) (USD Billion)
10.6.5 Latin America Video as a Service Market Estimates and Forecasts, By Vertical (2020-2032) (USD Billion)
10.6.6 Brazil
10.6.6.1 Brazil Video as a Service Market Estimates and Forecasts, By Application (2020-2032) (USD Billion)
10.6.6.2 Brazil Video as a Service Market Estimates and Forecasts, By Cloud Deployment Mode (2020-2032) (USD Billion)
10.6.6.3 Brazil Video as a Service Market Estimates and Forecasts, By Vertical (2020-2032) (USD Billion)
10.6.7 Argentina
10.6.7.1 Argentina Video as a Service Market Estimates and Forecasts, By Application (2020-2032) (USD Billion)
10.6.7.2 Argentina Video as a Service Market Estimates and Forecasts, By Cloud Deployment Mode (2020-2032) (USD Billion)
10.6.7.3 Argentina Video as a Service Market Estimates and Forecasts, By Vertical (2020-2032) (USD Billion)
10.6.8 Colombia
10.6.8.1 Colombia Video as a Service Market Estimates and Forecasts, By Application (2020-2032) (USD Billion)
10.6.8.2 Colombia Video as a Service Market Estimates and Forecasts, By Cloud Deployment Mode (2020-2032) (USD Billion)
10.6.8.3 Colombia Video as a Service Market Estimates and Forecasts, By Vertical (2020-2032) (USD Billion)
10.6.9 Rest of Latin America
10.6.9.1 Rest of Latin America Video as a Service Market Estimates and Forecasts, By Application (2020-2032) (USD Billion)
10.6.9.2 Rest of Latin America Video as a Service Market Estimates and Forecasts, By Cloud Deployment Mode (2020-2032) (USD Billion)
10.6.9.3 Rest of Latin America Video as a Service Market Estimates and Forecasts, By Vertical (2020-2032) (USD Billion)
11. Company Profiles
11.1 Zoom Video Communications
11.1.1 Company Overview
11.1.2 Financial
11.1.3 Products/ Services Offered
11.1.4 SWOT Analysis
11.2 Vimeo
11.2.1 Company Overview
11.2.2 Financial
11.2.3 Products/ Services Offered
11.2.4 SWOT Analysis
11.3 Cisco Systems
11.3.1 Company Overview
11.3.2 Financial
11.3.3 Products/ Services Offered
11.3.4 SWOT Analysis
11.4 Microsoft
11.4.1 Company Overview
11.4.2 Financial
11.4.3 Products/ Services Offered
11.4.4 SWOT Analysis
11.5 Amazon Web Services (AWS)
11.5.1 Company Overview
11.5.2 Financial
11.5.3 Products/ Services Offered
11.5.4 SWOT Analysis
11.6 Google Cloud
11.6.1 Company Overview
11.6.2 Financial
11.6.3 Products/ Services Offered
11.6.4 SWOT Analysis
11.7 IBM
11.7.1 Company Overview
11.7.2 Financial
11.7.3 Products/ Services Offered
11.7.4 SWOT Analysis
11.8 Brightcove
11.8.1 Company Overview
11.8.2 Financial
11.8.3 Products/ Services Offered
11.8.4 SWOT Analysis
11.9 Kaltura
11.9.1 Company Overview
11.9.2 Financial
11.9.3 Products/ Services Offered
11.9.4 SWOT Analysis
11.10 Vonage
11.10.1 Company Overview
11.10.2 Financial
11.10.3 Products/ Services Offered
11.10.4 SWOT Analysis
12. Use Cases and Best Practices
13. Conclusion
An accurate research report requires proper strategizing as well as implementation. There are multiple factors involved in the completion of good and accurate research report and selecting the best methodology to compete the research is the toughest part. Since the research reports we provide play a crucial role in any company’s decision-making process, therefore we at SNS Insider always believe that we should choose the best method which gives us results closer to reality. This allows us to reach at a stage wherein we can provide our clients best and accurate investment to output ratio.
Each report that we prepare takes a timeframe of 350-400 business hours for production. Starting from the selection of titles through a couple of in-depth brain storming session to the final QC process before uploading our titles on our website we dedicate around 350 working hours. The titles are selected based on their current market cap and the foreseen CAGR and growth.
The 5 steps process:
Step 1: Secondary Research:
Secondary Research or Desk Research is as the name suggests is a research process wherein, we collect data through the readily available information. In this process we use various paid and unpaid databases which our team has access to and gather data through the same. This includes examining of listed companies’ annual reports, Journals, SEC filling etc. Apart from this our team has access to various associations across the globe across different industries. Lastly, we have exchange relationships with various university as well as individual libraries.

Step 2: Primary Research
When we talk about primary research, it is a type of study in which the researchers collect relevant data samples directly, rather than relying on previously collected data. This type of research is focused on gaining content specific facts that can be sued to solve specific problems. Since the collected data is fresh and first hand therefore it makes the study more accurate and genuine.
We at SNS Insider have divided Primary Research into 2 parts.
Part 1 wherein we interview the KOLs of major players as well as the upcoming ones across various geographic regions. This allows us to have their view over the market scenario and acts as an important tool to come closer to the accurate market numbers. As many as 45 paid and unpaid primary interviews are taken from both the demand and supply side of the industry to make sure we land at an accurate judgement and analysis of the market.
This step involves the triangulation of data wherein our team analyses the interview transcripts, online survey responses and observation of on filed participants. The below mentioned chart should give a better understanding of the part 1 of the primary interview.

Part 2: In this part of primary research the data collected via secondary research and the part 1 of the primary research is validated with the interviews from individual consultants and subject matter experts.
Consultants are those set of people who have at least 12 years of experience and expertise within the industry whereas Subject Matter Experts are those with at least 15 years of experience behind their back within the same space. The data with the help of two main processes i.e., FGDs (Focused Group Discussions) and IDs (Individual Discussions). This gives us a 3rd party nonbiased primary view of the market scenario making it a more dependable one while collation of the data pointers.
Step 3: Data Bank Validation
Once all the information is collected via primary and secondary sources, we run that information for data validation. At our intelligence centre our research heads track a lot of information related to the market which includes the quarterly reports, the daily stock prices, and other relevant information. Our data bank server gets updated every fortnight and that is how the information which we collected using our primary and secondary information is revalidated in real time.

Step 4: QA/QC Process
After all the data collection and validation our team does a final level of quality check and quality assurance to get rid of any unwanted or undesired mistakes. This might include but not limited to getting rid of the any typos, duplication of numbers or missing of any important information. The people involved in this process include technical content writers, research heads and graphics people. Once this process is completed the title gets uploader on our platform for our clients to read it.
Step 5: Final QC/QA Process:
This is the last process and comes when the client has ordered the study. In this process a final QA/QC is done before the study is emailed to the client. Since we believe in giving our clients a good experience of our research studies, therefore, to make sure that we do not lack at our end in any way humanly possible we do a final round of quality check and then dispatch the study to the client.
MARKET SEGMENTATION
BY APPLICATION
Corporate Communications
Training & Development
Marketing & Client Engagement
Broadcast Distribution
Content Creation & Management
Others
BY CLOUD DEPLOYMENT MODE
Public Cloud
Private Cloud
Hybrid Cloud
BY VERTICAL
BFSI
Healthcare & Life Sciences
Retail & E-Commerce
IT & Telecom
Education
Government and Public Sector
Media and Entertainment
Others
Request for Segment Customization as per your Business Requirement: Segment Customization Request
REGIONAL COVERAGE:
North America
US
Canada
Mexico
Europe
Eastern Europe
Poland
Romania
Hungary
Turkey
Rest of Eastern Europe
Western Europe
Germany
France
UK
Italy
Spain
Netherlands
Switzerland
Austria
Rest of Western Europe
Asia Pacific
China
India
Japan
South Korea
Vietnam
Singapore
Australia
Rest of Asia Pacific
Middle East & Africa
Middle East
UAE
Egypt
Saudi Arabia
Qatar
Rest of the Middle East
Africa
Nigeria
South Africa
Rest of Africa
Latin America
Brazil
Argentina
Colombia
Rest of Latin America
Request for Country Level Research Report: Country Level Customization Request
Available Customization
With the given market data, SNS Insider offers customization as per the company’s specific needs. The following customization options are available for the report:
Product Analysis
Criss-Cross segment analysis (e.g. Product X Application)
Product Matrix which gives a detailed comparison of product portfolio of each company
Geographic Analysis
Additional countries in any of the regions
Company Information
Detailed analysis and profiling of additional market players
The Computer Vision Market was valued at USD 21.2 Billion in 2023 and is expected to reach USD 190.9 Billion by 2032, growing at a CAGR of 27.69% from 2024-2032.
The Data Center As A Service Market was valued at USD 103.4 Billion in 2023 and will reach USD 728.7 Billion by 2032, growing at a CAGR of 24.24% by 2032.
Business Process Management Market was worth USD 15.07 billion in 2023 and is predicted to be worth USD 50.35 billion by 2032, growing at a CAGR of 14.37% between 2024 and 2032.
The Video Intercom Devices Market size was valued at USD 41.79 billion in 2023 and is expected to reach USD 128.62 billion by 2032, growing at a CAGR of 13.27% over the forecast period of 2024-2032.
The Generative AI Chipset Market Size was valued at USD 37.29 Billion in 2023 and will reach USD 454.50 Billion by 2032 and grow at a CAGR of 32.2% by 2032.
The Low Code Development Platform Market size was recorded at USD 22.80 Billion in 2023 and is expected to surpass USD 271.7 Billion by 2032, growing at a CAGR of 31.7% over the forecast period of 2024-2032.

Hi! Click one of our member below to chat on Phone
© 2025 All Rights Reserved by SNS Insider Pvt Ltd


