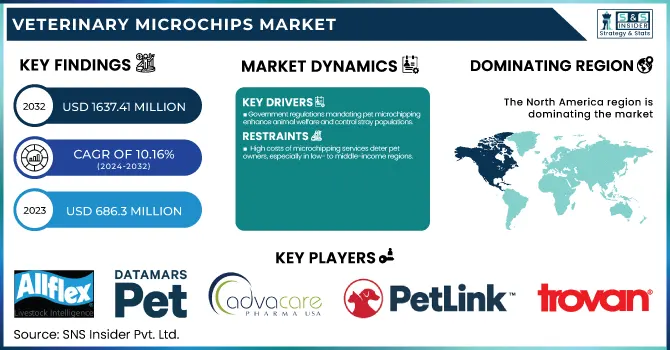
The Veterinary Microchips Market Size was valued at USD 686.3 million in 2023 and is expected to reach USD 1637.41 million by 2032, growing at a CAGR of 10.16% over the forecast period 2024-2032.
To Get more information on Veterinary Microchips Market - Request Free Sample Report
This report offers in-depth statistical data and dominant trends in the Veterinary microchip market while underscoring the global adoption of pet microchipping. It includes incidence and prevalence rates, studies of pet owner's preferences, and regional variations. The research includes regional penetration, key markets, and regulatory involvement. Microchip embedding trends show the chip frequencies of choice, as well as the typical adoption age. The report also looks at pet recovery and reunification rates, including microchipped vs. non-microchipped pets. A look would outline implantation costs and consumer spending patterns. Compliance rates and government policies that are moulding the market are linked to approving developments. This analysis provides a complete picture of industry development, breakthroughs, and insights into future trends in adoption.
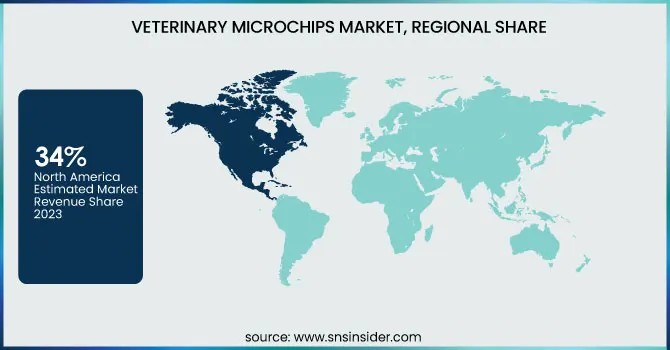
The increasing humanization of pets has driven the veterinary microchips with the need for efficient and accurate identification as many countries have implemented laws to identify pets. North America is the largest market for veterinary microchips, accounting for over 34% of the veterinary microchip market. In NA US held market size was USD 182.01 million in 2023. Reflecting its large pet-owning population and stringent regulations regarding pet microchipping. New government numbers show a large increase in pet ownership, with 2023 seeing nearly 92 million dogs owned as pets in the U.S.
Drivers
Government regulations mandating pet microchipping enhance animal welfare and control stray populations.
Regulations in institutions that require microchipping of pets are a crucial step to take to improve animal welfare and control the roaming of these animals. In England, the biggest legal development came when a new law mandating all cat owners to microchip their animals by June 10, 2024, went into action. Not doing so could lead to a fine of up to £500. This initiative seeks to tackle the worrying statistic that in 2022, less than 2% of stray cats who arrived at Battersea, a leading animal welfare charity, were returned to their owners as a result of microchipping. In addition, 59% of the stray cats were not microchipped at all, further highlighting the importance of such legislation. And the value of microchipping is reinforced by data that show that pets with microchips are three times more likely to be returned to their families than those without chips. With this offer, only about 18% of lost pets arriving at shelters are microchipped, indicating a significant disparity in pet identification practices. In the United States, a study of 7,704 microchipped pets across 53 shelters found that 72.7% of these animals were reunited with their owners. But there was still a long way to go, with 35.4% of unrecovered reunions caused by an incorrect or disconnected mobile straight in the microchip registry, and 9.8% due to microchips not being registered.
These statistics demonstrate why microchipping laws are vital. If governments were to pass these types of laws, the reuniting of pets with their owners could be greatly improved, the number of strays wouldn't be eliminated, but would greatly decrease, and open up room at the shelters. However, for these programs to work, pet owners must keep their contact information updated in microchip registries. All of these measures result in better pet management and improved animal welfare.
Restraint:
High costs of microchipping services deter pet owners, especially in low- to middle-income regions.
The cost of microchipping pets varies globally, typically ranging from $25 to $50 per animal, depending on factors such as species and service provider. This expense can be a deterrent for pet owners, particularly those in low- to middle-income regions, leading to lower adoption rates of this technology. Despite the benefits of microchipping, such as permanent identification and increased chances of reuniting lost pets with their owners, the initial cost remains a significant barrier. This reluctance is especially pronounced among pet owners with limited disposable income, who may prioritize other immediate expenses over microchipping. Consequently, this cost sensitivity hampers the widespread adoption of microchipping, limiting its potential to enhance pet safety and identification on a global scale. To address this issue, some animal shelters and rescue organizations offer low-cost microchipping services during special events or as part of adoption packages. Additionally, implementing educational programs to highlight the long-term benefits and cost-effectiveness of microchipping can encourage more pet owners to invest in this technology. By alleviating cost concerns and increasing awareness, the adoption rate of pet microchipping can improve, enhancing animal welfare worldwide.
Opportunity:
Emerging markets with growing pet ownership present significant growth potential for microchip adoption.
Limited knowledge of microchipping among pet owners regarding its advantages and availability is a major challenge for the international veterinary microchips market. This knowledge gap means that fewer owners utilize the technology, undermining microchipping as an effective tool to identify and recover pets. In areas where it may not be enforced, a majority of pet parents are still unaware of the true benefits of microchipping. For example, In the US, up to 70% of pets are microchipped, according to the American Veterinary Medical Association, but the rate varies around the world, with much of Eastern Europe and some regions of Asia demonstrating very low adoption. This gap is often explained by the public being lack of awareness and understanding of microchipping and care for pet safety.
The impact of this ignorance is reflected in pet recovery statistics. Worldwide, only approximately 48% of lost dogs and a paltry 19% of lost cats are returned to their owners. These abysmally low recovery rates have underlined the vital importance of reliable identification techniques such as microchipping. Additionally, even in areas that have implemented microchipping on a wide-scale basis, problems of improper registration or failure to update contact details still exist, rendering microchips meaningless. This underscores the need for wide-ranging educational campaigns that not only promote the microchipping of pets but also provide an incentive for pet owners to keep their details current.
Challenge:
Lack of awareness among pet owners about the benefits and availability of microchipping limits market growth.
Limited knowledge of microchipping among pet owners regarding its advantages and availability is a major challenge for the international veterinary microchips market. This knowledge gap means that fewer owners utilize the technology, undermining microchipping as an effective tool to identify and recover pets. In areas where it may not be enforced, a majority of pet parents are still unaware of the true benefits of microchipping. for example, In the US, up to 70% of pets are microchipped, according to the American Veterinary Medical Association, but the rate varies around the world, with much of Eastern Europe and some regions of Asia demonstrating very low adoption. This gap is often explained by the public being lacking in the awareness and understanding of microchipping and care of pet safety.
The impact of this ignorance is reflected in pet recovery statistics. Worldwide, only approximately 48% of lost dogs and a paltry 19% of lost cats are returned to their owners. These abysmally low recovery rates have underlined the vital importance of reliable identification techniques such as microchipping. Additionally, even in areas that have implemented microchipping on a more wide-scale basis, problems of improper registration or failure to update contact details still exist, rendering microchips meaningless. This underscores the need for wide-ranging educational campaigns that not only promote the microchipping of pets, but provide an incentive for pet owners to keep their details current.
By Animal Type
Dogs held the dominant share 44% of the Veterinary Microchips Market in 2023. There are several reasons for this dominance, including the large number of global dog owners and the unique identification needs of dogs. Dogs are the most common pets in many countries, including the U.S., where government statistics show that they are routinely microchipped for identification and recovery purposes. According to the American Veterinary Medical Association (AVMA), microchipping is a very reliable way of identifying a pet, particularly a dog, as it is often mandated by local laws that dogs be microchipped. The emotional connection that owners have to their pets only propels the need for microchipping if a dog is lost, having them microchipped aids in getting them home safely. Government regulations requiring dog microchipping have also been shown to increase dog microchipping rates in some areas. The demand for veterinary microchips is also driven by regulations such as dogs entering the U.S. must be microchipped. The Dog segment held the dominating share in the veterinary microchips market owing to this regulatory scenario, and growing awareness of pet health and safety.
The growing pet humanization trend and rising need for identification will have significant contributions to the growth of the veterinary microchips market. Dawn was in line with the trend of more people taking into consideration their pets as part of the family and willing to pay for identification devices to keep them safe. Countless government projects highlight the need for pet microchipping so that we can keep track of our pets for identification as well as health monitoring reasons.
By Scanner Type
In 2023, the 134.2 KHz scanner type accounted for the majority share in the Veterinary Microchips Market. 134.2 KHz microchips have become the standard for pet identification in many parts of the world, most notably in North America and Europe, resulting in this dominance. This frequency is often required by government regulations or industry standards in order to be compatible with various scanners, ensuring that pets can be identified in any situation. 134.2 KHz frequency is favored due to its reliable and consistent performance, which is why pet and veterinarians wanted for an identification microchip. Their ability to read microchips from different manufacturers streamlines the identification process, a feature iron 134.2 KHz scanners widely available are ultimately compatible with many microchip brands. Government programs that encourage standardized systems of identification for pets also support the use of 134.2 KHz scanners. For example, regulations in the U.S. and Europe, as well as elsewhere, generally require pets to be microchipped at frequencies that can be easily read in order for them to be identified and reunited with their guardians. Standardization achieved by the use of 134.2 KHz scanners in veterinary clinics and animal shelters has further strengthened their position in the market.
By Distribution Channel
In 2023, Veterinary hospitals/clinics accounted for the largest share of the Veterinary Microchips Market. This dominance has been attributed to the availability of microchipping services as a standard part of veterinary practice. Many veterinary clinics offer microchipping as part of their services, often during regular check-ups or spay/neutering procedures. Government policies and animal health guidance try to lead veterinarians to promote microchipping as a common routine for identifying pet animals and their safety. Many pet owners are already familiar with their local veterinary hospitals and clinics, as these facilities can also provide microchips for pets. Past government initiatives focusing on animal care and identification also validate the role of the veterinary hospitals/clinics in the microchipping market. For instance, when the government runs campaigns encouraging pet owners to have their pets microchipped, not only have adoption rates increased, but veterinary clinics have proven to be a keystone for these services.
In 2023, North America accounted for a prominent portion of the market share 34%, owing to factors such as robust regulatory support and evolved healthcare facilities. In fact, according to the American Pet Products Association (APPA), the U.S. is leading by a wide margin, with 70% of households possessing pets. The number of pets owned, along with regulations requiring microchipping in many states, has resulted in the technology being widely adopted. The dominance of North America can also be attributed to the presence of major players, such as AVID Identification Systems and HomeAgain, who invest heavily in research and development to remain ahead in microchip technology, as well as in raising awareness of its benefits among pet owners and veterinarians. Microchipping has become more accessible to a wider audience due to competitive pricing in North America, contributing to its market share.
The Asia-Pacific region is expanding at the highest CAGR, and this can be attributable to a surge in disposable income combined with the growing understanding of animal welfare among the populace in nations, such as China and India. The Indian pet economy has grown 40% in 5 years due to the growing pet parent demographic. In addition, the increasing pet welfare initiatives adopted by the governments in the region along with rising demand for microchipping services will also work in favor of the microchip implant industry.
Get Customized Report as per Your Business Requirement - Enquiry Now
Key Service Providers/Manufacturers
Allflex Livestock Intelligence (Microchip, Thermochip)
Datamars Pet ID (T-SL Slim Polymer Microchip, T-IS Bio Glass Microchip)
AdvaCare Pharma (Microchip Implant Kit, Veterinary Injection Instruments)
EIDAP Inc. (12mm ISO Microchip, 8mm ISO Microchip)
Pet Pulse (RFID Microchip Implants, RFID Microchip Readers)
PetLink (Microchip Registration Services, Pet Recovery Services)
Trovan (Unique-ID 100, Unique-ID 200)
HomeAgain (Standard Microchip, Universal WorldScan Reader)
AVID Identification Systems (FriendChip, MiniTracker 3)
Microchip ID Systems (Microchip ID Mini, ProScan 700)
Bayer (ResQ Microchip, ResQ Scanner)
Virbac (BackHome BioTec Microchip, BackHome Reader)
PetID Global (PetID Microchip, PetID Scanner)
PeddyMark (Standard Microchip, Halo Scanner)
IdentiPet (IdentiPet Microchip, IdentiPet Scanner)
Animalcare (Identichip, Identichip Scanner)
Pet Travel (ISO Microchip, Universal Scanner)
SmartTag Microchips (SmartTag Microchip, SmartTag Scanner)
PetSafe (Microchip Cat Flap, Microchip Pet Feeder)
Sure Petcare (SureFlap Microchip Pet Door, SureFeed Microchip Pet Feeder)
Recent Developments
In May 2023, Datamars acquired Kippy S.r.l., a leading provider of GPS tracking and activity monitoring systems for dogs, enhancing its service offerings for pet owners globally. This acquisition reflects the growing trend towards integrating advanced technologies into pet care services, including microchipping and tracking solutions.
In March 2023, New legislation was introduced to mandate compulsory microchipping for all pet cats, aiming to simplify the process of reuniting lost or stray cats with their owners. This initiative is expected to drive demand for microchipping services and products.
| Report Attributes | Details |
|---|---|
| Market Size in 2023 | USD 686.3 Million |
| Market Size by 2032 | USD 1637.41 Million |
| CAGR | CAGR of 10.16% From 2024 to 2032 |
| Base Year | 2023 |
| Forecast Period | 2024-2032 |
| Historical Data | 2020-2022 |
| Report Scope & Coverage | Market Size, Segments Analysis, Competitive Landscape, Regional Analysis, DROC & SWOT Analysis, Forecast Outlook |
| Key Segments | • By Animal Type (Dogs, Horses, Cats, Others) • By Distribution Channel (Veterinary Hospitals/clinics, Others) • By Scanner type (134.2 KHz, 125 KHz, 128 KHz) |
| Regional Analysis/Coverage | North America (US, Canada, Mexico), Europe (Eastern Europe [Poland, Romania, Hungary, Turkey, Rest of Eastern Europe] Western Europe] Germany, France, UK, Italy, Spain, Netherlands, Switzerland, Austria, Rest of Western Europe]), Asia Pacific (China, India, Japan, South Korea, Vietnam, Singapore, Australia, Rest of Asia Pacific), Middle East & Africa (Middle East [UAE, Egypt, Saudi Arabia, Qatar, Rest of Middle East], Africa [Nigeria, South Africa, Rest of Africa], Latin America (Brazil, Argentina, Colombia, Rest of Latin America) |
| Company Profiles | Allflex Livestock Intelligence, Datamars Pet ID, AdvaCare Pharma, EIDAP Inc., Pet Pulse, PetLink, Trovan, HomeAgain, AVID Identification Systems, Microchip ID Systems, Bayer, Virbac, PetID Global, PeddyMark, IdentiPet, Animalcare, Pet Travel, SmartTag Microchips, PetSafe, Sure Petcare |
Ans. The projected market size for the Veterinary Microchips Market is USD 1637.4 million by 2032.
Ans: The North American region dominated the Veterinary Microchips Market in 2023.
Ans. The CAGR of the Veterinary Microchips Market is 10.16% during the forecast period of 2024-2032.
Ans: Lack of awareness among pet owners about the benefits and availability of microchipping limits market growth.
Ans: The Dogs segment dominated the Veterinary Microchips Market.
Table of Contents
1. Introduction
1.1 Market Definition
1.2 Scope (Inclusion and Exclusions)
1.3 Research Assumptions
2. Executive Summary
2.1 Market Overview
2.2 Regional Synopsis
2.3 Competitive Summary
3. Research Methodology
3.1 Top-Down Approach
3.2 Bottom-up Approach
3.3. Data Validation
3.4 Primary Interviews
4. Market Dynamics Impact Analysis
4.1 Market Driving Factors Analysis
4.1.1 Drivers
4.1.2 Restraints
4.1.3 Opportunities
4.1.4 Challenges
4.2 PESTLE Analysis
4.3 Porter’s Five Forces Model
5. Statistical Insights and Trends Reporting
5.1 Incidence and Prevalence of Pet Microchipping (2023)
5.2 Veterinary Microchip Implantation Trends (2023)
5.3 Pet Recovery and Reunification Rates (2023)
5.4 Healthcare Spending on Veterinary Microchips (2023)
6. Competitive Landscape
6.1 List of Major Companies, By Region
6.2 Market Share Analysis, By Region
6.3 Product Benchmarking
6.3.1 Product specifications and features
6.3.2 Pricing
6.4 Strategic Initiatives
6.4.1 Marketing and promotional activities
6.4.2 Distribution and Supply Chain Strategies
6.4.3 Expansion plans and new product launches
6.4.4 Strategic partnerships and collaborations
6.5 Technological Advancements
6.6 Market Positioning and Branding
7. Veterinary Microchips Market Segmentation, By Animal Type
7.1 Chapter Overview
7.2 Dogs
7.2.1 Dogs Market Trends Analysis (2020-2032)
7.2.2 Dogs Market Size Estimates and Forecasts to 2032 (USD Million)
7.3 Horses
7.3.1 Horses Market Trends Analysis (2020-2032)
7.3.2 Horses Market Size Estimates and Forecasts to 2032 (USD Million)
7.4 Cats
7.4.1 Cats Market Trends Analysis (2020-2032)
7.4.2 Cats Market Size Estimates and Forecasts to 2032 (USD Million)
7.5 Others
7.5.1 Others Market Trends Analysis (2020-2032)
7.5.2 Others Market Size Estimates and Forecasts to 2032 (USD Million)
8. Veterinary Microchips Market Segmentation, By Distribution Channel
8.1 Chapter Overview
8.2 Veterinary Hospitals/clinics
8.2.1 Veterinary Hospitals/clinics Market Trends Analysis (2020-2032)
8.2.2 Veterinary Hospitals/clinics Market Size Estimates and Forecasts to 2032 (USD Million)
8.3 Others
8.3.1 Others Market Trends Analysis (2020-2032)
8.3.2 Others Market Size Estimates and Forecasts to 2032 (USD Million)
9. Veterinary Microchips Market Segmentation, By Scanner type
9.1 Chapter Overview
9.2 134.2 KHz
9.2.1 134.2 KHz Market Trends Analysis (2020-2032)
9.2.2 134.2 KHz Market Size Estimates and Forecasts to 2032 (USD Million)
9.3 125 KHz
9.3.1 125 KHz Market Trends Analysis (2020-2032)
9.3.2 125 KHz Market Size Estimates and Forecasts to 2032 (USD Million)
9.4 128 KHz
9.4.1 128 KHz Market Trends Analysis (2020-2032)
9.4.2 128 KHz Market Size Estimates and Forecasts to 2032 (USD Million)
10. Regional Analysis
10.1 Chapter Overview
10.2 North America
10.2.1 Trends Analysis
10.2.2 North America Veterinary Microchips Market Estimates and Forecasts, by Country (2020-2032) (USD Million)
10.2.3 North America Veterinary Microchips Market Estimates and Forecasts, By Animal Type (2020-2032) (USD Million)
10.2.4 North America Veterinary Microchips Market Estimates and Forecasts, By Distribution Channel (2020-2032) (USD Million)
10.2.5 North America Veterinary Microchips Market Estimates and Forecasts, By Scanner type (2020-2032) (USD Million)
10.2.6 USA
10.2.6.1 USA Veterinary Microchips Market Estimates and Forecasts, By Animal Type (2020-2032) (USD Million)
10.2.6.2 USA Veterinary Microchips Market Estimates and Forecasts, By Distribution Channel (2020-2032) (USD Million)
10.2.6.3 USA Veterinary Microchips Market Estimates and Forecasts, By Scanner type (2020-2032) (USD Million)
10.2.7 Canada
10.2.7.1 Canada Veterinary Microchips Market Estimates and Forecasts, By Animal Type (2020-2032) (USD Million)
10.2.7.2 Canada Veterinary Microchips Market Estimates and Forecasts, By Distribution Channel (2020-2032) (USD Million)
10.2.7.3 Canada Veterinary Microchips Market Estimates and Forecasts, By Scanner type (2020-2032) (USD Million)
10.2.8 Mexico
10.2.8.1 Mexico Veterinary Microchips Market Estimates and Forecasts, By Animal Type (2020-2032) (USD Million)
10.2.8.2 Mexico Veterinary Microchips Market Estimates and Forecasts, By Distribution Channel (2020-2032) (USD Million)
10.2.8.3 Mexico Veterinary Microchips Market Estimates and Forecasts, By Scanner type (2020-2032) (USD Million)
10.3 Europe
10.3.1 Eastern Europe
10.3.1.1 Trends Analysis
10.3.1.2 Eastern Europe Veterinary Microchips Market Estimates and Forecasts, by Country (2020-2032) (USD Million)
10.3.1.3 Eastern Europe Veterinary Microchips Market Estimates and Forecasts, By Animal Type (2020-2032) (USD Million)
10.3.1.4 Eastern Europe Veterinary Microchips Market Estimates and Forecasts, By Distribution Channel (2020-2032) (USD Million)
10.3.1.5 Eastern Europe Veterinary Microchips Market Estimates and Forecasts, By Scanner type (2020-2032) (USD Million)
10.3.1.6 Poland
10.3.1.6.1 Poland Veterinary Microchips Market Estimates and Forecasts, By Animal Type (2020-2032) (USD Million)
10.3.1.6.2 Poland Veterinary Microchips Market Estimates and Forecasts, By Distribution Channel (2020-2032) (USD Million)
10.3.1.6.3 Poland Veterinary Microchips Market Estimates and Forecasts, By Scanner type (2020-2032) (USD Million)
10.3.1.7 Romania
10.3.1.7.1 Romania Veterinary Microchips Market Estimates and Forecasts, By Animal Type (2020-2032) (USD Million)
10.3.1.7.2 Romania Veterinary Microchips Market Estimates and Forecasts, By Distribution Channel (2020-2032) (USD Million)
10.3.1.7.3 Romania Veterinary Microchips Market Estimates and Forecasts, By Scanner type (2020-2032) (USD Million)
10.3.1.8 Hungary
10.3.1.8.1 Hungary Veterinary Microchips Market Estimates and Forecasts, By Animal Type (2020-2032) (USD Million)
10.3.1.8.2 Hungary Veterinary Microchips Market Estimates and Forecasts, By Distribution Channel (2020-2032) (USD Million)
10.3.1.8.3 Hungary Veterinary Microchips Market Estimates and Forecasts, By Scanner type (2020-2032) (USD Million)
10.3.1.9 Turkey
10.3.1.9.1 Turkey Veterinary Microchips Market Estimates and Forecasts, By Animal Type (2020-2032) (USD Million)
10.3.1.9.2 Turkey Veterinary Microchips Market Estimates and Forecasts, By Distribution Channel (2020-2032) (USD Million)
10.3.1.9.3 Turkey Veterinary Microchips Market Estimates and Forecasts, By Scanner type (2020-2032) (USD Million)
10.3.1.10 Rest of Eastern Europe
10.3.1.10.1 Rest of Eastern Europe Veterinary Microchips Market Estimates and Forecasts, By Animal Type (2020-2032) (USD Million)
10.3.1.10.2 Rest of Eastern Europe Veterinary Microchips Market Estimates and Forecasts, By Distribution Channel (2020-2032) (USD Million)
10.3.1.10.3 Rest of Eastern Europe Veterinary Microchips Market Estimates and Forecasts, By Scanner type (2020-2032) (USD Million)
10.3.2 Western Europe
10.3.2.1 Trends Analysis
10.3.2.2 Western Europe Veterinary Microchips Market Estimates and Forecasts, by Country (2020-2032) (USD Million)
10.3.2.3 Western Europe Veterinary Microchips Market Estimates and Forecasts, By Animal Type (2020-2032) (USD Million)
10.3.2.4 Western Europe Veterinary Microchips Market Estimates and Forecasts, By Distribution Channel (2020-2032) (USD Million)
10.3.2.5 Western Europe Veterinary Microchips Market Estimates and Forecasts, By Scanner type (2020-2032) (USD Million)
10.3.2.6 Germany
10.3.2.6.1 Germany Veterinary Microchips Market Estimates and Forecasts, By Animal Type (2020-2032) (USD Million)
10.3.2.6.2 Germany Veterinary Microchips Market Estimates and Forecasts, By Distribution Channel (2020-2032) (USD Million)
10.3.2.6.3 Germany Veterinary Microchips Market Estimates and Forecasts, By Scanner type (2020-2032) (USD Million)
10.3.2.7 France
10.3.2.7.1 France Veterinary Microchips Market Estimates and Forecasts, By Animal Type (2020-2032) (USD Million)
10.3.2.7.2 France Veterinary Microchips Market Estimates and Forecasts, By Distribution Channel (2020-2032) (USD Million)
10.3.2.7.3 France Veterinary Microchips Market Estimates and Forecasts, By Scanner type (2020-2032) (USD Million)
10.3.2.8 UK
10.3.2.8.1 UK Veterinary Microchips Market Estimates and Forecasts, By Animal Type (2020-2032) (USD Million)
10.3.2.8.2 UK Veterinary Microchips Market Estimates and Forecasts, By Distribution Channel (2020-2032) (USD Million)
10.3.2.8.3 UK Veterinary Microchips Market Estimates and Forecasts, By Scanner type (2020-2032) (USD Million)
10.3.2.9 Italy
10.3.2.9.1 Italy Veterinary Microchips Market Estimates and Forecasts, By Animal Type (2020-2032) (USD Million)
10.3.2.9.2 Italy Veterinary Microchips Market Estimates and Forecasts, By Distribution Channel (2020-2032) (USD Million)
10.3.2.9.3 Italy Veterinary Microchips Market Estimates and Forecasts, By Scanner type (2020-2032) (USD Million)
10.3.2.10 Spain
10.3.2.10.1 Spain Veterinary Microchips Market Estimates and Forecasts, By Animal Type (2020-2032) (USD Million)
10.3.2.10.2 Spain Veterinary Microchips Market Estimates and Forecasts, By Distribution Channel (2020-2032) (USD Million)
10.3.2.10.3 Spain Veterinary Microchips Market Estimates and Forecasts, By Scanner type (2020-2032) (USD Million)
10.3.2.11 Netherlands
10.3.2.11.1 Netherlands Veterinary Microchips Market Estimates and Forecasts, By Animal Type (2020-2032) (USD Million)
10.3.2.11.2 Netherlands Veterinary Microchips Market Estimates and Forecasts, By Distribution Channel (2020-2032) (USD Million)
10.3.2.11.3 Netherlands Veterinary Microchips Market Estimates and Forecasts, By Scanner type (2020-2032) (USD Million)
10.3.2.12 Switzerland
10.3.2.12.1 Switzerland Veterinary Microchips Market Estimates and Forecasts, By Animal Type (2020-2032) (USD Million)
10.3.2.12.2 Switzerland Veterinary Microchips Market Estimates and Forecasts, By Distribution Channel (2020-2032) (USD Million)
10.3.2.12.3 Switzerland Veterinary Microchips Market Estimates and Forecasts, By Scanner type (2020-2032) (USD Million)
10.3.2.13 Austria
10.3.2.13.1 Austria Veterinary Microchips Market Estimates and Forecasts, By Animal Type (2020-2032) (USD Million)
10.3.2.13.2 Austria Veterinary Microchips Market Estimates and Forecasts, By Distribution Channel (2020-2032) (USD Million)
10.3.2.13.3 Austria Veterinary Microchips Market Estimates and Forecasts, By Scanner type (2020-2032) (USD Million)
10.3.2.14 Rest of Western Europe
10.3.2.14.1 Rest of Western Europe Veterinary Microchips Market Estimates and Forecasts, By Animal Type (2020-2032) (USD Million)
10.3.2.14.2 Rest of Western Europe Veterinary Microchips Market Estimates and Forecasts, By Distribution Channel (2020-2032) (USD Million)
10.3.2.14.3 Rest of Western Europe Veterinary Microchips Market Estimates and Forecasts, By Scanner type (2020-2032) (USD Million)
10.4 Asia Pacific
10.4.1 Trends Analysis
10.4.2 Asia Pacific Veterinary Microchips Market Estimates and Forecasts, by Country (2020-2032) (USD Million)
10.4.3 Asia Pacific Veterinary Microchips Market Estimates and Forecasts, By Animal Type (2020-2032) (USD Million)
10.4.4 Asia Pacific Veterinary Microchips Market Estimates and Forecasts, By Distribution Channel (2020-2032) (USD Million)
10.4.5 Asia Pacific Veterinary Microchips Market Estimates and Forecasts, By Scanner type (2020-2032) (USD Million)
10.4.6 China
10.4.6.1 China Veterinary Microchips Market Estimates and Forecasts, By Animal Type (2020-2032) (USD Million)
10.4.6.2 China Veterinary Microchips Market Estimates and Forecasts, By Distribution Channel (2020-2032) (USD Million)
10.4.6.3 China Veterinary Microchips Market Estimates and Forecasts, By Scanner type (2020-2032) (USD Million)
10.4.7 India
10.4.7.1 India Veterinary Microchips Market Estimates and Forecasts, By Animal Type (2020-2032) (USD Million)
10.4.7.2 India Veterinary Microchips Market Estimates and Forecasts, By Distribution Channel (2020-2032) (USD Million)
10.4.7.3 India Veterinary Microchips Market Estimates and Forecasts, By Scanner type (2020-2032) (USD Million)
10.4.8 Japan
10.4.8.1 Japan Veterinary Microchips Market Estimates and Forecasts, By Animal Type (2020-2032) (USD Million)
10.4.8.2 Japan Veterinary Microchips Market Estimates and Forecasts, By Distribution Channel (2020-2032) (USD Million)
10.4.8.3 Japan Veterinary Microchips Market Estimates and Forecasts, By Scanner type (2020-2032) (USD Million)
10.4.9 South Korea
10.4.9.1 South Korea Veterinary Microchips Market Estimates and Forecasts, By Animal Type (2020-2032) (USD Million)
10.4.9.2 South Korea Veterinary Microchips Market Estimates and Forecasts, By Distribution Channel (2020-2032) (USD Million)
10.4.9.3 South Korea Veterinary Microchips Market Estimates and Forecasts, By Scanner type (2020-2032) (USD Million)
10.4.10 Vietnam
10.4.10.1 Vietnam Veterinary Microchips Market Estimates and Forecasts, By Animal Type (2020-2032) (USD Million)
10.4.10.2 Vietnam Veterinary Microchips Market Estimates and Forecasts, By Distribution Channel (2020-2032) (USD Million)
10.4.10.3 Vietnam Veterinary Microchips Market Estimates and Forecasts, By Scanner type (2020-2032) (USD Million)
10.4.11 Singapore
10.4.11.1 Singapore Veterinary Microchips Market Estimates and Forecasts, By Animal Type (2020-2032) (USD Million)
10.4.11.2 Singapore Veterinary Microchips Market Estimates and Forecasts, By Distribution Channel (2020-2032) (USD Million)
10.4.11.3 Singapore Veterinary Microchips Market Estimates and Forecasts, By Scanner type (2020-2032) (USD Million)
10.4.12 Australia
10.4.12.1 Australia Veterinary Microchips Market Estimates and Forecasts, By Animal Type (2020-2032) (USD Million)
10.4.12.2 Australia Veterinary Microchips Market Estimates and Forecasts, By Distribution Channel (2020-2032) (USD Million)
10.4.12.3 Australia Veterinary Microchips Market Estimates and Forecasts, By Scanner type (2020-2032) (USD Million)
10.4.13 Rest of Asia Pacific
10.4.13.1 Rest of Asia Pacific Veterinary Microchips Market Estimates and Forecasts, By Animal Type (2020-2032) (USD Million)
10.4.13.2 Rest of Asia Pacific Veterinary Microchips Market Estimates and Forecasts, By Distribution Channel (2020-2032) (USD Million)
10.4.13.3 Rest of Asia Pacific Veterinary Microchips Market Estimates and Forecasts, By Scanner type (2020-2032) (USD Million)
10.5 Middle East and Africa
10.5.1 Middle East
10.5.1.1 Trends Analysis
10.5.1.2 Middle East Veterinary Microchips Market Estimates and Forecasts, by Country (2020-2032) (USD Million)
10.5.1.3 Middle East Veterinary Microchips Market Estimates and Forecasts, By Animal Type (2020-2032) (USD Million)
10.5.1.4 Middle East Veterinary Microchips Market Estimates and Forecasts, By Distribution Channel (2020-2032) (USD Million)
10.5.1.5 Middle East Veterinary Microchips Market Estimates and Forecasts, By Scanner type (2020-2032) (USD Million)
10.5.1.6 UAE
10.5.1.6.1 UAE Veterinary Microchips Market Estimates and Forecasts, By Animal Type (2020-2032) (USD Million)
10.5.1.6.2 UAE Veterinary Microchips Market Estimates and Forecasts, By Distribution Channel (2020-2032) (USD Million)
10.5.1.6.3 UAE Veterinary Microchips Market Estimates and Forecasts, By Scanner type (2020-2032) (USD Million)
10.5.1.7 Egypt
10.5.1.7.1 Egypt Veterinary Microchips Market Estimates and Forecasts, By Animal Type (2020-2032) (USD Million)
10.5.1.7.2 Egypt Veterinary Microchips Market Estimates and Forecasts, By Distribution Channel (2020-2032) (USD Million)
10.5.1.7.3 Egypt Veterinary Microchips Market Estimates and Forecasts, By Scanner type (2020-2032) (USD Million)
10.5.1.8 Saudi Arabia
10.5.1.8.1 Saudi Arabia Veterinary Microchips Market Estimates and Forecasts, By Animal Type (2020-2032) (USD Million)
10.5.1.8.2 Saudi Arabia Veterinary Microchips Market Estimates and Forecasts, By Distribution Channel (2020-2032) (USD Million)
10.5.1.8.3 Saudi Arabia Veterinary Microchips Market Estimates and Forecasts, By Scanner type (2020-2032) (USD Million)
10.5.1.9 Qatar
10.5.1.9.1 Qatar Veterinary Microchips Market Estimates and Forecasts, By Animal Type (2020-2032) (USD Million)
10.5.1.9.2 Qatar Veterinary Microchips Market Estimates and Forecasts, By Distribution Channel (2020-2032) (USD Million)
10.5.1.9.3 Qatar Veterinary Microchips Market Estimates and Forecasts, By Scanner type (2020-2032) (USD Million)
10.5.1.10 Rest of Middle East
10.5.1.10.1 Rest of Middle East Veterinary Microchips Market Estimates and Forecasts, By Animal Type (2020-2032) (USD Million)
10.5.1.10.2 Rest of Middle East Veterinary Microchips Market Estimates and Forecasts, By Distribution Channel (2020-2032) (USD Million)
10.5.1.10.3 Rest of Middle East Veterinary Microchips Market Estimates and Forecasts, By Scanner type (2020-2032) (USD Million)
10.5.2 Africa
10.5.2.1 Trends Analysis
10.5.2.2 Africa Veterinary Microchips Market Estimates and Forecasts, by Country (2020-2032) (USD Million)
10.5.2.3 Africa Veterinary Microchips Market Estimates and Forecasts, By Animal Type (2020-2032) (USD Million)
10.5.2.4 Africa Veterinary Microchips Market Estimates and Forecasts, By Distribution Channel (2020-2032) (USD Million)
10.5.2.5 Africa Veterinary Microchips Market Estimates and Forecasts, By Scanner type (2020-2032) (USD Million)
10.5.2.6 South Africa
10.5.2.6.1 South Africa Veterinary Microchips Market Estimates and Forecasts, By Animal Type (2020-2032) (USD Million)
10.5.2.6.2 South Africa Veterinary Microchips Market Estimates and Forecasts, By Distribution Channel (2020-2032) (USD Million)
10.5.2.6.3 South Africa Veterinary Microchips Market Estimates and Forecasts, By Scanner type (2020-2032) (USD Million)
10.5.2.7 Nigeria
10.5.2.7.1 Nigeria Veterinary Microchips Market Estimates and Forecasts, By Animal Type (2020-2032) (USD Million)
10.5.2.7.2 Nigeria Veterinary Microchips Market Estimates and Forecasts, By Distribution Channel (2020-2032) (USD Million)
10.5.2.7.3 Nigeria Veterinary Microchips Market Estimates and Forecasts, By Scanner type (2020-2032) (USD Million)
10.5.2.8 Rest of Africa
10.5.2.8.1 Rest of Africa Veterinary Microchips Market Estimates and Forecasts, By Animal Type (2020-2032) (USD Million)
10.5.2.8.2 Rest of Africa Veterinary Microchips Market Estimates and Forecasts, By Distribution Channel (2020-2032) (USD Million)
10.5.2.8.3 Rest of Africa Veterinary Microchips Market Estimates and Forecasts, By Scanner type (2020-2032) (USD Million)
10.6 Latin America
10.6.1 Trends Analysis
10.6.2 Latin America Veterinary Microchips Market Estimates and Forecasts, by Country (2020-2032) (USD Million)
10.6.3 Latin America Veterinary Microchips Market Estimates and Forecasts, By Animal Type (2020-2032) (USD Million)
10.6.4 Latin America Veterinary Microchips Market Estimates and Forecasts, By Distribution Channel (2020-2032) (USD Million)
10.6.5 Latin America Veterinary Microchips Market Estimates and Forecasts, By Scanner type (2020-2032) (USD Million)
10.6.6 Brazil
10.6.6.1 Brazil Veterinary Microchips Market Estimates and Forecasts, By Animal Type (2020-2032) (USD Million)
10.6.6.2 Brazil Veterinary Microchips Market Estimates and Forecasts, By Distribution Channel (2020-2032) (USD Million)
10.6.6.3 Brazil Veterinary Microchips Market Estimates and Forecasts, By Scanner type (2020-2032) (USD Million)
10.6.7 Argentina
10.6.7.1 Argentina Veterinary Microchips Market Estimates and Forecasts, By Animal Type (2020-2032) (USD Million)
10.6.7.2 Argentina Veterinary Microchips Market Estimates and Forecasts, By Distribution Channel (2020-2032) (USD Million)
10.6.7.3 Argentina Veterinary Microchips Market Estimates and Forecasts, By Scanner type (2020-2032) (USD Million)
10.6.8 Colombia
10.6.8.1 Colombia Veterinary Microchips Market Estimates and Forecasts, By Animal Type (2020-2032) (USD Million)
10.6.8.2 Colombia Veterinary Microchips Market Estimates and Forecasts, By Distribution Channel (2020-2032) (USD Million)
10.6.8.3 Colombia Veterinary Microchips Market Estimates and Forecasts, By Scanner type (2020-2032) (USD Million)
10.6.9 Rest of Latin America
10.6.9.1 Rest of Latin America Veterinary Microchips Market Estimates and Forecasts, By Animal Type (2020-2032) (USD Million)
10.6.9.2 Rest of Latin America Veterinary Microchips Market Estimates and Forecasts, By Distribution Channel (2020-2032) (USD Million)
10.6.9.3 Rest of Latin America Veterinary Microchips Market Estimates and Forecasts, By Scanner type (2020-2032) (USD Million)
11. Company Profiles
11.1 Allflex Livestock Intelligence
11.1.1 Company Overview
11.1.2 Financial
11.1.3 Products/ Services Offered
11.1.4 SWOT Analysis
11.2 Datamars Pet ID
11.2.1 Company Overview
11.2.2 Financial
11.2.3 Products/ Services Offered
11.2.4 SWOT Analysis
11.3 AdvaCare Pharma
11.3.1 Company Overview
11.3.2 Financial
11.3.3 Products/ Services Offered
11.3.4 SWOT Analysis
11.4 EIDAP Inc.
11.4.1 Company Overview
11.4.2 Financial
11.4.3 Products/ Services Offered
11.4.4 SWOT Analysis
11.5 Pet Pulse
11.5.1 Company Overview
11.5.2 Financial
11.5.3 Products/ Services Offered
11.5.4 SWOT Analysis
11.6 PetLink
11.6.1 Company Overview
11.6.2 Financial
11.6.3 Products/ Services Offered
11.6.4 SWOT Analysis
11.7 Trovan
11.7.1 Company Overview
11.7.2 Financial
11.7.3 Products/ Services Offered
11.7.4 SWOT Analysis
11.8 HomeAgain
11.8.1 Company Overview
11.8.2 Financial
11.8.3 Products/ Services Offered
11.8.4 SWOT Analysis
11.9 AVID Identification Systems
11.9.1 Company Overview
11.9.2 Financial
11.9.3 Products/ Services Offered
11.9.4 SWOT Analysis
11.10 Microchip ID Systems
11.10.1 Company Overview
11.10.2 Financial
11.10.3 Products/ Services Offered
11.10.4 SWOT Analysis
12. Use Cases and Best Practices
13. Conclusion
An accurate research report requires proper strategizing as well as implementation. There are multiple factors involved in the completion of good and accurate research report and selecting the best methodology to compete the research is the toughest part. Since the research reports we provide play a crucial role in any company’s decision-making process, therefore we at SNS Insider always believe that we should choose the best method which gives us results closer to reality. This allows us to reach at a stage wherein we can provide our clients best and accurate investment to output ratio.
Each report that we prepare takes a timeframe of 350-400 business hours for production. Starting from the selection of titles through a couple of in-depth brain storming session to the final QC process before uploading our titles on our website we dedicate around 350 working hours. The titles are selected based on their current market cap and the foreseen CAGR and growth.
The 5 steps process:
Step 1: Secondary Research:
Secondary Research or Desk Research is as the name suggests is a research process wherein, we collect data through the readily available information. In this process we use various paid and unpaid databases which our team has access to and gather data through the same. This includes examining of listed companies’ annual reports, Journals, SEC filling etc. Apart from this our team has access to various associations across the globe across different industries. Lastly, we have exchange relationships with various university as well as individual libraries.

Step 2: Primary Research
When we talk about primary research, it is a type of study in which the researchers collect relevant data samples directly, rather than relying on previously collected data. This type of research is focused on gaining content specific facts that can be sued to solve specific problems. Since the collected data is fresh and first hand therefore it makes the study more accurate and genuine.
We at SNS Insider have divided Primary Research into 2 parts.
Part 1 wherein we interview the KOLs of major players as well as the upcoming ones across various geographic regions. This allows us to have their view over the market scenario and acts as an important tool to come closer to the accurate market numbers. As many as 45 paid and unpaid primary interviews are taken from both the demand and supply side of the industry to make sure we land at an accurate judgement and analysis of the market.
This step involves the triangulation of data wherein our team analyses the interview transcripts, online survey responses and observation of on filed participants. The below mentioned chart should give a better understanding of the part 1 of the primary interview.

Part 2: In this part of primary research the data collected via secondary research and the part 1 of the primary research is validated with the interviews from individual consultants and subject matter experts.
Consultants are those set of people who have at least 12 years of experience and expertise within the industry whereas Subject Matter Experts are those with at least 15 years of experience behind their back within the same space. The data with the help of two main processes i.e., FGDs (Focused Group Discussions) and IDs (Individual Discussions). This gives us a 3rd party nonbiased primary view of the market scenario making it a more dependable one while collation of the data pointers.
Step 3: Data Bank Validation
Once all the information is collected via primary and secondary sources, we run that information for data validation. At our intelligence centre our research heads track a lot of information related to the market which includes the quarterly reports, the daily stock prices, and other relevant information. Our data bank server gets updated every fortnight and that is how the information which we collected using our primary and secondary information is revalidated in real time.

Step 4: QA/QC Process
After all the data collection and validation our team does a final level of quality check and quality assurance to get rid of any unwanted or undesired mistakes. This might include but not limited to getting rid of the any typos, duplication of numbers or missing of any important information. The people involved in this process include technical content writers, research heads and graphics people. Once this process is completed the title gets uploader on our platform for our clients to read it.
Step 5: Final QC/QA Process:
This is the last process and comes when the client has ordered the study. In this process a final QA/QC is done before the study is emailed to the client. Since we believe in giving our clients a good experience of our research studies, therefore, to make sure that we do not lack at our end in any way humanly possible we do a final round of quality check and then dispatch the study to the client.
By Animal Type
Dogs
Horses
Cats
Others
By Distribution Channel
Veterinary Hospitals/clinics
Others
By Scanner type
134.2 KHz
125 KHz
128 KHz
Request for Segment Customization as per your Business Requirement: Segment Customization Request
North America
US
Canada
Mexico
Europe
Eastern Europe
Poland
Romania
Hungary
Turkey
Rest of Eastern Europe
Western Europe
Germany
France
UK
Italy
Spain
Netherlands
Switzerland
Austria
Rest of Western Europe
Asia Pacific
China
India
Japan
South Korea
Vietnam
Singapore
Australia
Rest of Asia Pacific
Middle East & Africa
Middle East
UAE
Egypt
Saudi Arabia
Qatar
Rest of Middle East
Africa
Nigeria
South Africa
Rest of Africa
Latin America
Brazil
Argentina
Colombia
Rest of Latin America
Request for Country Level Research Report: Country Level Customization Request
Available Customization
With the given market data, SNS Insider offers customization as per the company’s specific needs. The following customization options are available for the report:
Detailed Volume Analysis
Criss-Cross segment analysis (e.g. Product X Application)
Competitive Product Benchmarking
Geographic Analysis
Additional countries in any of the regions
Customized Data Representation
Detailed analysis and profiling of additional market players
The Cold Pain Therapy Market Size was valued at USD 1.91 billion in 2023, and is expected to reach USD 2.96 billion by 2032, and grow at a CAGR of 5% over the forecast period 2024-2032.
Capillary Electrophoresis Market size was USD 354.7 Million in 2023, expected to reach USD 567.7 Million by 2032, growing at a CAGR of 5.38% from 2024-2032.
Genomic Medicine Market was valued at USD 25.35 billion in 2023 and is expected to reach USD 86.35 billion by 2032, growing at a CAGR of 14.64% from 2024-2032.
The Anastomosis Devices Market Size was valued at USD 3.61 billion in 2023 and is expected to reach USD 6.63 billion by 2032 and grow at a CAGR of 7.01% over the forecast period 2024-2032.
PARP Inhibitor Biomarkers Market was valued at USD 901.25 million in 2023 and is expected to reach USD 1892.80 million by 2032, growing at a CAGR of 8.64% from 2024-2032.
The Medical Collagen Market size was valued at USD 2981.59 million in 2023 and is expected to reach USD 5213.32 million by 2032, growing at a CAGR of 6.45% over the forecast period 2024-2032.

Hi! Click one of our member below to chat on Phone
© 2025 All Rights Reserved by SNS Insider Pvt Ltd


