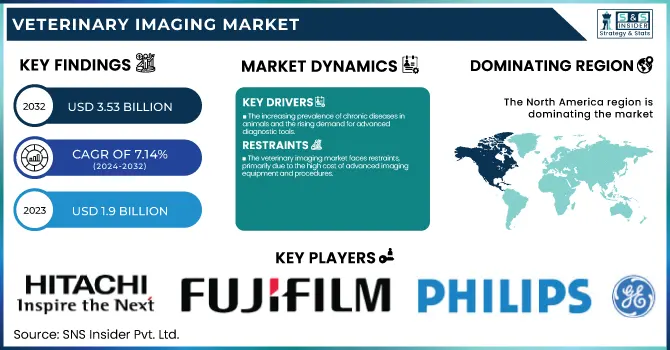
The Global Veterinary Imaging Market was valued at USD 1.9 billion in 2023 and is projected to grow at a CAGR of 7.14% from 2024 to 2032, reaching USD 3.53 billion by 2032.
Get More Information on Veterinary Imaging Market - Request Sample Report
This Report illustrates the growing occurrence and prevalence of veterinary illness, propelling the need for next-generation imaging technology, and evaluates regional veterinary health spending, comprised of government appropriation, commercial funding, private health expenditure, and out-of-pocket expenses. It discusses technical breakthroughs in veterinary imaging technology, including artificial intelligence-based diagnosis and mobile imaging solutions, while providing an evaluation of veterinary imaging fee trends and its availability across regions. Furthermore, it determines the increasing demand for point-of-care veterinary imaging as a consequence of the desire for quicker diagnosis, and calculates the replacement rate and life span of imaging technology, influencing purchase behavior and general market trends.
Drivers
The increasing prevalence of chronic diseases in animals and the rising demand for advanced diagnostic tools.
With an increasing number of pets, there is an increased prevalence of diseases like arthritis, cancer, and cardiovascular disease in companion animals, making the application of imaging modalities such as X-ray, MRI, and ultrasound necessary. Furthermore, advances in technology, such as AI-based imaging analysis and handheld imaging equipment, are enhancing diagnostic precision and accessibility. The rising spending on pet health is another key factor, with owners of pets shelling out more for advanced diagnosis and treatment. For instance, the American Pet Products Association (APPA) has noted that U.S. pet owners spent more than USD 35 billion on veterinary care and diagnostics in 2023. The growing application of telemedicine and cloud-based PACS (Picture Archiving and Communication Systems) also contributes to market growth by enabling veterinarians to remotely access and analyze images. Moreover, growing awareness of livestock health, fueled by food safety issues and government regulations, is boosting the use of imaging solutions in the agricultural industry. With more veterinary clinics adopting advanced imaging technologies, the demand for advanced and affordable diagnostic tools is likely to keep growing.
Restraints
The veterinary imaging market faces restraints, primarily due to the high cost of advanced imaging equipment and procedures.
MRI and CT scanners, for example, demand high investment with prices between USD 150,000 and USD 500,000, hence being out of reach for smaller veterinary clinics. Moreover, high imaging service charges deter pet owners from seeking enhanced diagnostic tests, particularly in lower disposable income areas. An MRI scan for one pet can charge anywhere from USD 1,500 to USD 2,500, thereby being a very costly affair. Another limitation is the unavailability of trained veterinary radiologists, thereby restricting the full utilization of advanced imaging modalities. Most veterinarians continue to use conventional methods of diagnosis as a result of the unavailability of trained professionals to interpret the results of complicated imaging. In addition, the lengthy approval process for veterinary imaging equipment by regulatory bodies, including the FDA and the European Medicines Agency (EMA), holds back the entry of new technologies into the market. These regulatory barriers and compliance expenses pose challenges to manufacturers seeking to diversify their product offerings. Consequently, even with high demand, these economic and logistical hurdles slow down the mass adoption of advanced veterinary imaging solutions.
Opportunities
The veterinary imaging market presents several growth opportunities, particularly with the rise of artificial intelligence (AI) and machine learning in diagnostic imaging.
AI-based imaging technologies have the potential to improve diagnostic precision and enable image interpretation without the need for trained radiologists. Firms like SignalPET and Vetology AI already have AI-based veterinary radiology technology under development, augmenting efficiency in diagnostic processes. The use of portable and point-of-care imaging equipment is growing considerably, especially among rural and mobile veterinary clinics. Portable X-ray units and handheld ultrasound devices allow veterinarians to make on-the-spot diagnoses in rural locations, enhancing access to imaging solutions. Growing pet insurance uptake is also set to boost demand, as increasing numbers of pet owners take out policies that cover diagnostic imaging services. The North American Pet Health Insurance Association (NAPHIA) finds that more than 4 million pets were insured in 2023, with image costs covered under most policies. In addition, increasing demand for sophisticated veterinary treatments such as oncology, neurology, and cardiology is encouraging veterinary clinics to invest in sophisticated imaging equipment. With ongoing investment in R&D and an expansion of veterinary facilities, the market is anticipated to see additional innovation and increased accessibility of imaging solutions.
Challenges
The limited reimbursement policies for veterinary diagnostic procedures, which often results in high out-of-pocket expenses for pet owners.
Compared to human health, where diagnosis imaging is typically insured, animal imaging is generally self-funded and therefore not being widely used. Equipment maintenance, too, becomes a huge constraint for veterinary centers, as state-of-the-art machines need continuous servicing, new software, and specialized experts on a regular basis, increasing their economic burden on veterinary centers. Another limitation is the absence of standardization in veterinary imaging procedures, which impinges on diagnostic precision and consistency. Unlike human medicine, veterinary imaging lacks a set of universal imaging guidelines, resulting in inconsistencies in diagnosis and treatment planning. In addition, radiation exposure issues in veterinary X-ray and CT imaging are a challenge, given that regulatory agencies stress greater safety standards for veterinary clinicians and pet owners. The gradual uptake of advanced imaging in developing markets owing to affordability limitations and a lack of veterinary infrastructure further limits market growth. This can be overcome through cooperation between industry stakeholders, regulatory authorities, and veterinary schools to enhance affordability, accessibility, and technological harmonization in veterinary imaging.
By Product
The X-ray segment held the largest share of revenue, at 37.7%, in 2023 for the veterinary imaging market. The prevalence of using X-ray imaging to diagnose fractures, arthritis, and respiratory disorders in both small and large animals made it the leader in the market. Its cost-effectiveness, rapid results, and availability in veterinary hospitals and clinics also promoted its use.
The video endoscopy segment is anticipated to be the fastest-growing segment. The rising demand for minimally invasive diagnostic procedures, especially in gastrointestinal and respiratory tests, is driving its growth. Developments in flexible and high-resolution endoscopic systems are also driving its adoption among veterinarians.
By Solutions
The equipment segment held the highest share of revenue of 55.7% in 2023. The expensive nature of imaging equipment like X-ray machines, ultrasound machines, and MRI scanners was a major factor behind the dominance of the segment. The increasing presence of veterinary hospitals and clinics that have this advanced diagnostic equipment also strengthened its market leadership.
The PACS (Picture Archiving and Communication System) segment is expected to expand at the highest rate. The growing requirement for storing digital images, remote access to diagnostic images, and smooth integration with telemedicine solutions are fueling the demand for PACS in veterinary imaging.
By Animal Type
The small animals segment accounted for the highest share of 69.4% in 2023 due to the increasing trend of pet ownership, growing healthcare spending on companion animals, and rising awareness of preventive diagnostics. Dogs and cats account for most veterinary imaging procedures such as orthopedic, dental, and cardiology applications, hence dominating the segment.
The small animals segment is also projected to expand at the highest growth rate during the forecast period. The humanization of pets, technological improvements in imaging technology specific to small animals, and the rising incidence of long-term conditions like cancer and arthritis in pets are major drivers of its higher growth.
By Application
The orthopedics and traumatology segment led the market in 2023 with a revenue share of 37.8%. The prevalence of bone fractures, joint diseases, and ligament injuries, particularly among active and elderly pets, was responsible for the segment's dominance. The need for accurate imaging modalities, such as X-ray and MRI, for the diagnosis of musculoskeletal disorders further increased its uptake.
The oncology segment will witness the highest growth. Increasing incidence of cancer in pets and rising awareness along with technological developments in imaging technologies like MRI and CT for detecting tumors at early stages are spurring the rapid growth of the segment. Increasing use of targeted cancer therapies in veterinary medicine is also boosting demand for sophisticated imaging solutions.
By End-use
The veterinary hospitals and clinics segment commanded the largest market share of 64.9% in 2023. The dominance of this segment can be contributed to the ubiquitous availability of sophisticated imaging technologies, the rising number of patient visits for diagnostic imaging procedures, and the rising number of specialized veterinary healthcare centers. Veterinary hospitals and clinics provide a complete array of imaging services, thereby being the prime end-users of diagnostic imaging devices.
The segment of veterinary clinics and hospitals is also anticipated to expand at the highest rate. The trend towards pet insurance coverage, increased investments in veterinary facilities, and escalating demand for advanced imaging services are major drivers contributing to the growth of the segment at a very high rate. The growth of multi-specialty veterinary centers is also supporting its high growth path.
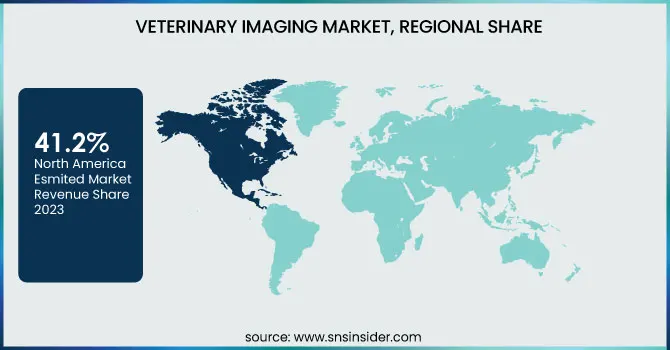
North America led the in the veterinary imaging market in 2023, with a revenue share of 41.2%. Its leadership is especially influenced by the high uptake of advanced imaging technologies, a developed veterinary healthcare infrastructure, and the rising incidence of chronic diseases among companion animals. The growing pet population, coupled with increased expenditure on pet healthcare, has driven demand for diagnostic imaging products. Moreover, the market presence of influential players, on-going technology progress, and telemedicine's expanding use have contributed to the prevalence of the veterinary imaging market in North America further. Pet insurance availability and policy support by government for veterinary health also influence the region's stable market position considerably.
The veterinary imaging market of the Asia-Pacific region is forecasted to emerge as the region with the fastest growth. The growth of veterinary healthcare facilities at a rapid pace, rising pet health awareness, and the growing number of pets being adopted in nations like China, India, and Japan are central drivers propelling the growth of the market. Moreover, economic growth and growing disposable income are driving expenditure on pets' diagnostics and treatments. The growing need for sophisticated imaging modalities, combined with an expanding number of veterinary hospitals and clinics, is driving the adoption of veterinary imaging solutions in the Asia-Pacific region.
Get Customized Report as per Your Business Requirement - Enquiry Now
IDEXX Laboratories, Inc. – Digital Radiography, Ultrasound Systems, PACS
ESAOTE S.p.A. – Veterinary Ultrasound Systems, MRI Scanners
Mars, Inc. – Veterinary Diagnostic Imaging Solutions
GE HealthCare – X-ray Systems, Ultrasound, CT, MRI for Veterinary Use
Midmark Corporation – Veterinary Digital X-ray Systems, Dental Imaging
FUJIFILM Holdings America Corporation – Digital Radiography, PACS, Veterinary Ultrasound
Hallmarq Veterinary Imaging – MRI and CT Imaging for Companion and Equine Animals
Canon Medical Systems Corporation – Veterinary Ultrasound, X-ray, CT Imaging
Shenzhen Mindray Animal Medical Technology Co., Ltd. – Veterinary Ultrasound, X-ray, CT Systems
IMV Imaging – Veterinary Ultrasound, X-ray Systems, PACS
In Oct 2024, WOORIEN Co., Ltd. introduced 'MyVet CT Plus', an advanced veterinary imaging solution and successor to the 'MyVet CT i3D', the world’s first animal spiral CT launched in 2018. This latest innovation enhances imaging capabilities for veterinary diagnostics.
In April 2024, Antech launched two breakthrough veterinary diagnostic tools: AIS RapidRead, an AI-powered radiology solution for faster radiograph interpretation, and the Nu.Q Canine Cancer Test, an in-house screening tool for early cancer detection. These innovations enhance clinical decision-making and improve patient outcomes.
Report Attributes | Details |
Market Size in 2023 | USD 1.9 billion |
Market Size by 2032 | USD 3.53 billion |
CAGR | CAGR of 7.14% From 2024 to 2032 |
Base Year | 2023 |
Forecast Period | 2024-2032 |
Historical Data | 2020-2022 |
Report Scope & Coverage | Market Size, Segments Analysis, Competitive Landscape, Regional Analysis, DROC & SWOT Analysis, Forecast Outlook |
Key Segments | • By Product [X-ray, Ultrasound, MRI, CT Imaging, Video Endoscopy] • By Solutions [Equipment, Accessories/ Consumables, PACS] By Animal Type [Small Animals, Large Animals] • By Application [Orthopedics and Traumatology, Oncology, Cardiology, Neurology, Respiratory, Dental Application, Other] • By End-use [Veterinary Hospitals & Clinics, Other End-use] |
Regional Analysis/Coverage | North America (US, Canada, Mexico), Europe (Eastern Europe [Poland, Romania, Hungary, Turkey, Rest of Eastern Europe] Western Europe] Germany, France, UK, Italy, Spain, Netherlands, Switzerland, Austria, Rest of Western Europe]), Asia Pacific (China, India, Japan, South Korea, Vietnam, Singapore, Australia, Rest of Asia Pacific), Middle East & Africa (Middle East [UAE, Egypt, Saudi Arabia, Qatar, Rest of Middle East], Africa [Nigeria, South Africa, Rest of Africa], Latin America (Brazil, Argentina, Colombia, Rest of Latin America) |
Company Profiles | IDEXX Laboratories, Inc., ESAOTE S.p.A., Mars, Inc., GE HealthCare, Midmark Corporation, FUJIFILM Holdings America Corporation, Hallmarq Veterinary Imaging, Canon Medical Systems Corporation, Shenzhen Mindray Animal Medical Technology Co., Ltd., IMV Imaging |
Ans. The Compound Annual Growth rate for Veterinary Imagings Market over the forecast period is 7.14%.
Ans. USD 3.53 Billion is the projected Veterinary Imaging market size of the market by 2032.
Ans. The veterinary imaging market's most significant category for growth is companion animals. This is a result of the worldwide increase in companion animal ownership. The market is expanding due to increased awareness of the need for early identification of illnesses in companion animals for effective treatment.
Ans. The region with the largest growth rate in the market is Asia-Pacific, which is expanding as a result of the contribution of the following rising nations, including China, which has a CAGR of 8.9%. This is a result of an increase in the cost of animal health care and increased knowledge about the use of veterinary imaging in treating disease issues in animals.
Ans. Some of the main drivers influencing market revenue growth are increased pet adoption rates, an increase in the frequency of zoonotic illnesses, and technical developments in veterinary imaging services.
Table of Contents:
1. Introduction
1.1 Market Definition
1.2 Scope (Inclusion and Exclusions)
1.3 Research Assumptions
2. Executive Summary
2.1 Market Overview
2.2 Regional Synopsis
2.3 Competitive Summary
3. Research Methodology
3.1 Top-Down Approach
3.2 Bottom-up Approach
3.3. Data Validation
3.4 Primary Interviews
4. Market Dynamics Impact Analysis
4.1 Market Driving Factors Analysis
4.1.1 Drivers
4.1.2 Restraints
4.1.3 Opportunities
4.1.4 Challenges
4.2 PESTLE Analysis
4.3 Porter’s Five Forces Model
5. Statistical Insights and Trends Reporting
5.1 Incidence and Prevalence of Veterinary Diseases (2023)
5.2 Veterinary Healthcare Expenditure, by Region (Government, Commercial, Private, Out-of-Pocket), 2023
5.3 Technological Advancements in Veterinary Imaging (2020-2032)
5.4 Pricing Trends for Veterinary Imaging Services (2023-2032)
5.5 Demand for Point-of-Care Veterinary Imaging (2023-2032)
5.6 Veterinary Imaging Equipment Replacement Rate and Lifespan (2023-2032)
6. Competitive Landscape
6.1 List of Major Companies, By Region
6.2 Market Share Analysis, By Region
6.3 Product Benchmarking
6.3.1 Product specifications and features
6.3.2 Pricing
6.4 Strategic Initiatives
6.4.1 Marketing and promotional activities
6.4.2 Distribution and Supply Chain Strategies
6.4.3 Expansion plans and new product launches
6.4.4 Strategic partnerships and collaborations
6.5 Technological Advancements
6.6 Market Positioning and Branding
7. Veterinary Imaging Market Segmentation, by Product
7.1 Chapter Overview
7.2 X-ray
7.2.1 X-ray Market Trends Analysis (2020-2032)
7.2.2 X-ray Market Size Estimates and Forecasts to 2032 (USD Billion)
7.3 Ultrasound
7.3.1 Ultrasound Market Trends Analysis (2020-2032)
7.3.2 Ultrasound Market Size Estimates and Forecasts to 2032 (USD Billion)
7.4 MRI
7.4.1 MRI Market Trends Analysis (2020-2032)
7.4.2 MRI Market Size Estimates and Forecasts to 2032 (USD Billion)
7.5 CT Imaging
7.5.1 CT Imaging Market Trends Analysis (2020-2032)
7.5.2 CT Imaging Market Size Estimates and Forecasts to 2032 (USD Billion)
7.6 Video Endoscopy
7.6.1 Video Endoscopy Market Trends Analysis (2020-2032)
7.6.2 Video Endoscopy Market Size Estimates and Forecasts to 2032 (USD Billion)
8. Veterinary Imaging Market Segmentation, By Solutions
8.1 Chapter Overview
8.2 Equipment
8.2.1 Equipment Market Trends Analysis (2020-2032)
8.2.2 Equipment Market Size Estimates And Forecasts To 2032 (USD Billion)
8.3 Accessories/ Consumables
8.3.1 Accessories/ Consumables Market Trends Analysis (2020-2032)
8.3.2 Accessories/ Consumables Market Size Estimates And Forecasts To 2032 (USD Billion)
8.4 PACS
8.4.1 PACS Market Trends Analysis (2020-2032)
8.4.2 PACS Market Size Estimates And Forecasts To 2032 (USD Billion)
9. Veterinary Imaging Market Segmentation, By Animal Type
9.1 Chapter Overview
9.2 Small Animals
9.2.1 Small Animals Market Trends Analysis (2020-2032)
9.2.2 Small Animals Market Size Estimates And Forecasts To 2032 (USD Billion)
9.3 Large Animals
9.3.1 Large Animals Market Trends Analysis (2020-2032)
9.3.2 Large Animals Market Size Estimates And Forecasts To 2032 (USD Billion)
10. Veterinary Imaging Market Segmentation, By Application
10.1 Chapter Overview
10.2 Orthopedics and Traumatology
10.2.1 Orthopedics and Traumatology Market Trends Analysis (2020-2032)
10.2.2 Orthopedics and Traumatology Market Size Estimates And Forecasts To 2032 (USD Billion)
10.3 Oncology
10.3.1 Oncology Market Trends Analysis (2020-2032)
10.3.2 Oncology Market Size Estimates And Forecasts To 2032 (USD Billion)
10.4 Cardiology
10.4.1 Cardiology Market Trends Analysis (2020-2032)
10.4.2 Cardiology Market Size Estimates And Forecasts To 2032 (USD Billion)
10.5 Neurology
10.5.1 Neurology Market Trends Analysis (2020-2032)
10.5.2 Neurology Market Size Estimates And Forecasts To 2032 (USD Billion)
10.6 Respiratory
10.6.1 Respiratory Market Trends Analysis (2020-2032)
10.6.2 Respiratory Market Size Estimates And Forecasts To 2032 (USD Billion)
10.7 Dental Application
10.7.1 Dental Application Market Trends Analysis (2020-2032)
10.7.2 Dental Application Market Size Estimates And Forecasts To 2032 (USD Billion)
10.8 Others
10.8.1 Others Market Trends Analysis (2020-2032)
10.8.2 Others Market Size Estimates And Forecasts To 2032 (USD Billion)
11. Veterinary Imaging Market Segmentation, By End-use
11.1 Chapter Overview
11.2 Veterinary Hospitals & Clinics
11.2.1 Veterinary Hospitals & Clinics Market Trends Analysis (2020-2032)
11.2.2 Veterinary Hospitals & Clinics Market Size Estimates And Forecasts To 2032 (USD Billion)
11.3 Other End-use
11.3.1 Other End-use Market Trends Analysis (2020-2032)
11.3.2 Other End-use Market Size Estimates And Forecasts To 2032 (USD Billion)
12. Regional Analysis
12.1 Chapter Overview
12.2 North America
12.2.1 Trends Analysis
12.2.2 North America Veterinary Imaging Market Estimates And Forecasts, By Country (2020-2032) (USD Billion)
12.2.3 North America Veterinary Imaging Market Estimates And Forecasts, By Product (2020-2032) (USD Billion)
12.2.4 North America Veterinary Imaging Market Estimates And Forecasts, By Solutions (2020-2032) (USD Billion)
12.2.5 North America Veterinary Imaging Market Estimates And Forecasts, By Animal Type (2020-2032) (USD Billion)
12.2.6 North America Veterinary Imaging Market Estimates And Forecasts, By Application (2020-2032) (USD Billion)
12.2.7 North America Veterinary Imaging Market Estimates And Forecasts, By End-use (2020-2032) (USD Billion)
12.2.8 USA
12.2.8.1 USA Veterinary Imaging Market Estimates And Forecasts, By Product (2020-2032) (USD Billion)
12.2.8.2 USA Veterinary Imaging Market Estimates And Forecasts, By Solutions (2020-2032) (USD Billion)
12.2.8.3 USA Veterinary Imaging Market Estimates And Forecasts, By Animal Type (2020-2032) (USD Billion)
12.2.8.4 USA Veterinary Imaging Market Estimates And Forecasts, By Application (2020-2032) (USD Billion)
12.2.8.5 USA Veterinary Imaging Market Estimates And Forecasts, By End-use (2020-2032) (USD Billion)
12.2.9 Canada
12.2.9.1 Canada Veterinary Imaging Market Estimates And Forecasts, By Product (2020-2032) (USD Billion)
12.2.9.2 Canada Veterinary Imaging Market Estimates And Forecasts, By Solutions (2020-2032) (USD Billion)
12.2.9.3 Canada Veterinary Imaging Market Estimates And Forecasts, By Animal Type (2020-2032) (USD Billion)
12.2.9.4 Canada Veterinary Imaging Market Estimates And Forecasts, By Application (2020-2032) (USD Billion)
12.2.9.5 Canada Veterinary Imaging Market Estimates And Forecasts, By End-use (2020-2032) (USD Billion)
12.2.10 Mexico
12.2.10.1 Mexico Veterinary Imaging Market Estimates And Forecasts, By Product (2020-2032) (USD Billion)
12.2.10.2 Mexico Veterinary Imaging Market Estimates And Forecasts, By Solutions (2020-2032) (USD Billion)
12.2.10.3 Mexico Veterinary Imaging Market Estimates And Forecasts, By Animal Type (2020-2032) (USD Billion)
12.2.10.4 Mexico Veterinary Imaging Market Estimates And Forecasts, By Application (2020-2032) (USD Billion)
12.2.10.5 Mexico Veterinary Imaging Market Estimates And Forecasts, By End-use (2020-2032) (USD Billion)
12.3 Europe
12.3.1 Eastern Europe
12.3.1.1 Trends Analysis
12.3.1.2 Eastern Europe Veterinary Imaging Market Estimates And Forecasts, By Country (2020-2032) (USD Billion)
12.3.1.3 Eastern Europe Veterinary Imaging Market Estimates And Forecasts, By Product (2020-2032) (USD Billion)
12.3.1.4 Eastern Europe Veterinary Imaging Market Estimates And Forecasts, By Solutions (2020-2032) (USD Billion)
12.3.1.5 Eastern Europe Veterinary Imaging Market Estimates And Forecasts, By Animal Type (2020-2032) (USD Billion)
12.3.1.6 Eastern Europe Veterinary Imaging Market Estimates And Forecasts, By Application (2020-2032) (USD Billion)
12.3.1.7 Eastern Europe Veterinary Imaging Market Estimates And Forecasts, By End-use (2020-2032) (USD Billion)
12.3.1.8 Poland
12.3.1.8.1 Poland Veterinary Imaging Market Estimates And Forecasts, By Product (2020-2032) (USD Billion)
12.3.1.8.2 Poland Veterinary Imaging Market Estimates And Forecasts, By Solutions (2020-2032) (USD Billion)
12.3.1.8.3 Poland Veterinary Imaging Market Estimates And Forecasts, By Animal Type (2020-2032) (USD Billion)
12.3.1.8.4 Poland Veterinary Imaging Market Estimates And Forecasts, By Application (2020-2032) (USD Billion)
12.3.1.8.5 Poland Veterinary Imaging Market Estimates And Forecasts, By End-use (2020-2032) (USD Billion)
12.3.1.9 Romania
12.3.1.9.1 Romania Veterinary Imaging Market Estimates And Forecasts, By Product (2020-2032) (USD Billion)
12.3.1.9.2 Romania Veterinary Imaging Market Estimates And Forecasts, By Solutions (2020-2032) (USD Billion)
12.3.1.9.3 Romania Veterinary Imaging Market Estimates And Forecasts, By Animal Type (2020-2032) (USD Billion)
12.3.1.9.4 Romania Veterinary Imaging Market Estimates And Forecasts, By Application (2020-2032) (USD Billion)
12.3.1.9.5 Romania Veterinary Imaging Market Estimates And Forecasts, By End-use (2020-2032) (USD Billion)
12.3.1.10 Hungary
12.3.1.10.1 Hungary Veterinary Imaging Market Estimates And Forecasts, By Product (2020-2032) (USD Billion)
12.3.1.10.2 Hungary Veterinary Imaging Market Estimates And Forecasts, By Solutions (2020-2032) (USD Billion)
12.3.1.10.3 Hungary Veterinary Imaging Market Estimates And Forecasts, By Animal Type (2020-2032) (USD Billion)
12.3.1.10.4 Hungary Veterinary Imaging Market Estimates And Forecasts, By Application (2020-2032) (USD Billion)
12.3.1.10.5 Hungary Veterinary Imaging Market Estimates And Forecasts, By End-use (2020-2032) (USD Billion)
12.3.1.11 Turkey
12.3.1.11.1 Turkey Veterinary Imaging Market Estimates And Forecasts, By Product (2020-2032) (USD Billion)
12.3.1.11.2 Turkey Veterinary Imaging Market Estimates And Forecasts, By Solutions (2020-2032) (USD Billion)
12.3.1.11.3 Turkey Veterinary Imaging Market Estimates And Forecasts, By Animal Type (2020-2032) (USD Billion)
12.3.1.11.4 Turkey Veterinary Imaging Market Estimates And Forecasts, By Application (2020-2032) (USD Billion)
12.3.1.11.5 Turkey Veterinary Imaging Market Estimates And Forecasts, By End-use (2020-2032) (USD Billion)
12.3.1.12 Rest Of Eastern Europe
12.3.1.12.1 Rest Of Eastern Europe Veterinary Imaging Market Estimates And Forecasts, By Product (2020-2032) (USD Billion)
12.3.1.12.2 Rest Of Eastern Europe Veterinary Imaging Market Estimates And Forecasts, By Solutions (2020-2032) (USD Billion)
12.3.1.12.3 Rest Of Eastern Europe Veterinary Imaging Market Estimates And Forecasts, By Animal Type (2020-2032) (USD Billion)
12.3.1.12.4 Rest Of Eastern Europe Veterinary Imaging Market Estimates And Forecasts, By Application (2020-2032) (USD Billion)
12.3.1.12.5 Rest Of Eastern Europe Veterinary Imaging Market Estimates And Forecasts, By End-use (2020-2032) (USD Billion)
12.3.2 Western Europe
12.3.2.1 Trends Analysis
12.3.2.2 Western Europe Veterinary Imaging Market Estimates And Forecasts, By Country (2020-2032) (USD Billion)
12.3.2.3 Western Europe Veterinary Imaging Market Estimates And Forecasts, By Product (2020-2032) (USD Billion)
12.3.2.4 Western Europe Veterinary Imaging Market Estimates And Forecasts, By Solutions (2020-2032) (USD Billion)
12.3.2.5 Western Europe Veterinary Imaging Market Estimates And Forecasts, By Animal Type (2020-2032) (USD Billion)
12.3.2.6 Western Europe Veterinary Imaging Market Estimates And Forecasts, By Application (2020-2032) (USD Billion)
12.3.2.7 Western Europe Veterinary Imaging Market Estimates And Forecasts, By End-use (2020-2032) (USD Billion)
12.3.2.8 Germany
12.3.2.8.1 Germany Veterinary Imaging Market Estimates And Forecasts, By Product (2020-2032) (USD Billion)
12.3.2.8.2 Germany Veterinary Imaging Market Estimates And Forecasts, By Solutions (2020-2032) (USD Billion)
12.3.2.8.3 Germany Veterinary Imaging Market Estimates And Forecasts, By Animal Type (2020-2032) (USD Billion)
12.3.2.8.4 Germany Veterinary Imaging Market Estimates And Forecasts, By Application (2020-2032) (USD Billion)
12.3.2.8.5 Germany Veterinary Imaging Market Estimates And Forecasts, By End-use (2020-2032) (USD Billion)
12.3.2.9 France
12.3.2.9.1 France Veterinary Imaging Market Estimates And Forecasts, By Product (2020-2032) (USD Billion)
12.3.2.9.2 France Veterinary Imaging Market Estimates And Forecasts, By Solutions (2020-2032) (USD Billion)
12.3.2.9.3 France Veterinary Imaging Market Estimates And Forecasts, By Animal Type (2020-2032) (USD Billion)
12.3.2.9.4 France Veterinary Imaging Market Estimates And Forecasts, By Application (2020-2032) (USD Billion)
12.3.2.9.5 France Veterinary Imaging Market Estimates And Forecasts, By End-use (2020-2032) (USD Billion)
12.3.2.10 UK
12.3.2.10.1 UK Veterinary Imaging Market Estimates And Forecasts, By Product (2020-2032) (USD Billion)
12.3.2.10.2 UK Veterinary Imaging Market Estimates And Forecasts, By Solutions (2020-2032) (USD Billion)
12.3.2.10.3 UK Veterinary Imaging Market Estimates And Forecasts, By Animal Type (2020-2032) (USD Billion)
12.3.2.10.4 UK Veterinary Imaging Market Estimates And Forecasts, By Application (2020-2032) (USD Billion)
12.3.2.10.5 UK Veterinary Imaging Market Estimates And Forecasts, By End-use (2020-2032) (USD Billion)
12.3.2.11 Italy
12.3.2.11.1 Italy Veterinary Imaging Market Estimates And Forecasts, By Product (2020-2032) (USD Billion)
12.3.2.11.2 Italy Veterinary Imaging Market Estimates And Forecasts, By Solutions (2020-2032) (USD Billion)
12.3.2.11.3 Italy Veterinary Imaging Market Estimates And Forecasts, By Animal Type (2020-2032) (USD Billion)
12.3.2.11.4 Italy Veterinary Imaging Market Estimates And Forecasts, By Application (2020-2032) (USD Billion)
12.3.2.11.5 Italy Veterinary Imaging Market Estimates And Forecasts, By End-use (2020-2032) (USD Billion)
12.3.2.12 Spain
12.3.2.12.1 Spain Veterinary Imaging Market Estimates And Forecasts, By Product (2020-2032) (USD Billion)
12.3.2.12.2 Spain Veterinary Imaging Market Estimates And Forecasts, By Solutions (2020-2032) (USD Billion)
12.3.2.12.3 Spain Veterinary Imaging Market Estimates And Forecasts, By Animal Type (2020-2032) (USD Billion)
12.3.2.12.4 Spain Veterinary Imaging Market Estimates And Forecasts, By Application (2020-2032) (USD Billion)
12.3.2.12.5 Spain Veterinary Imaging Market Estimates And Forecasts, By End-use (2020-2032) (USD Billion)
12.3.2.13 Netherlands
12.3.2.13.1 Netherlands Veterinary Imaging Market Estimates And Forecasts, By Product (2020-2032) (USD Billion)
12.3.2.13.2 Netherlands Veterinary Imaging Market Estimates And Forecasts, By Solutions (2020-2032) (USD Billion)
12.3.2.13.3 Netherlands Veterinary Imaging Market Estimates And Forecasts, By Animal Type (2020-2032) (USD Billion)
12.3.2.13.4 Netherlands Veterinary Imaging Market Estimates And Forecasts, By Application (2020-2032) (USD Billion)
12.3.2.13.5 Netherlands Veterinary Imaging Market Estimates And Forecasts, By End-use (2020-2032) (USD Billion)
12.3.2.14 Switzerland
12.3.2.14.1 Switzerland Veterinary Imaging Market Estimates And Forecasts, By Product (2020-2032) (USD Billion)
12.3.2.14.2 Switzerland Veterinary Imaging Market Estimates And Forecasts, By Solutions (2020-2032) (USD Billion)
12.3.2.14.3 Switzerland Veterinary Imaging Market Estimates And Forecasts, By Animal Type (2020-2032) (USD Billion)
12.3.2.14.4 Switzerland Veterinary Imaging Market Estimates And Forecasts, By Application (2020-2032) (USD Billion)
12.3.2.12.5 Switzerland Veterinary Imaging Market Estimates And Forecasts, By End-use (2020-2032) (USD Billion)
12.3.2.15 Austria
12.3.2.15.1 Austria Veterinary Imaging Market Estimates And Forecasts, By Product (2020-2032) (USD Billion)
12.3.2.15.2 Austria Veterinary Imaging Market Estimates And Forecasts, By Solutions (2020-2032) (USD Billion)
12.3.2.15.3 Austria Veterinary Imaging Market Estimates And Forecasts, By Animal Type (2020-2032) (USD Billion)
12.3.2.15.4 Austria Veterinary Imaging Market Estimates And Forecasts, By Application (2020-2032) (USD Billion)
12.3.2.15.5 Austria Veterinary Imaging Market Estimates And Forecasts, By End-use (2020-2032) (USD Billion)
12.3.2.16 Rest Of Western Europe
12.3.2.16.1 Rest Of Western Europe Veterinary Imaging Market Estimates And Forecasts, By Product (2020-2032) (USD Billion)
12.3.2.16.2 Rest Of Western Europe Veterinary Imaging Market Estimates And Forecasts, By Solutions (2020-2032) (USD Billion)
12.3.2.16.3 Rest Of Western Europe Veterinary Imaging Market Estimates And Forecasts, By Animal Type (2020-2032) (USD Billion)
12.3.2.16.4 Rest Of Western Europe Veterinary Imaging Market Estimates And Forecasts, By Application (2020-2032) (USD Billion)
12.3.2.16.5 Rest Of Western Europe Veterinary Imaging Market Estimates And Forecasts, By End-use (2020-2032) (USD Billion)
12.4 Asia Pacific
12.4.1 Trends Analysis
12.4.2 Asia Pacific Veterinary Imaging Market Estimates And Forecasts, By Country (2020-2032) (USD Billion)
12.4.3 Asia Pacific Veterinary Imaging Market Estimates And Forecasts, By Product (2020-2032) (USD Billion)
12.4.4 Asia Pacific Veterinary Imaging Market Estimates And Forecasts, By Solutions (2020-2032) (USD Billion)
12.4.5 Asia Pacific Veterinary Imaging Market Estimates And Forecasts, By Animal Type (2020-2032) (USD Billion)
12.4.6 Asia Pacific Veterinary Imaging Market Estimates And Forecasts, By Application (2020-2032) (USD Billion)
12.4.7 Asia Pacific Veterinary Imaging Market Estimates And Forecasts, By End-use (2020-2032) (USD Billion)
12.4.8 China
12.4.8.1 China Veterinary Imaging Market Estimates And Forecasts, By Product (2020-2032) (USD Billion)
12.4.8.2 China Veterinary Imaging Market Estimates And Forecasts, By Solutions (2020-2032) (USD Billion)
12.4.8.3 China Veterinary Imaging Market Estimates And Forecasts, By Animal Type (2020-2032) (USD Billion)
12.4.8.4 China Veterinary Imaging Market Estimates And Forecasts, By Application (2020-2032) (USD Billion)
12.4.8.5 China Veterinary Imaging Market Estimates And Forecasts, By End-use (2020-2032) (USD Billion)
12.4.9 India
12.4.9.1 India Veterinary Imaging Market Estimates And Forecasts, By Product (2020-2032) (USD Billion)
12.4.9.2 India Veterinary Imaging Market Estimates And Forecasts, By Solutions (2020-2032) (USD Billion)
12.4.9.3 India Veterinary Imaging Market Estimates And Forecasts, By Animal Type (2020-2032) (USD Billion)
12.4.9.4 India Veterinary Imaging Market Estimates And Forecasts, By Application (2020-2032) (USD Billion)
12.4.9.5 India Veterinary Imaging Market Estimates And Forecasts, By End-use (2020-2032) (USD Billion)
12.4.10 Japan
12.4.10.1 Japan Veterinary Imaging Market Estimates And Forecasts, By Product (2020-2032) (USD Billion)
12.4.10.2 Japan Veterinary Imaging Market Estimates And Forecasts, By Solutions (2020-2032) (USD Billion)
12.4.10.3 Japan Veterinary Imaging Market Estimates And Forecasts, By Animal Type (2020-2032) (USD Billion)
12.4.10.4 Japan Veterinary Imaging Market Estimates And Forecasts, By Application (2020-2032) (USD Billion)
12.4.10.5 Japan Veterinary Imaging Market Estimates And Forecasts, By End-use (2020-2032) (USD Billion)
12.4.11 South Korea
12.4.11.1 South Korea Veterinary Imaging Market Estimates And Forecasts, By Product (2020-2032) (USD Billion)
12.4.11.2 South Korea Veterinary Imaging Market Estimates And Forecasts, By Solutions (2020-2032) (USD Billion)
12.4.11.3 South Korea Veterinary Imaging Market Estimates And Forecasts, By Animal Type (2020-2032) (USD Billion)
12.4.11.4 South Korea Veterinary Imaging Market Estimates And Forecasts, By Application (2020-2032) (USD Billion)
12.4.11.5 South Korea Veterinary Imaging Market Estimates And Forecasts, By End-use (2020-2032) (USD Billion)
12.4.12 Vietnam
12.4.12.1 Vietnam Veterinary Imaging Market Estimates And Forecasts, By Product (2020-2032) (USD Billion)
12.4.12.2 Vietnam Veterinary Imaging Market Estimates And Forecasts, By Solutions (2020-2032) (USD Billion)
12.4.12.3 Vietnam Veterinary Imaging Market Estimates And Forecasts, By Animal Type (2020-2032) (USD Billion)
12.4.12.4 Vietnam Veterinary Imaging Market Estimates And Forecasts, By Application (2020-2032) (USD Billion)
12.4.12.5 Vietnam Veterinary Imaging Market Estimates And Forecasts, By End-use (2020-2032) (USD Billion)
12.4.13 Singapore
12.4.13.1 Singapore Veterinary Imaging Market Estimates And Forecasts, By Product (2020-2032) (USD Billion)
12.4.13.2 Singapore Veterinary Imaging Market Estimates And Forecasts, By Solutions (2020-2032) (USD Billion)
12.4.13.3 Singapore Veterinary Imaging Market Estimates And Forecasts, By Animal Type (2020-2032) (USD Billion)
12.4.13.4 Singapore Veterinary Imaging Market Estimates And Forecasts, By Application (2020-2032) (USD Billion)
12.4.13.5 Singapore Veterinary Imaging Market Estimates And Forecasts, By End-use (2020-2032) (USD Billion)
12.4.14 Australia
12.4.14.1 Australia Veterinary Imaging Market Estimates And Forecasts, By Product (2020-2032) (USD Billion)
12.4.14.2 Australia Veterinary Imaging Market Estimates And Forecasts, By Solutions (2020-2032) (USD Billion)
12.4.14.3 Australia Veterinary Imaging Market Estimates And Forecasts, By Animal Type (2020-2032) (USD Billion)
12.4.14.4 Australia Veterinary Imaging Market Estimates And Forecasts, By Application (2020-2032) (USD Billion)
12.4.14.5 Australia Veterinary Imaging Market Estimates And Forecasts, By End-use (2020-2032) (USD Billion)
12.4.15 Rest Of Asia Pacific
12.4.15.1 Rest Of Asia Pacific Veterinary Imaging Market Estimates And Forecasts, By Product (2020-2032) (USD Billion)
12.4.15.2 Rest Of Asia Pacific Veterinary Imaging Market Estimates And Forecasts, By Solutions (2020-2032) (USD Billion)
12.4.15.3 Rest Of Asia Pacific Veterinary Imaging Market Estimates And Forecasts, By Animal Type (2020-2032) (USD Billion)
12.4.15.4 Rest Of Asia Pacific Veterinary Imaging Market Estimates And Forecasts, By Application (2020-2032) (USD Billion)
12.4.15.5 Rest Of Asia Pacific Veterinary Imaging Market Estimates And Forecasts, By End-use (2020-2032) (USD Billion)
12.5 Middle East And Africa
12.5.1 Middle East
12.5.1.1 Trends Analysis
12.5.1.2 Middle East Veterinary Imaging Market Estimates And Forecasts, By Country (2020-2032) (USD Billion)
12.5.1.3 Middle East Veterinary Imaging Market Estimates And Forecasts, By Product (2020-2032) (USD Billion)
12.5.1.4 Middle East Veterinary Imaging Market Estimates And Forecasts, By Solutions (2020-2032) (USD Billion)
12.5.1.5 Middle East Veterinary Imaging Market Estimates And Forecasts, By Animal Type (2020-2032) (USD Billion)
12.5.1.6 Middle East Veterinary Imaging Market Estimates And Forecasts, By Application (2020-2032) (USD Billion)
12.5.1.7 Middle East Veterinary Imaging Market Estimates And Forecasts, By End-use (2020-2032) (USD Billion)
12.5.1.8 UAE
12.5.1.8.1 UAE Veterinary Imaging Market Estimates And Forecasts, By Product (2020-2032) (USD Billion)
12.5.1.8.2 UAE Veterinary Imaging Market Estimates And Forecasts, By Solutions (2020-2032) (USD Billion)
12.5.1.8.3 UAE Veterinary Imaging Market Estimates And Forecasts, By Animal Type (2020-2032) (USD Billion)
12.5.1.8.4 UAE Veterinary Imaging Market Estimates And Forecasts, By Application (2020-2032) (USD Billion)
12.5.1.8.5 UAE Veterinary Imaging Market Estimates And Forecasts, By End-use (2020-2032) (USD Billion)
12.5.1.9 Egypt
12.5.1.9.1 Egypt Veterinary Imaging Market Estimates And Forecasts, By Product (2020-2032) (USD Billion)
12.5.1.9.2 Egypt Veterinary Imaging Market Estimates And Forecasts, By Solutions (2020-2032) (USD Billion)
12.5.1.9.3 Egypt Veterinary Imaging Market Estimates And Forecasts, By Animal Type (2020-2032) (USD Billion)
12.5.1.9.4 Egypt Veterinary Imaging Market Estimates And Forecasts, By Application (2020-2032) (USD Billion)
12.5.1.9.5 Egypt Veterinary Imaging Market Estimates And Forecasts, By End-use (2020-2032) (USD Billion)
12.5.1.10 Saudi Arabia
12.5.1.10.1 Saudi Arabia Veterinary Imaging Market Estimates And Forecasts, By Product (2020-2032) (USD Billion)
12.5.1.10.2 Saudi Arabia Veterinary Imaging Market Estimates And Forecasts, By Solutions (2020-2032) (USD Billion)
12.5.1.10.3 Saudi Arabia Veterinary Imaging Market Estimates And Forecasts, By Animal Type (2020-2032) (USD Billion)
12.5.1.10.4 Saudi Arabia Veterinary Imaging Market Estimates And Forecasts, By Application (2020-2032) (USD Billion)
12.5.1.10.5 Saudi Arabia Veterinary Imaging Market Estimates And Forecasts, By End-use (2020-2032) (USD Billion)
12.5.1.11 Qatar
12.5.1.11.1 Qatar Veterinary Imaging Market Estimates And Forecasts, By Product (2020-2032) (USD Billion)
12.5.1.11.2 Qatar Veterinary Imaging Market Estimates And Forecasts, By Solutions (2020-2032) (USD Billion)
12.5.1.11.3 Qatar Veterinary Imaging Market Estimates And Forecasts, By Animal Type (2020-2032) (USD Billion)
12.5.1.11.4 Qatar Veterinary Imaging Market Estimates And Forecasts, By Application (2020-2032) (USD Billion)
12.5.1.11.5 Qatar Veterinary Imaging Market Estimates And Forecasts, By End-use (2020-2032) (USD Billion)
12.5.1.12 Rest Of Middle East
12.5.1.12.1 Rest Of Middle East Veterinary Imaging Market Estimates And Forecasts, By Product (2020-2032) (USD Billion)
12.5.1.12.2 Rest Of Middle East Veterinary Imaging Market Estimates And Forecasts, By Solutions (2020-2032) (USD Billion)
12.5.1.12.3 Rest Of Middle East Veterinary Imaging Market Estimates And Forecasts, By Animal Type (2020-2032) (USD Billion)
12.5.1.12.4 Rest Of Middle East Veterinary Imaging Market Estimates And Forecasts, By Application (2020-2032) (USD Billion)
12.5.1.12.5 Rest Of Middle East Veterinary Imaging Market Estimates And Forecasts, By End-use (2020-2032) (USD Billion)
12.5.2 Africa
12.5.2.1 Trends Analysis
12.5.2.2 Africa Veterinary Imaging Market Estimates And Forecasts, By Country (2020-2032) (USD Billion)
12.5.2.3 Africa Veterinary Imaging Market Estimates And Forecasts, By Product (2020-2032) (USD Billion)
12.5.2.4 Africa Veterinary Imaging Market Estimates And Forecasts, By Solutions (2020-2032) (USD Billion)
12.5.2.5 Africa Veterinary Imaging Market Estimates And Forecasts, By Animal Type (2020-2032) (USD Billion)
12.5.2.6 Africa Veterinary Imaging Market Estimates And Forecasts, By Application (2020-2032) (USD Billion)
12.5.2.7 Africa Veterinary Imaging Market Estimates And Forecasts, By End-use (2020-2032) (USD Billion)
12.5.2.8 South Africa
12.5.2.8.1 South Africa Veterinary Imaging Market Estimates And Forecasts, By Product (2020-2032) (USD Billion)
12.5.2.8.2 South Africa Veterinary Imaging Market Estimates And Forecasts, By Solutions (2020-2032) (USD Billion)
12.5.2.8.3 South Africa Veterinary Imaging Market Estimates And Forecasts, By Animal Type (2020-2032) (USD Billion)
12.5.2.8.4 South Africa Veterinary Imaging Market Estimates And Forecasts, By Application (2020-2032) (USD Billion)
12.5.2.8.5 South Africa Veterinary Imaging Market Estimates And Forecasts, By End-use (2020-2032) (USD Billion)
12.5.2.9 Nigeria
12.5.2.9.1 Nigeria Veterinary Imaging Market Estimates And Forecasts, By Product (2020-2032) (USD Billion)
12.5.2.9.2 Nigeria Veterinary Imaging Market Estimates And Forecasts, By Solutions (2020-2032) (USD Billion)
12.5.2.9.3 Nigeria Veterinary Imaging Market Estimates And Forecasts, By Animal Type (2020-2032) (USD Billion)
12.5.2.9.4 Nigeria Veterinary Imaging Market Estimates And Forecasts, By Application (2020-2032) (USD Billion)
12.5.2.9.5 Nigeria Veterinary Imaging Market Estimates And Forecasts, By End-use (2020-2032) (USD Billion)
12.5.2.10 Rest Of Africa
12.5.2.10.1 Rest Of Africa Veterinary Imaging Market Estimates And Forecasts, By Product (2020-2032) (USD Billion)
12.5.2.10.2 Rest Of Africa Veterinary Imaging Market Estimates And Forecasts, By Solutions (2020-2032) (USD Billion)
12.5.2.10.3 Rest Of Africa Veterinary Imaging Market Estimates And Forecasts, By Animal Type (2020-2032) (USD Billion)
12.5.2.10.4 Rest Of Africa Veterinary Imaging Market Estimates And Forecasts, By Application (2020-2032) (USD Billion)
12.5.2.10.5 Rest Of Africa Veterinary Imaging Market Estimates And Forecasts, By End-use (2020-2032) (USD Billion)
12.6 Latin America
12.6.1 Trends Analysis
12.6.2 Latin America Veterinary Imaging Market Estimates And Forecasts, By Country (2020-2032) (USD Billion)
12.6.3 Latin America Veterinary Imaging Market Estimates And Forecasts, By Product (2020-2032) (USD Billion)
12.6.4 Latin America Veterinary Imaging Market Estimates And Forecasts, By Solutions (2020-2032) (USD Billion)
12.6.5 Latin America Veterinary Imaging Market Estimates And Forecasts, By Animal Type (2020-2032) (USD Billion)
12.6.6 Latin America Veterinary Imaging Market Estimates And Forecasts, By Application (2020-2032) (USD Billion)
12.6.7 Latin America Veterinary Imaging Market Estimates And Forecasts, By End-use (2020-2032) (USD Billion)
12.6.8 Brazil
12.6.8.1 Brazil Veterinary Imaging Market Estimates And Forecasts, By Product (2020-2032) (USD Billion)
12.6.8.2 Brazil Veterinary Imaging Market Estimates And Forecasts, By Solutions (2020-2032) (USD Billion)
12.6.8.3 Brazil Veterinary Imaging Market Estimates And Forecasts, By Animal Type (2020-2032) (USD Billion)
12.6.8.4 Brazil Veterinary Imaging Market Estimates And Forecasts, By Application (2020-2032) (USD Billion)
12.6.8.5 Brazil Veterinary Imaging Market Estimates And Forecasts, By End-use (2020-2032) (USD Billion)
12.6.9 Argentina
12.6.9.1 Argentina Veterinary Imaging Market Estimates And Forecasts, By Product (2020-2032) (USD Billion)
12.6.9.2 Argentina Veterinary Imaging Market Estimates And Forecasts, By Solutions (2020-2032) (USD Billion)
12.6.9.3 Argentina Veterinary Imaging Market Estimates And Forecasts, By Animal Type (2020-2032) (USD Billion)
12.6.9.4 Argentina Veterinary Imaging Market Estimates And Forecasts, By Application (2020-2032) (USD Billion)
12.6.9.5 Argentina Veterinary Imaging Market Estimates And Forecasts, By End-use (2020-2032) (USD Billion)
12.6.10 Colombia
12.6.10.1 Colombia Veterinary Imaging Market Estimates And Forecasts, By Product (2020-2032) (USD Billion)
12.6.10.2 Colombia Veterinary Imaging Market Estimates And Forecasts, By Solutions (2020-2032) (USD Billion)
12.6.10.3 Colombia Veterinary Imaging Market Estimates And Forecasts, By Animal Type (2020-2032) (USD Billion)
12.6.10.4 Colombia Veterinary Imaging Market Estimates And Forecasts, By Application (2020-2032) (USD Billion)
12.6.10.5 Colombia Veterinary Imaging Market Estimates And Forecasts, By End-use (2020-2032) (USD Billion)
12.6.11 Rest Of Latin America
12.6.11.1 Rest Of Latin America Veterinary Imaging Market Estimates And Forecasts, By Product (2020-2032) (USD Billion)
12.6.11.2 Rest Of Latin America Veterinary Imaging Market Estimates And Forecasts, By Solutions (2020-2032) (USD Billion)
12.6.11.3 Rest Of Latin America Veterinary Imaging Market Estimates And Forecasts, By Animal Type (2020-2032) (USD Billion)
12.6.11.4 Rest Of Latin America Veterinary Imaging Market Estimates And Forecasts, By Application (2020-2032) (USD Billion)
12.6.11.5 Rest Of Latin America Veterinary Imaging Market Estimates And Forecasts, By End-use (2020-2032) (USD Billion)
13. Company Profiles
13.1 IDEXX Laboratories, Inc.
13.1.1 Company Overview
13.1.2 Financial
13.1.3 Products/ Services Offered
13.1.4 SWOT Analysis
13.2 ESAOTE S.p.A.
13.2.1 Company Overview
13.2.2 Financial
13.2.3 Products/ Services Offered
13.2.4 SWOT Analysis
13.3 Mars, Inc.
13.3.1 Company Overview
13.3.2 Financial
13.3.3 Products/ Services Offered
13.3.4 SWOT Analysis
13.4 GE HealthCare
13.4.1 Company Overview
13.4.2 Financial
13.4.3 Products/ Services Offered
13.4.4 SWOT Analysis
13.5 Midmark Corporation
13.5.1 Company Overview
13.5.2 Financial
13.5.3 Products/ Services Offered
13.5.4 SWOT Analysis
13.6 FUJIFILM Holdings America Corporation
13.6.1 Company Overview
13.6.2 Financial
13.6.3 Products/ Services Offered
13.6.4 SWOT Analysis
13.7 Hallmarq Veterinary Imaging
13.7.1 Company Overview
13.7.2 Financial
13.7.3 Products/ Services Offered
13.7.4 SWOT Analysis
13.8 Canon Medical Systems Corporation
13.8.1 Company Overview
13.8.2 Financial
13.8.3 Products/ Services Offered
13.8.4 SWOT Analysis
13.9 Shenzhen Mindray Animal Medical Technology Co., Ltd.
13.9.1 Company Overview
13.9.2 Financial
13.9.3 Products/ Services Offered
13.9.4 SWOT Analysis
13.10 IMV Imaging
13.12.1 Company Overview
13.12.2 Financial
13.12.3 Products/ Services Offered
13.12.4 SWOT Analysis
14. Use Cases and Best Practices
15. Conclusion
An accurate research report requires proper strategizing as well as implementation. There are multiple factors involved in the completion of good and accurate research report and selecting the best methodology to compete the research is the toughest part. Since the research reports we provide play a crucial role in any company’s decision-making process, therefore we at SNS Insider always believe that we should choose the best method which gives us results closer to reality. This allows us to reach at a stage wherein we can provide our clients best and accurate investment to output ratio.
Each report that we prepare takes a timeframe of 350-400 business hours for production. Starting from the selection of titles through a couple of in-depth brain storming session to the final QC process before uploading our titles on our website we dedicate around 350 working hours. The titles are selected based on their current market cap and the foreseen CAGR and growth.
The 5 steps process:
Step 1: Secondary Research:
Secondary Research or Desk Research is as the name suggests is a research process wherein, we collect data through the readily available information. In this process we use various paid and unpaid databases which our team has access to and gather data through the same. This includes examining of listed companies’ annual reports, Journals, SEC filling etc. Apart from this our team has access to various associations across the globe across different industries. Lastly, we have exchange relationships with various university as well as individual libraries.
Step 2: Primary Research
When we talk about primary research, it is a type of study in which the researchers collect relevant data samples directly, rather than relying on previously collected data. This type of research is focused on gaining content specific facts that can be sued to solve specific problems. Since the collected data is fresh and first hand therefore it makes the study more accurate and genuine.
We at SNS Insider have divided Primary Research into 2 parts.
Part 1 wherein we interview the KOLs of major players as well as the upcoming ones across various geographic regions. This allows us to have their view over the market scenario and acts as an important tool to come closer to the accurate market numbers. As many as 45 paid and unpaid primary interviews are taken from both the demand and supply side of the industry to make sure we land at an accurate judgement and analysis of the market.
This step involves the triangulation of data wherein our team analyses the interview transcripts, online survey responses and observation of on filed participants. The below mentioned chart should give a better understanding of the part 1 of the primary interview.
Part 2: In this part of primary research the data collected via secondary research and the part 1 of the primary research is validated with the interviews from individual consultants and subject matter experts.
Consultants are those set of people who have at least 12 years of experience and expertise within the industry whereas Subject Matter Experts are those with at least 15 years of experience behind their back within the same space. The data with the help of two main processes i.e., FGDs (Focused Group Discussions) and IDs (Individual Discussions). This gives us a 3rd party nonbiased primary view of the market scenario making it a more dependable one while collation of the data pointers.
Step 3: Data Bank Validation
Once all the information is collected via primary and secondary sources, we run that information for data validation. At our intelligence centre our research heads track a lot of information related to the market which includes the quarterly reports, the daily stock prices, and other relevant information. Our data bank server gets updated every fortnight and that is how the information which we collected using our primary and secondary information is revalidated in real time.
Step 4: QA/QC Process
After all the data collection and validation our team does a final level of quality check and quality assurance to get rid of any unwanted or undesired mistakes. This might include but not limited to getting rid of the any typos, duplication of numbers or missing of any important information. The people involved in this process include technical content writers, research heads and graphics people. Once this process is completed the title gets uploader on our platform for our clients to read it.
Step 5: Final QC/QA Process:
This is the last process and comes when the client has ordered the study. In this process a final QA/QC is done before the study is emailed to the client. Since we believe in giving our clients a good experience of our research studies, therefore, to make sure that we do not lack at our end in any way humanly possible we do a final round of quality check and then dispatch the study to the client.
By Product
X-ray
Ultrasound
MRI
CT Imaging
Video Endoscopy
By Solutions
Equipment
Accessories/ Consumables
PACS
By Animal Type
Small Animals
Large Animals
By Application
Orthopedics and Traumatology
Oncology
Cardiology
Neurology
Respiratory
Dental Application
Other
By End-use
Veterinary Hospitals & Clinics
Other End-use
Request for Segment Customization as per your Business Requirement: Segment Customization Request
Regional Coverage:
North America
US
Canada
Mexico
Europe
Eastern Europe
Poland
Romania
Hungary
Turkey
Rest of Eastern Europe
Western Europe
Germany
France
UK
Italy
Spain
Netherlands
Switzerland
Austria
Rest of Western Europe
Asia Pacific
China
India
Japan
South Korea
Vietnam
Singapore
Australia
Rest of Asia Pacific
Middle East & Africa
Middle East
UAE
Egypt
Saudi Arabia
Qatar
Rest of Middle East
Africa
Nigeria
South Africa
Rest of Africa
Latin America
Brazil
Argentina
Colombia
Rest of Latin America
Request for Country Level Research Report: Country Level Customization Request
Available Customization
With the given market data, SNS Insider offers customization as per the company’s specific needs. The following customization options are available for the report:
Detailed Volume Analysis
Criss-Cross segment analysis (e.g. Product X Application)
Competitive Product Benchmarking
Geographic Analysis
Additional countries in any of the regions
Customized Data Representation
Detailed analysis and profiling of additional market players
The Biomarkers Market size was USD 67.92 billion in 2023, projected to hit USD 184.80 billion by 2032, growing at 11.78% CAGR.
The Synthesis Modules for Radiotracers Market Size was valued at USD 1.20 Billion in 2023 and is expected to reach USD 2.27 Billion by 2032 and grow at a CAGR of 7.66% over the forecast period 2024-2032.
The Advance Directives Market was valued at USD 122.74 billion in 2023 and is anticipated to reach USD 588.40 billion by 2032 with a CAGR of 19.04% over the forecast period 2024-2032.
In Vivo CRO Market was valued at USD 4.7 billion in 2023 and is expected to reach USD 9.2 billion by 2032, growing at a CAGR of 8% over the forecast period 2024-2032.
The Tuberculosis (TB) Diagnostics Market size was USD 2.39 billion in 2023, projected to grow to USD 3.80 billion by 2032, at a of CAGR 5.3% from 2024-2032.
The DNA Sequencing Market Size was valued at USD 11.5 Billion in 2023 and is expected to reach USD 52.1 Billion by 2032, growing at a CAGR of 17.8% Over the Forecast Period of 2024-2032.
Hi! Click one of our member below to chat on Phone