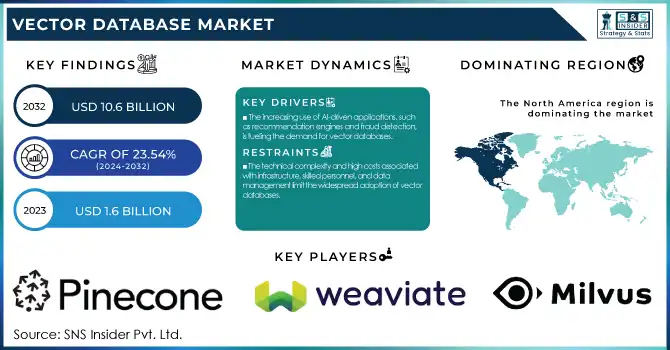
The Vector Database Market was valued at USD 1.6 Billion in 2023 and is expected to reach USD 10.6 Billion by 2032, growing at a CAGR of 23.54% from 2024-2032.
To Get more information on Vector Database Market - Request Free Sample Report
The Vector Database Market is experiencing rising adoption across industries, with sectors like finance, healthcare, and e-commerce leveraging vector search for AI-driven applications. Scalability & performance benchmarks in 2023 emphasize improvements in retrieval speed, real-time search, and indexing efficiency. Integration with AI/ML workloads varies by region, with North America and Asia-Pacific leading in AI-powered implementations. Cloud vs. on-premise deployment trends show a growing preference for hybrid solutions, balancing cost, security, and performance. Additionally, the report highlights advancements in vector search algorithms, increasing investments in open-source databases, and emerging regulatory considerations for AI-driven data storage.
Drivers
The increasing use of AI-driven applications, such as recommendation engines and fraud detection, is fueling the demand for vector databases.
The Increasing adoption of AI and machine learning in industries such as finance, healthcare, e-commerce, and cybersecurity, among others, is one of the key drivers driving the growth of the vector database market. These databases allow for quick and precise similarity search and are key to AI-powered applications such as recommendation engines, fraud detection, and natural language processing. Organizations are focusing on high-performance data storage and retrieval solutions to get real-time insights and predictive analytics. Rapid vector databases adoption driven by demand for vector search from AI applications with large language models. In addition to this, a rise in market growth is being driven by cloud-native deployments and open-source developments.
Restraints
The technical complexity and high costs associated with infrastructure, skilled personnel, and data management limit the widespread adoption of vector databases.
Vector databases offer many benefits, but come with high complexity and implementation overhead, which carries the risk of low adoption. Enterprises need to set aside funds for dedicated infrastructure, talent and data pipelines — ideally for smooth integration with existing AI and big data ecosystems. The need for significant compute resources to maintain and scale vector databases further increases the operational costs. Wider Systems Adoption in Absence of Budgets — Smaller enterprises run on limited budgets and therefore having or using such systems might be something they will find hard to implement. On top of that, the learning curve for vector database architecture and indexing methods is quite steep, which has hindered their adoption to only those companies with developed AI and extensive data processing capabilities.
Opportunities
The need for fast, AI-powered search and retrieval solutions in industries like healthcare, e-commerce, and cybersecurity is driving market growth.
The growing demand for search and retrieval of live data is opening new market opportunities for vector databases in all business sectors. Businesses are using vector search more than ever before for various use cases such as personalized recommendations, anomaly detection, and smart search engines. Such applications, ranging from customer service to drug discovery and autonomous systems, require a data management solution that efficiently handles vector data. Finally, the rise of hybrid cloud environments is enabling organizations to use vector databases in a broader range of settings. With open-source innovation and improved indexing techniques, modern vector databases are becoming more accessible and scalable for diverse use cases.
Challenges
Storing and processing vast amounts of sensitive data in vector databases raises concerns about privacy, security, and regulatory compliance.
Since vector databases manage and analyze enormous amounts of sensitive data, data privacy and security continue to pose major issues. AI-driven applications require large datasets, i.e., user behavior, facial detection, financial records, etc., which are almost always subjected to unauthorized access and data breach. Deploying and managing systems can be challenging with ever-changing data protection regulations like GDPR and CCPA. Adversarial attacks on vector search algorithms can also compromise data integrity, which can cause the AI output to produce biased or manipulated results. To tackle these security challenges, vector databases need solid techniques such as encryption, access control and regulatory compliance.
By Component
In 2023, The Solutions segment dominated the market and accounted for 68% of revenue share. These solutions include vector generation tools for crawling and creating data to be embedded, vector search for efficiently searching data, and storage & retrieval solutions to ensure that data is valid and retrievable. The demand for advanced spatial data analytics continues with industries like transportation, logistics, urban planning, and others driving demand ahead.
The services segment is expected to register the fastest CAGR during the forecast period. Vector database consulting and implementation services are critical for organizations to evaluate and implement relevant vector database solutions and integrate them into existing IT infrastructures. These services are important to teach users how to use the solution at its best. Training users and emphasizing their best usage. Continuous operational support services: These services are to help clients in dealing with small technical problems to enhance the overall performance of the solution.
By Technology
In 2023, natural language processing (NLP) segment held the largest revenue share and it is expected to continue its growth trend due to rising demand for efficient textual as well as semantic analysis. Unlike general-purpose databases, vector database solutions are designed to handle vectors for words, phrases, and documents, which are heavily used for tasks across NLP applications like sentiment analysis, language translation, content recommendation systems.
The computer vision segment is expected to register the fastest CAGR during the forecasted period, driven by increasing adoption of machine learning and deep learning models based on vector representations of images. These representations can be stored in most vector database solutions, which will allow these features to be efficiently retrieved and manipulated to support different tasks like image recognition, object detection, and video analysis.
By Vertical
The IT & ITeS segment dominated the market and held the largest revenue share in 2023, with the growing utilization of data-intensive applications in this end-use sector. Vector database solutions provide the capabilities to effectively store, query, and process the complex data structures these applications require, at scale. Some of the key applications are focused on providing enterprise IT infrastructure that includes scalable solutions for managing structured and unstructured data, applications development and testing, cloud computing and big data analytics.
The retail & e-commerce segment is expected to register the fastest CAGR during the forecast period. Vector database solutions play a crucial role in personalized customer experiences driven by data analytics, allowing retailers and e-commerce players to harness the power of text search, and image and video search to efficiently store, analyze, and deploy customer data into meaningful personalized recommendations and promotions.
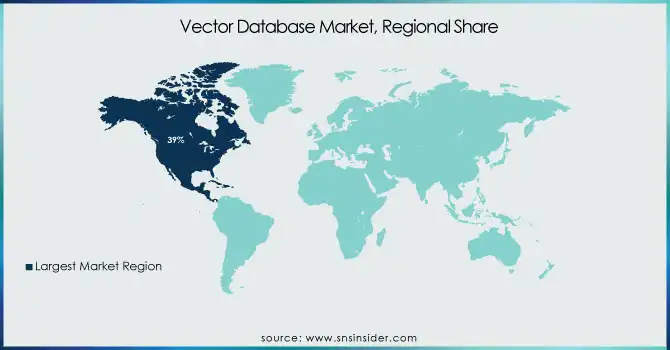
The North America dominated the market and accounted for 39 % revenue share in 2023 owing to the early adoption of advanced technologies across various industries including IT, healthcare, finance, and retail. The push for technology in the region feeds the demand for data management solutions like vector databases. The North America vector database market is propelled by the high concentration of major players in cloud computing, artificial intelligence, and big data analytics sectors, that volumes of investment and innovations related to technologies, which require efficient data storage, retrieval, and analysis capabilities provided by vector database solutions.
The Asia Pacific region is expected to register the fastest CAGR during the forecasted period. The explosion of e-commerce and digital payments in the region is built around using vector databases to store large amounts of transactional and customer information; power targeted marketing efforts; and improve supply chain efficiency.
Get Customized Report as per Your Business Requirement - Enquiry Now
The major key players along with their products are
Pinecone – Pinecone Vector Database
Weaviate – Weaviate Vector Search Engine
Milvus – Milvus Open-Source Vector Database
FAISS (Facebook AI) – FAISS Library
Chroma – Chroma AI-native Vector Database
Vespa – Vespa Vector Search Engine
Qdrant – Qdrant Vector Similarity Search
Redis – Redis Vector Search
Zilliz – Zilliz Cloud
Annoy (Spotify) – Annoy Approximate Nearest Neighbors Library
Vald (Yahoo Japan) – Vald Vector Search Engine
ElasticSearch – ElasticSearch k-NN Search
Google Vertex AI – Vertex AI Matching Engine
Alibaba Cloud – Alibaba Cloud AnalyticDB for AI
Microsoft Azure AI – Azure Cognitive Search with Vector Search
February 2024: Pinecone raised $100 million in a Series B funding round, elevating its valuation to $750 million.
March 2024: Weaviate secured $50 million in Series B funding to enhance its open-source vector search engine capabilities.
May 2024: Qdrant was recognized as one of Berlin's hottest startups, providing a vector search engine to enhance AI's ability to handle unstructured data efficiently.
|
Report Attributes |
Details |
|
Market Size in 2023 |
USD 1.6 Billion |
|
Market Size by 2032 |
USD 10.6 Billion |
|
CAGR |
CAGR of 23.54% From 2024 to 2032 |
|
Base Year |
2023 |
|
Forecast Period |
2024-2032 |
|
Historical Data |
2020-2022 |
|
Report Scope & Coverage |
Market Size, Segments Analysis, Competitive Landscape, Regional Analysis, DROC & SWOT Analysis, Forecast Outlook |
|
Key Segments |
• By Component (Solution, Services) |
|
Regional Analysis/Coverage |
North America (US, Canada, Mexico), Europe (Eastern Europe [Poland, Romania, Hungary, Turkey, Rest of Eastern Europe] Western Europe] Germany, France, UK, Italy, Spain, Netherlands, Switzerland, Austria, Rest of Western Europe]), Asia Pacific (China, India, Japan, South Korea, Vietnam, Singapore, Australia, Rest of Asia Pacific), Middle East & Africa (Middle East [UAE, Egypt, Saudi Arabia, Qatar, Rest of Middle East], Africa [Nigeria, South Africa, Rest of Africa], Latin America (Brazil, Argentina, Colombia, Rest of Latin America) |
|
Company Profiles |
Pinecone, Weaviate, Milvus, FAISS (Facebook AI), Chroma, Vespa, Qdrant, Redis, Zilliz, Annoy (Spotify), Vald (Yahoo Japan), ElasticSearch, Google Vertex AI, Alibaba Cloud, Microsoft Azure AI |
Ans - The Vector Database Market was valued at USD 1.6 Billion in 2023 and is expected to reach USD 10.6 Billion by 2032
Ans- The CAGR of the Vector Database Market during the forecast period is 23.54% from 2024-2032.
Ans- Asia-Pacific is expected to register the fastest CAGR during the forecast period.
Ans- The increasing use of AI-driven applications, such as recommendation engines and fraud detection, is fueling the demand for vector databases.
Ans- Storing and processing vast amounts of sensitive data in vector databases raises concerns about privacy, security, and regulatory compliance.
Table of Content
1. Introduction
1.1 Market Definition
1.2 Scope (Inclusion and Exclusions)
1.3 Research Assumptions
2. Executive Summary
2.1 Market Overview
2.2 Regional Synopsis
2.3 Competitive Summary
3. Research Methodology
3.1 Top-Down Approach
3.2 Bottom-up Approach
3.3. Data Validation
3.4 Primary Interviews
4. Market Dynamics Impact Analysis
4.1 Market Driving Factors Analysis
4.1.1 Drivers
4.1.2 Restraints
4.1.3 Opportunities
4.1.4 Challenges
4.2 PESTLE Analysis
4.3 Porter’s Five Forces Model
5. Statistical Insights and Trends Reporting
5.1 Adoption Rates of Vector Databases, by Industry
5.2 Scalability & Performance Benchmarks, 2023
5.3 Integration with AI/ML Workloads, by Region
5.4 Cloud vs. On-Premise Deployment Trends, 2023
6. Competitive Landscape
6.1 List of Major Companies, By Region
6.2 Market Share Analysis, By Region
6.3 Product Benchmarking
6.3.1 Product specifications and features
6.3.2 Pricing
6.4 Strategic Initiatives
6.4.1 Marketing and promotional activities
6.4.2 Distribution and supply chain strategies
6.4.3 Expansion plans and new product launches
6.4.4 Strategic partnerships and collaborations
6.5 Technological Advancements
6.6 Market Positioning and Branding
7. Vector Database Market Segmentation, By Component
7.1 Chapter Overview
7.2 Solution
7.2.1 Solution Market Trends Analysis (2020-2032)
7.2.2 Solution Market Size Estimates and Forecasts to 2032 (USD Billion)
7.2.3 Vector Generation
7.2.3.1 Vector Generation Market Trends Analysis (2020-2032)
7.2.3.2 Vector Generation Market Size Estimates and Forecasts to 2032 (USD Billion)
7.2.4 Vector Search
7.2.4.1 Vector Search Market Trends Analysis (2020-2032)
7.2.4.2 Vector Search Market Size Estimates and Forecasts to 2032 (USD Billion)
7.2.5 Storage & Retrieval Vectors
7.2.5.1 Storage & Retrieval Vectors Market Trends Analysis (2020-2032)
7.2.5.2 Storage & Retrieval Vectors Market Size Estimates and Forecasts to 2032 (USD Billion)
7.3 Services
7.3.1 Services Market Trends Analysis (2020-2032)
7.3.2 Services Market Size Estimates and Forecasts to 2032 (USD Billion)
8. Vector Database Market Segmentation, by Technology
8.1 Chapter Overview
8.2 Natural Language Processing
8.2.1 Natural Language Processing Market Trends Analysis (2020-2032)
8.2.2 Natural Language Processing Market Size Estimates and Forecasts to 2032 (USD Billion)
8.3 Computer Vision
8.3.1 Computer Vision Market Trends Analysis (2020-2032)
8.3.2 Computer Vision Market Size Estimates and Forecasts to 2032 (USD Billion)
8.4 Recommendation Systems
8.4.1 Recommendation Systems Market Trends Analysis (2020-2032)
8.4.2 Recommendation Systems Market Size Estimates and Forecasts to 2032 (USD Billion)
9. Vector Database Market Segmentation, by Vertical
9.1 Chapter Overview
9.2 BFSI
9.2.1 BFSI Market Trends Analysis (2020-2032)
9.2.2 BFSI Market Size Estimates and Forecasts to 2032 (USD Billion)
9.3 Retail & E-commerce
9.3.1 Retail & E-commerce Market Trends Analysis (2020-2032)
9.3.2 Retail & E-commerce Market Size Estimates and Forecasts to 2032 (USD Billion)
9.4 Healthcare & Life Sciences
9.4.1 Healthcare & Life Sciences Market Trends Analysis (2020-2032)
9.4.2 Healthcare & Life Sciences Market Size Estimates and Forecasts to 2032 (USD Billion)
9.5 IT & ITeS
9.5.1 IT & ITeS Market Trends Analysis (2020-2032)
9.5.2 IT & ITeS Market Size Estimates and Forecasts to 2032 (USD Billion)
9.6 Manufacturing
9.6.1 Manufacturing Market Trends Analysis (2020-2032)
9.6.2 Manufacturing Market Size Estimates and Forecasts to 2032 (USD Billion)
9.7 Media & Entertainment
9.7.1 Media & Entertainment Market Trends Analysis (2020-2032)
9.7.2 Media & Entertainment Market Size Estimates and Forecasts to 2032 (USD Billion)
9.8 Others
9.8.1 Others Market Trends Analysis (2020-2032)
9.8.2 Others Market Size Estimates and Forecasts to 2032 (USD Billion)
10. Regional Analysis
10.1 Chapter Overview
10.2 North America
10.2.1 Trends Analysis
10.2.2 North America Vector Database Market Estimates and Forecasts, by Country (2020-2032) (USD Billion)
10.2.3 North America Vector Database Market Estimates and Forecasts, By Component (2020-2032) (USD Billion)
10.2.4 North America Vector Database Market Estimates and Forecasts, by Technology (2020-2032) (USD Billion)
10.2.5 North America Vector Database Market Estimates and Forecasts, by Vertical (2020-2032) (USD Billion)
10.2.6 USA
10.2.6.1 USA Vector Database Market Estimates and Forecasts, By Component (2020-2032) (USD Billion)
10.2.6.2 USA Vector Database Market Estimates and Forecasts, by Technology (2020-2032) (USD Billion)
10.2.6.3 USA Vector Database Market Estimates and Forecasts, by Vertical (2020-2032) (USD Billion)
10.2.7 Canada
10.2.7.1 Canada Vector Database Market Estimates and Forecasts, By Component (2020-2032) (USD Billion)
10.2.7.2 Canada Vector Database Market Estimates and Forecasts, by Technology (2020-2032) (USD Billion)
10.2.7.3 Canada Vector Database Market Estimates and Forecasts, by Vertical (2020-2032) (USD Billion)
10.2.8 Mexico
10.2.8.1 Mexico Vector Database Market Estimates and Forecasts, By Component (2020-2032) (USD Billion)
10.2.8.2 Mexico Vector Database Market Estimates and Forecasts, by Technology (2020-2032) (USD Billion)
10.2.8.3 Mexico Vector Database Market Estimates and Forecasts, by Vertical (2020-2032) (USD Billion)
10.3 Europe
10.3.1 Eastern Europe
10.3.1.1 Trends Analysis
10.3.1.2 Eastern Europe Vector Database Market Estimates and Forecasts, by Country (2020-2032) (USD Billion)
10.3.1.3 Eastern Europe Vector Database Market Estimates and Forecasts, By Component (2020-2032) (USD Billion)
10.3.1.4 Eastern Europe Vector Database Market Estimates and Forecasts, by Technology (2020-2032) (USD Billion)
10.3.1.5 Eastern Europe Vector Database Market Estimates and Forecasts, by Vertical (2020-2032) (USD Billion)
10.3.1.6 Poland
10.3.1.6.1 Poland Vector Database Market Estimates and Forecasts, By Component (2020-2032) (USD Billion)
10.3.1.6.2 Poland Vector Database Market Estimates and Forecasts, by Technology (2020-2032) (USD Billion)
10.3.1.6.3 Poland Vector Database Market Estimates and Forecasts, by Vertical (2020-2032) (USD Billion)
10.3.1.7 Romania
10.3.1.7.1 Romania Vector Database Market Estimates and Forecasts, By Component (2020-2032) (USD Billion)
10.3.1.7.2 Romania Vector Database Market Estimates and Forecasts, by Technology (2020-2032) (USD Billion)
10.3.1.7.3 Romania Vector Database Market Estimates and Forecasts, by Vertical (2020-2032) (USD Billion)
10.3.1.8 Hungary
10.3.1.8.1 Hungary Vector Database Market Estimates and Forecasts, By Component (2020-2032) (USD Billion)
10.3.1.8.2 Hungary Vector Database Market Estimates and Forecasts, by Technology (2020-2032) (USD Billion)
10.3.1.8.3 Hungary Vector Database Market Estimates and Forecasts, by Vertical (2020-2032) (USD Billion)
10.3.1.9 Turkey
10.3.1.9.1 Turkey Vector Database Market Estimates and Forecasts, By Component (2020-2032) (USD Billion)
10.3.1.9.2 Turkey Vector Database Market Estimates and Forecasts, by Technology (2020-2032) (USD Billion)
10.3.1.9.3 Turkey Vector Database Market Estimates and Forecasts, by Vertical (2020-2032) (USD Billion)
10.3.1.10 Rest of Eastern Europe
10.3.1.10.1 Rest of Eastern Europe Vector Database Market Estimates and Forecasts, By Component (2020-2032) (USD Billion)
10.3.1.10.2 Rest of Eastern Europe Vector Database Market Estimates and Forecasts, by Technology (2020-2032) (USD Billion)
10.3.1.10.3 Rest of Eastern Europe Vector Database Market Estimates and Forecasts, by Vertical (2020-2032) (USD Billion)
10.3.2 Western Europe
10.3.2.1 Trends Analysis
10.3.2.2 Western Europe Vector Database Market Estimates and Forecasts, by Country (2020-2032) (USD Billion)
10.3.2.3 Western Europe Vector Database Market Estimates and Forecasts, By Component (2020-2032) (USD Billion)
10.3.2.4 Western Europe Vector Database Market Estimates and Forecasts, by Technology (2020-2032) (USD Billion)
10.3.2.5 Western Europe Vector Database Market Estimates and Forecasts, by Vertical (2020-2032) (USD Billion)
10.3.2.6 Germany
10.3.2.6.1 Germany Vector Database Market Estimates and Forecasts, By Component (2020-2032) (USD Billion)
10.3.2.6.2 Germany Vector Database Market Estimates and Forecasts, by Technology (2020-2032) (USD Billion)
10.3.2.6.3 Germany Vector Database Market Estimates and Forecasts, by Vertical (2020-2032) (USD Billion)
10.3.2.7 France
10.3.2.7.1 France Vector Database Market Estimates and Forecasts, By Component (2020-2032) (USD Billion)
10.3.2.7.2 France Vector Database Market Estimates and Forecasts, by Technology (2020-2032) (USD Billion)
10.3.2.7.3 France Vector Database Market Estimates and Forecasts, by Vertical (2020-2032) (USD Billion)
10.3.2.8 UK
10.3.2.8.1 UK Vector Database Market Estimates and Forecasts, By Component (2020-2032) (USD Billion)
10.3.2.8.2 UK Vector Database Market Estimates and Forecasts, by Technology (2020-2032) (USD Billion)
10.3.2.8.3 UK Vector Database Market Estimates and Forecasts, by Vertical (2020-2032) (USD Billion)
10.3.2.9 Italy
10.3.2.9.1 Italy Vector Database Market Estimates and Forecasts, By Component (2020-2032) (USD Billion)
10.3.2.9.2 Italy Vector Database Market Estimates and Forecasts, by Technology (2020-2032) (USD Billion)
10.3.2.9.3 Italy Vector Database Market Estimates and Forecasts, by Vertical (2020-2032) (USD Billion)
10.3.2.10 Spain
10.3.2.10.1 Spain Vector Database Market Estimates and Forecasts, By Component (2020-2032) (USD Billion)
10.3.2.10.2 Spain Vector Database Market Estimates and Forecasts, by Technology (2020-2032) (USD Billion)
10.3.2.10.3 Spain Vector Database Market Estimates and Forecasts, by Vertical (2020-2032) (USD Billion)
10.3.2.11 Netherlands
10.3.2.11.1 Netherlands Vector Database Market Estimates and Forecasts, By Component (2020-2032) (USD Billion)
10.3.2.11.2 Netherlands Vector Database Market Estimates and Forecasts, by Technology (2020-2032) (USD Billion)
10.3.2.11.3 Netherlands Vector Database Market Estimates and Forecasts, by Vertical (2020-2032) (USD Billion)
10.3.2.12 Switzerland
10.3.2.12.1 Switzerland Vector Database Market Estimates and Forecasts, By Component (2020-2032) (USD Billion)
10.3.2.12.2 Switzerland Vector Database Market Estimates and Forecasts, by Technology (2020-2032) (USD Billion)
10.3.2.12.3 Switzerland Vector Database Market Estimates and Forecasts, by Vertical (2020-2032) (USD Billion)
10.3.2.13 Austria
10.3.2.13.1 Austria Vector Database Market Estimates and Forecasts, By Component (2020-2032) (USD Billion)
10.3.2.13.2 Austria Vector Database Market Estimates and Forecasts, by Technology (2020-2032) (USD Billion)
10.3.2.13.3 Austria Vector Database Market Estimates and Forecasts, by Vertical (2020-2032) (USD Billion)
10.3.2.14 Rest of Western Europe
10.3.2.14.1 Rest of Western Europe Vector Database Market Estimates and Forecasts, By Component (2020-2032) (USD Billion)
10.3.2.14.2 Rest of Western Europe Vector Database Market Estimates and Forecasts, by Technology (2020-2032) (USD Billion)
10.3.2.14.3 Rest of Western Europe Vector Database Market Estimates and Forecasts, by Vertical (2020-2032) (USD Billion)
10.4 Asia Pacific
10.4.1 Trends Analysis
10.4.2 Asia Pacific Vector Database Market Estimates and Forecasts, by Country (2020-2032) (USD Billion)
10.4.3 Asia Pacific Vector Database Market Estimates and Forecasts, By Component (2020-2032) (USD Billion)
10.4.4 Asia Pacific Vector Database Market Estimates and Forecasts, by Technology (2020-2032) (USD Billion)
10.4.5 Asia Pacific Vector Database Market Estimates and Forecasts, by Vertical (2020-2032) (USD Billion)
10.4.6 China
10.4.6.1 China Vector Database Market Estimates and Forecasts, By Component (2020-2032) (USD Billion)
10.4.6.2 China Vector Database Market Estimates and Forecasts, by Display (2020-2032) (USD Billion)
10.4.6.3 China Vector Database Market Estimates and Forecasts, by Vertical (2020-2032) (USD Billion)
10.4.7 India
10.4.7.1 India Vector Database Market Estimates and Forecasts, By Component (2020-2032) (USD Billion)
10.4.7.2 India Vector Database Market Estimates and Forecasts, by Technology (2020-2032) (USD Billion)
10.4.7.3 India Vector Database Market Estimates and Forecasts, by Vertical (2020-2032) (USD Billion)
10.4.8 Japan
10.4.8.1 Japan Vector Database Market Estimates and Forecasts, By Component (2020-2032) (USD Billion)
10.4.8.2 Japan Vector Database Market Estimates and Forecasts, by Technology (2020-2032) (USD Billion)
10.4.8.3 Japan Vector Database Market Estimates and Forecasts, by End-Use (2020-2032) (USD Billion)
10.4.9 South Korea
10.4.9.1 South Korea Vector Database Market Estimates and Forecasts, By Component (2020-2032) (USD Billion)
10.4.9.2 South Korea Vector Database Market Estimates and Forecasts, by Technology (2020-2032) (USD Billion)
10.4.9.3 South Korea Vector Database Market Estimates and Forecasts, by Vertical (2020-2032) (USD Billion)
10.4.10 Vietnam
10.4.10.1 Vietnam Vector Database Market Estimates and Forecasts, By Component (2020-2032) (USD Billion)
10.4.10.2 Vietnam Vector Database Market Estimates and Forecasts, by Technology (2020-2032) (USD Billion)
10.4.10.3 Vietnam Vector Database Market Estimates and Forecasts, by Vertical (2020-2032) (USD Billion)
10.4.11 Singapore
10.4.11.1 Singapore Vector Database Market Estimates and Forecasts, By Component (2020-2032) (USD Billion)
10.4.11.2 Singapore Vector Database Market Estimates and Forecasts, by Technology (2020-2032) (USD Billion)
10.4.11.3 Singapore Vector Database Market Estimates and Forecasts, by Vertical (2020-2032) (USD Billion)
10.4.12 Australia
10.4.12.1 Australia Vector Database Market Estimates and Forecasts, By Component (2020-2032) (USD Billion)
10.4.12.2 Australia Vector Database Market Estimates and Forecasts, by Technology (2020-2032) (USD Billion)
10.4.12.3 Australia Vector Database Market Estimates and Forecasts, by Vertical (2020-2032) (USD Billion)
10.4.13 Rest of Asia Pacific
10.4.13.1 Rest of Asia Pacific Vector Database Market Estimates and Forecasts, By Component (2020-2032) (USD Billion)
10.4.13.2 Rest of Asia Pacific Vector Database Market Estimates and Forecasts, by Technology (2020-2032) (USD Billion)
10.4.13.3 Rest of Asia Pacific Vector Database Market Estimates and Forecasts, by Vertical (2020-2032) (USD Billion)
10.5 Middle East and Africa
10.5.1 Middle East
10.5.1.1 Trends Analysis
10.5.1.2 Middle East Vector Database Market Estimates and Forecasts, by Country (2020-2032) (USD Billion)
10.5.1.3 Middle East Vector Database Market Estimates and Forecasts, By Component (2020-2032) (USD Billion)
10.5.1.4 Middle East Vector Database Market Estimates and Forecasts, by Technology (2020-2032) (USD Billion)
10.5.1.5 Middle East Vector Database Market Estimates and Forecasts, by Vertical (2020-2032) (USD Billion)
10.5.1.6 UAE
10.5.1.6.1 UAE Vector Database Market Estimates and Forecasts, By Component (2020-2032) (USD Billion)
10.5.1.6.2 UAE Vector Database Market Estimates and Forecasts, by Technology (2020-2032) (USD Billion)
10.5.1.6.3 UAE Vector Database Market Estimates and Forecasts, by Vertical (2020-2032) (USD Billion)
10.5.1.7 Egypt
10.5.1.7.1 Egypt Vector Database Market Estimates and Forecasts, By Component (2020-2032) (USD Billion)
10.5.1.7.2 Egypt Vector Database Market Estimates and Forecasts, by Technology (2020-2032) (USD Billion)
10.5.1.7.3 Egypt Vector Database Market Estimates and Forecasts, by Vertical (2020-2032) (USD Billion)
10.5.1.8 Saudi Arabia
10.5.1.8.1 Saudi Arabia Vector Database Market Estimates and Forecasts, By Component (2020-2032) (USD Billion)
10.5.1.8.2 Saudi Arabia Vector Database Market Estimates and Forecasts, by Technology (2020-2032) (USD Billion)
10.5.1.8.3 Saudi Arabia Vector Database Market Estimates and Forecasts, by Vertical (2020-2032) (USD Billion)
10.5.1.9 Qatar
10.5.1.9.1 Qatar Vector Database Market Estimates and Forecasts, By Component (2020-2032) (USD Billion)
10.5.1.9.2 Qatar Vector Database Market Estimates and Forecasts, by Technology (2020-2032) (USD Billion)
10.5.1.9.3 Qatar Vector Database Market Estimates and Forecasts, by Vertical (2020-2032) (USD Billion)
10.5.1.10 Rest of Middle East
10.5.1.10.1 Rest of Middle East Vector Database Market Estimates and Forecasts, By Component (2020-2032) (USD Billion)
10.5.1.10.2 Rest of Middle East Vector Database Market Estimates and Forecasts, by Technology (2020-2032) (USD Billion)
10.5.1.10.3 Rest of Middle East Vector Database Market Estimates and Forecasts, by Vertical (2020-2032) (USD Billion)
10.5.2 Africa
10.5.2.1 Trends Analysis
10.5.2.2 Africa Vector Database Market Estimates and Forecasts, by Country (2020-2032) (USD Billion)
10.5.2.3 Africa Vector Database Market Estimates and Forecasts, By Component (2020-2032) (USD Billion)
10.5.2.4 Africa Vector Database Market Estimates and Forecasts, by Technology (2020-2032) (USD Billion)
10.5.2.5 Africa Vector Database Market Estimates and Forecasts, by Vertical (2020-2032) (USD Billion)
10.5.2.6 South Africa
10.5.2.6.1 South Africa Vector Database Market Estimates and Forecasts, By Component (2020-2032) (USD Billion)
10.5.2.6.2 South Africa Vector Database Market Estimates and Forecasts, by Technology (2020-2032) (USD Billion)
10.5.2.6.3 South Africa Vector Database Market Estimates and Forecasts, by Vertical (2020-2032) (USD Billion)
10.5.2.7 Nigeria
10.5.2.7.1 Nigeria Vector Database Market Estimates and Forecasts, By Component (2020-2032) (USD Billion)
10.5.2.7.2 Nigeria Vector Database Market Estimates and Forecasts, by Technology (2020-2032) (USD Billion)
10.5.2.7.3 Nigeria Vector Database Market Estimates and Forecasts, by Vertical (2020-2032) (USD Billion)
10.5.2.8 Rest of Africa
10.5.2.8.1 Rest of Africa Vector Database Market Estimates and Forecasts, By Component (2020-2032) (USD Billion)
10.5.2.8.2 Rest of Africa Vector Database Market Estimates and Forecasts, by Technology (2020-2032) (USD Billion)
10.5.2.8.3 Rest of Africa Vector Database Market Estimates and Forecasts, by Vertical (2020-2032) (USD Billion)
10.6 Latin America
10.6.1 Trends Analysis
10.6.2 Latin America Vector Database Market Estimates and Forecasts, by Country (2020-2032) (USD Billion)
10.6.3 Latin America Vector Database Market Estimates and Forecasts, By Component (2020-2032) (USD Billion)
10.6.4 Latin America Vector Database Market Estimates and Forecasts, by Technology (2020-2032) (USD Billion)
10.6.5 Latin America Vector Database Market Estimates and Forecasts, by Vertical (2020-2032) (USD Billion)
10.6.6 Brazil
10.6.6.1 Brazil Vector Database Market Estimates and Forecasts, By Component (2020-2032) (USD Billion)
10.6.6.2 Brazil Vector Database Market Estimates and Forecasts, by Technology (2020-2032) (USD Billion)
10.6.6.3 Brazil Vector Database Market Estimates and Forecasts, by Vertical (2020-2032) (USD Billion)
10.6.7 Argentina
10.6.7.1 Argentina Vector Database Market Estimates and Forecasts, By Component (2020-2032) (USD Billion)
10.6.7.2 Argentina Vector Database Market Estimates and Forecasts, by Technology (2020-2032) (USD Billion)
10.6.7.3 Argentina Vector Database Market Estimates and Forecasts, by Vertical (2020-2032) (USD Billion)
10.6.8 Colombia
10.6.8.1 Colombia Vector Database Market Estimates and Forecasts, By Component (2020-2032) (USD Billion)
10.6.8.2 Colombia Vector Database Market Estimates and Forecasts, by Technology (2020-2032) (USD Billion)
10.6.8.3 Colombia Vector Database Market Estimates and Forecasts, by Vertical (2020-2032) (USD Billion)
10.6.9 Rest of Latin America
10.6.9.1 Rest of Latin America Vector Database Market Estimates and Forecasts, By Component (2020-2032) (USD Billion)
10.6.9.2 Rest of Latin America Vector Database Market Estimates and Forecasts, by Enterprise Size (2020-2032) (USD Billion)
10.6.9.3 Rest of Latin America Vector Database Market Estimates and Forecasts, by Vertical (2020-2032) (USD Billion)
11. Company Profiles
11.1 Pinecone
11.1.1 Company Overview
11.1.2 Financial
11.1.3 Products/ Services Offered
11.1.4 SWOT Analysis
11.2 Weaviate
11.2.1 Company Overview
11.2.2 Financial
11.2.3 Products/ Services Offered
11.2.4 SWOT Analysis
11.3 Milvus
11.3.1 Company Overview
11.3.2 Financial
11.3.3 Products/ Services Offered
11.3.4 SWOT Analysis
11.4 FAISS (Facebook AI)
11.4.1 Company Overview
11.4.2 Financial
11.4.3 Products/ Services Offered
11.4.4 SWOT Analysis
11.5 Chroma
11.5.1 Company Overview
11.5.2 Financial
11.5.3 Products/ Services Offered
11.5.4 SWOT Analysis
11.6 Vespa
11.6.1 Company Overview
11.6.2 Financial
11.6.3 Products/ Services Offered
11.6.4 SWOT Analysis
11.7 Qdrant
11.7.1 Company Overview
11.7.2 Financial
11.7.3 Products/ Services Offered
11.7.4 SWOT Analysis
11.8 Redis
11.8.1 Company Overview
11.8.2 Financial
11.8.3 Products/ Services Offered
11.8.4 SWOT Analysis
11.9 Zilliz
11.9.1 Company Overview
11.9.2 Financial
11.9.3 Products/ Services Offered
11.9.4 SWOT Analysis
11.10 Google Vertex AI
11.10.1 Company Overview
11.10.2 Financial
11.10.3 Products/ Services Offered
11.10.4 SWOT Analysis
12. Use Cases and Best Practices
13. Conclusion
An accurate research report requires proper strategizing as well as implementation. There are multiple factors involved in the completion of good and accurate research report and selecting the best methodology to compete the research is the toughest part. Since the research reports we provide play a crucial role in any company’s decision-making process, therefore we at SNS Insider always believe that we should choose the best method which gives us results closer to reality. This allows us to reach at a stage wherein we can provide our clients best and accurate investment to output ratio.
Each report that we prepare takes a timeframe of 350-400 business hours for production. Starting from the selection of titles through a couple of in-depth brain storming session to the final QC process before uploading our titles on our website we dedicate around 350 working hours. The titles are selected based on their current market cap and the foreseen CAGR and growth.
The 5 steps process:
Step 1: Secondary Research:
Secondary Research or Desk Research is as the name suggests is a research process wherein, we collect data through the readily available information. In this process we use various paid and unpaid databases which our team has access to and gather data through the same. This includes examining of listed companies’ annual reports, Journals, SEC filling etc. Apart from this our team has access to various associations across the globe across different industries. Lastly, we have exchange relationships with various university as well as individual libraries.

Step 2: Primary Research
When we talk about primary research, it is a type of study in which the researchers collect relevant data samples directly, rather than relying on previously collected data. This type of research is focused on gaining content specific facts that can be sued to solve specific problems. Since the collected data is fresh and first hand therefore it makes the study more accurate and genuine.
We at SNS Insider have divided Primary Research into 2 parts.
Part 1 wherein we interview the KOLs of major players as well as the upcoming ones across various geographic regions. This allows us to have their view over the market scenario and acts as an important tool to come closer to the accurate market numbers. As many as 45 paid and unpaid primary interviews are taken from both the demand and supply side of the industry to make sure we land at an accurate judgement and analysis of the market.
This step involves the triangulation of data wherein our team analyses the interview transcripts, online survey responses and observation of on filed participants. The below mentioned chart should give a better understanding of the part 1 of the primary interview.

Part 2: In this part of primary research the data collected via secondary research and the part 1 of the primary research is validated with the interviews from individual consultants and subject matter experts.
Consultants are those set of people who have at least 12 years of experience and expertise within the industry whereas Subject Matter Experts are those with at least 15 years of experience behind their back within the same space. The data with the help of two main processes i.e., FGDs (Focused Group Discussions) and IDs (Individual Discussions). This gives us a 3rd party nonbiased primary view of the market scenario making it a more dependable one while collation of the data pointers.
Step 3: Data Bank Validation
Once all the information is collected via primary and secondary sources, we run that information for data validation. At our intelligence centre our research heads track a lot of information related to the market which includes the quarterly reports, the daily stock prices, and other relevant information. Our data bank server gets updated every fortnight and that is how the information which we collected using our primary and secondary information is revalidated in real time.

Step 4: QA/QC Process
After all the data collection and validation our team does a final level of quality check and quality assurance to get rid of any unwanted or undesired mistakes. This might include but not limited to getting rid of the any typos, duplication of numbers or missing of any important information. The people involved in this process include technical content writers, research heads and graphics people. Once this process is completed the title gets uploader on our platform for our clients to read it.
Step 5: Final QC/QA Process:
This is the last process and comes when the client has ordered the study. In this process a final QA/QC is done before the study is emailed to the client. Since we believe in giving our clients a good experience of our research studies, therefore, to make sure that we do not lack at our end in any way humanly possible we do a final round of quality check and then dispatch the study to the client.
Key Segmentation:
By Component
Solution
Vector Generation
Vector Search
Storage & Retrieval Vectors
Services
By Technology
Natural Language Processing
Computer Vision
Recommendation Systems
By Vertical
BFSI
Retail & E-commerce
Healthcare & Life Sciences
IT & ITeS
Media & Entertainment
Manufacturing
Others
Request for Segment Customization as per your Business Requirement: Segment Customization Request
Regional Coverage:
North America
US
Canada
Mexico
Europe
Eastern Europe
Poland
Romania
Hungary
Turkey
Rest of Eastern Europe
Western Europe
Germany
France
UK
Italy
Spain
Netherlands
Switzerland
Austria
Rest of Western Europe
Asia Pacific
China
India
Japan
South Korea
Vietnam
Singapore
Australia
Rest of Asia Pacific
Middle East & Africa
Middle East
UAE
Egypt
Saudi Arabia
Qatar
Rest of Middle East
Africa
Nigeria
South Africa
Rest of Africa
Latin America
Brazil
Argentina
Colombia
Rest of Latin America
Request for Country Level Research Report: Country Level Customization Request
Available Customization
With the given market data, SNS Insider offers customization as per the company’s specific needs. The following customization options are available for the report:
Detailed Volume Analysis
Criss-Cross segment analysis (e.g. Product X Application)
Competitive Product Benchmarking
Geographic Analysis
Additional countries in any of the regions
Customized Data Representation
Detailed analysis and profiling of additional market players
The Passenger Information System Market Size was USD 29.5 Billion in 2023 and will reach USD 90.8 Billion by 2032 and grow at a CAGR of 12.12% by 2024-2032.
Plant Asset Management Market was valued at USD 6.59 billion in 2023 and is expected to reach USD 21.21 billion by 2032, growing at a CAGR of 13.91% from 2024-2032.
The Parental Control Software Market Size was valued at USD 1.65 Billion in 2023 and is expected to reach USD 4.77 Billion by 2032 and grow at a CAGR of 12.56% over the forecast period 2024-2032.
The CAD and PLM Software Market was valued at USD 16.1 Billion in 2023 and is expected to reach USD 32.5 Billion by 2032, growing at a CAGR of 8.13% from 2024-2032.
The DataOps Platform Market was valued at USD 4.0 Billion in 2023 and is expected to reach USD 24.5 Billion by 2032, growing at a CAGR of 22.20% from 2024-2032.
The Enterprise Connectivity and Networking Market is expected to grow from USD 57.10 billion in 2023 to USD 90.98 billion by 2032, at a CAGR of 5.33%.

Hi! Click one of our member below to chat on Phone
© 2025 All Rights Reserved by SNS Insider Pvt Ltd


