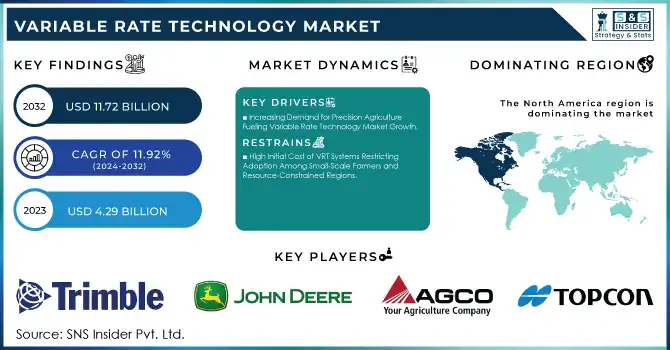
The Variable Rate Technology Market was valued at USD 4.29 billion in 2023 and is expected to reach USD 11.72 billion by 2032, growing at a CAGR of 11.92% from 2024-2032.
Get more information on Variable Rate Technology (VRT) Market - Request Free Sample Report
The Variable Rate Technology market has experienced notable growth due to advancements in precision agriculture, which enable farmers to optimize resource usage and increase crop yields. A farm-scale study found that using variable-input technology increased profits by USD 63 to USD 100 per acre compared to traditional uniform input application methods. As farming practices become more data-driven, VRT allows for precise adjustments to applying water, fertilizers, and pesticides based on real-time data, thus enhancing efficiency. This growing focus on sustainability and resource conservation further drives the demand for VRT, as it helps reduce waste and environmental impact. Consequently, VRT is becoming an essential tool for modern farmers aiming to improve both productivity and environmental stewardship.
The rising demand for VRT is fueled by the need to meet the challenges posed by a growing global population and the increasing pressure to produce more food with limited resources. As farmers look for ways to enhance productivity, VRT offers a solution by ensuring that inputs are applied more efficiently, reducing cost and waste. This growing shift towards optimized farming practices is supported by the availability of advanced technologies like GPS, sensors, and cloud-based platforms that facilitate real-time monitoring and decision-making. As these technologies become more accessible, particularly in emerging markets, VRT adoption is expected to expand rapidly, further accelerating market growth.
Looking ahead, the future of the VRT market presents significant opportunities driven by the integration of artificial intelligence and machine learning, which will improve data analytics and resource management. The application of AI and ML can enable more accurate predictions and further optimize farming practices, making VRT even more effective. The cost of the AI unit is between USD 30,000 and USD 35,000, but a key driving force for its adoption is the ability to offset increasing labor costs, providing long-term cost savings. Furthermore, collaboration between technology providers and agricultural firms is expected to foster innovation, leading to more integrated solutions tailored to the needs of farmers. With sustainability becoming increasingly central to global agriculture, VRT's role in maximizing resource efficiency will solidify its importance, ensuring continued growth and opportunities in the market.
MARKET DYNAMICS
DRIVERS
Advancements in IoT and AI Driving Variable Rate Technology Market Growth
The integration of Internet of Things sensors, artificial intelligence, and machine learning is significantly driving the growth of the Variable Rate Technology market. IoT sensors provide real-time data on soil conditions, moisture levels, and crop health, enabling farmers to make precise, data-driven decisions. AI and ML algorithms analyze this data to optimize input applications, ensuring efficient resource use. In December 2024, Google launched an AI initiative in India, offering an API that uses satellite imagery to enhance farming practices by providing insights into soil health and weather patterns, ultimately improving crop yields. Automation powered by these technologies reduces manual intervention and enhances efficiency. As IoT and AI technologies evolve, VRT systems become more effective, cost-efficient, and accessible, supporting smarter farming practices that reduce waste and environmental impact.
Increasing Demand for Precision Agriculture Fueling Variable Rate Technology Market Growth
The increasing demand for precision agriculture is driven by the need to improve farming efficiency and sustainability. VRT enables farmers to apply inputs like water, fertilizers, and pesticides more accurately, minimizing waste and reducing environmental impact. By tailoring applications to specific field conditions, VRT optimizes resource usage, resulting in higher crop yields while cutting costs. As the pressure to meet growing food demands rises, precision farming practices have become essential for maximizing productivity. The ability to make data-driven decisions based on real-time field insights further strengthens the appeal of VRT, making it an integral part of modern agriculture. This shift towards more efficient and sustainable farming practices is a key factor behind the market growth of VRT technology.
RESTRAINTS
High Initial Cost of VRT Systems Restricting Adoption Among Small-Scale Farmers and Resource-Constrained Regions
The high initial cost associated with Variable Rate Technology systems poses a significant barrier to their widespread adoption. These systems require specialized machinery, advanced sensors, and software, all of which come with substantial upfront expenses. For small-scale farmers or those with limited financial resources, these costs can be prohibitive, preventing them from accessing the benefits of VRT. While the long-term advantages of VRT, such as reduced input costs and optimized crop yields, may offset the initial investment, the financial burden remains a challenge for many in the agricultural sector. This cost barrier can slow the market growth, especially in regions where access to capital and financing options is limited, hindering the adoption of more efficient and sustainable farming technologies.
By Technology
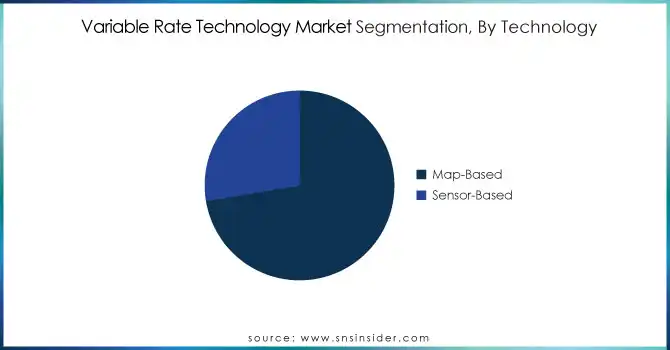
In 2023, the Map-Based segment dominated the Variable Rate Technology market, capturing the highest revenue share of about 72%. This dominance can be attributed to the widespread adoption of Geographic Information System mapping, which allows farmers to make data-driven decisions based on detailed, field-specific maps. The ability to accurately assess variations in soil health, moisture levels, and crop conditions enhances input application efficiency, driving demand for map-based VRT solutions.
The Sensor-Based segment is poised to grow at the fastest compound annual growth rate of about 13.74% from 2024 to 2032. This rapid growth is driven by advancements in sensor technologies, which enable real-time, on-site data collection and analysis. Sensors provide farmers with highly precise, actionable insights, improving resource management and operational efficiency. As the demand for more automated, real-time VRT solutions rises, sensor-based technologies are increasingly seen as critical to achieving sustainable and optimized agricultural practices.
By Component
In 2023, the Hardware segment dominated the Variable Rate Technology market, accounting for the highest revenue share of about 72%. This dominance stems from the critical role that hardware components, such as precision equipment, sensors, and controllers, play in the functionality of VRT systems. As farmers increasingly invest in advanced machinery for precise input application, hardware remains an essential and foundational element driving the adoption of VRT solutions.
The Services segment is expected to grow at the fastest compound annual growth rate of about 15.33% from 2024 to 2032. This growth is fueled by the rising demand for technical support, system integration, and data analytics services, which are crucial for optimizing the performance of VRT systems. As more farmers adopt these technologies, the need for comprehensive training, maintenance, and data-driven insights is intensifying, positioning the services segment as a key driver of market expansion.
By Crop Type
In 2023, the Cereals and Grains segment dominated the Variable Rate Technology market, capturing the highest revenue share of about 44%. This dominance is largely due to the extensive cultivation of crops such as wheat, corn, and rice, which require precise input management to optimize yields. The widespread adoption of VRT in these staple crops is driven by the need for efficient resource use, including water, fertilizers, and pesticides, which boosts productivity while minimizing costs.
The Fruits and Vegetables segment is projected to grow at the fastest compound annual growth rate of about 14.28% from 2024 to 2032. This rapid growth is attributed to the increasing demand for high-quality produce, where precise farming practices can significantly enhance yield and quality. As fruit and vegetable farming becomes more specialized and labor-intensive, VRT systems are increasingly seen as essential tools for optimizing input applications, reducing waste, and ensuring sustainable farming practices, driving market expansion in this sector.
By Farm Size
Large Farms segment dominated the Variable Rate Technology market with the highest revenue share of about 58% in 2023 and is expected to grow at the fastest compound annual growth rate of about 13.13% from 2024 to 2032. This dominance is largely due to the scale of operations on large farms, where the need for advanced technology to manage extensive fields and optimize resource use is critical. VRT solutions help these farms reduce input costs, improve efficiency, and boost crop yields, making them an essential tool for large-scale farming. As agricultural technology continues to evolve, large farms are increasingly adopting VRT to enhance productivity, minimize waste, and ensure sustainability, driving both current dominance and future growth in the market.
REGIONAL ANALYSIS
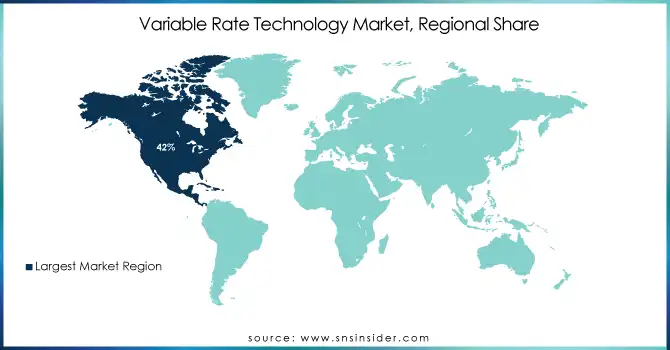
In 2023, North America dominated the Variable Rate Technology market, with the highest revenue share of about 42%. This dominance is driven by the region's advanced agricultural practices, high adoption of precision farming technologies, and large-scale farming operations. The U.S. and Canada, in particular, have a strong focus on optimizing resource use and improving crop yields, making VRT solutions a critical investment for enhancing productivity and sustainability. The availability of technological infrastructure and government support for agricultural innovations further strengthens North America's leadership in the VRT market.
The Asia Pacific region is expected to grow at the fastest compound annual growth rate of about 13.80% from 2024 to 2032. This rapid growth is fueled by the increasing demand for food production in the region, driven by a growing population and the need for higher agricultural productivity. As countries in Asia Pacific embrace modern farming technologies to address challenges like resource scarcity and climate change, the adoption of VRT solutions is accelerating. This shift towards precision agriculture is poised to transform the region's farming practices, positioning it as a key player in the global VRT market.
Need any customization research on Variable Rate Technology (VRT) Market - Enquiry Now
KEY PLAYERS
Trimble Inc. (Trimble Ag Software, TMX-2050 Display)
John Deere & Company (John Deere Operations Center)
AGCO Corporation (Fuse Technologies, AGCOMMAND)
Topcon Corporation (Topcon Agriculture Solutions, X30 Guidance System)
CNH Industrial NV (Case IH AFS Connect, New Holland PLM Intelligence)
Kubota Corporation (Kubota Precision Agriculture, Kubota Farm Solutions)
Yara International (YaraVita, YaraLiva)
Valmont Industries, Inc. (Valmont Irrigation, Valley Irrigation Control Systems)
Lindsay Corporation (FieldNET, Zimmatic)
Hexagon (Hexagon Agriculture Solutions, HxGN Smart Farming)
AgJunction (AgJunction Smart Ag, Ontrac3 Auto-Steering System)
Ageagle Aerial Systems (eBee X, eBee Ag)
Raven Industries, Inc. (Raven Viper 4, Raven Slingshot)
AG Leader Technology (Ag Leader Integra Display, FieldEdge)
BASF ( xarvio Digital Farming Solutions, xarvio Field Manager)
Monsanto (now part of Bayer) (Climate FieldView, FieldScripts)
Sakata Seed Corporation (Sakata Precision Agriculture, FieldSense)
TeeJet Technologies (Matrix 430, SpraySmart)
Mettler Toledo (AgroStar, Precision Ag Scales)
Kverneland Group (IsoMatch Tellus, IsoMatch AutoPilot)
FMC Corporation (FMC Smart Weed Control, FMC Prescription Spraying)
Rivulis (Rivulis AutoPilot, Rivulis Crop Monitoring Solutions)
Precision Planting (SeedSense, FieldView Drive)
Syngenta (AgriEdge Excelsior, Syngenta Digital Solutions)
At Cereals 2024, John Deere will showcase new innovations such as the S7 Series combines for improved grain quality, 5M Series tractors with updated transmissions, and advanced R740i and R962i sprayers featuring PowrSpray technology for efficient crop spraying.
In August 2024, CropX and CNH Industrial announced a digital integration that automates data transfer from CNH machinery to CropX's agronomic farm management system.
| Report Attributes | Details |
|---|---|
| Market Size in 2023 | USD 4.29 Billion |
| Market Size by 2032 | USD 11.72 Billion |
| CAGR | CAGR of 11.92% From 2024 to 2032 |
| Base Year | 2023 |
| Forecast Period | 2024-2032 |
| Historical Data | 2020-2022 |
| Report Scope & Coverage | Market Size, Segments Analysis, Competitive Landscape, Regional Analysis, DROC & SWOT Analysis, Forecast Outlook |
| Key Segments | • By Component (Hardware, Software, Services) • By Technology (Map-based, Sensor-based) • By Crop Type (Cereals and Grains, Fruits and Vegetables, Oilseeds and Pulses, Others) • By Farm Size (Large Farms, Mid-sized Farms, Small Farms) • By Application (Fertilizers, Crop Protection Chemicals, Soil Sensing, Yield Monitoring, Irrigation, Others) |
| Regional Analysis/Coverage | North America (US, Canada, Mexico), Europe (Eastern Europe [Poland, Romania, Hungary, Turkey, Rest of Eastern Europe] Western Europe] Germany, France, UK, Italy, Spain, Netherlands, Switzerland, Austria, Rest of Western Europe]), Asia Pacific (China, India, Japan, South Korea, Vietnam, Singapore, Australia, Rest of Asia Pacific), Middle East & Africa (Middle East [UAE, Egypt, Saudi Arabia, Qatar, Rest of Middle East], Africa [Nigeria, South Africa, Rest of Africa], Latin America (Brazil, Argentina, Colombia, Rest of Latin America) |
| Company Profiles | Trimble Inc., John Deere & Company, AGCO Corporation, Topcon Corporation, CNH Industrial NV, Kubota Corporation, Yara International, Valmont Industries, Inc., Lindsay Corporation, Hexagon, AgJunction, Ageagle Aerial Systems, Raven Industries, Inc., AG Leader Technology, BASF, Monsanto (now part of Bayer), Sakata Seed Corporation, TeeJet Technologies, Mettler Toledo, Kverneland Group, FMC Corporation, Rivulis, Precision Planting, Syngenta. |
| Key Drivers | • Advancements in IoT and AI Driving Variable Rate Technology Market Growth • Increasing Demand for Precision Agriculture Fueling Variable Rate Technology Market Growth |
| RESTRAINTS | • High Initial Cost of VRT Systems Restricting Adoption Among Small-Scale Farmers and Resource-Constrained Regions |
Ans: Variable Rate Technology Market was valued at USD 4.29 billion in 2023 and is expected to reach USD 11.72 billion by 2032, growing at a CAGR of 11.92% from 2024-2032.
Ans: The Sensor-Based segment is expected to grow at a CAGR of about 13.74% from 2024 to 2032.
Ans: The Hardware segment dominated the VRT market with a revenue share of about 72% in 2023.
Ans: The Cereals and Grains segment dominated the VRT market with a revenue share of about 44% in 2023.
Ans: North America dominated the VRT market with a revenue share of about 42% in 2023.
Table of Contents:
1. Introduction
1.1 Market Definition
1.2 Scope (Inclusion and Exclusions)
1.3 Research Assumptions
2. Executive Summary
2.1 Market Overview
2.2 Regional Synopsis
2.3 Competitive Summary
3. Research Methodology
3.1 Top-Down Approach
3.2 Bottom-up Approach
3.3. Data Validation
3.4 Primary Interviews
4. Market Dynamics Impact Analysis
4.1 Market Driving Factors Analysis
4.1.1 Drivers
4.1.2 Restraints
4.2 PESTLE Analysis
4.3 Porter’s Five Forces Model
5. Statistical Insights and Trends Reporting
5.1 Adoption Rates of Emerging Technologies
5.2 Technology Usage Trends
5.3 Demographics and Behavior
5.4 Software and Integration
6. Competitive Landscape
6.1 List of Major Companies, By Region
6.2 Market Share Analysis, By Region
6.3 Product Benchmarking
6.3.1 Product specifications and features
6.3.2 Pricing
6.4 Strategic Initiatives
6.4.1 Marketing and promotional activities
6.4.2 Distribution and supply chain strategies
6.4.3 Expansion plans and new product launches
6.4.4 Strategic partnerships and collaborations
6.5 Technological Advancements
6.6 Market Positioning and Branding
7. Variable Rate Technology Market Segmentation, By Component
7.1 Chapter Overview
7.2 Hardware
7.2.1 Hardware Market Trends Analysis (2020-2032)
7.2.2 Hardware Market Size Estimates and Forecasts to 2032 (USD Billion)
7.2.3 Guidance and Steering systems
7.2.3.1 Guidance and Steering systems Market Trends Analysis (2020-2032)
7.2.3.2 Guidance and Steering systems Market Size Estimates and Forecasts to 2032 (USD Billion)
7.2.4 Flow and Application Control Devices
7.2.4.1 Flow and Application Control Devices Market Trends Analysis (2020-2032)
7.2.4.2 Flow and Application Control Devices Market Size Estimates and Forecasts to 2032 (USD Billion)
7.2.5 GPS/ DGPS Receivers
7.2.5.1 GPS/ DGPS Receivers Market Trends Analysis (2020-2032)
7.2.5.2 GPS/ DGPS Receivers Market Size Estimates and Forecasts to 2032 (USD Billion)
7.2.6 Handheld Mobile Devices/Computers
7.2.6.1 Handheld Mobile Devices/Computers Market Trends Analysis (2020-2032)
7.2.6.2 Handheld Mobile Devices/Computers Market Size Estimates and Forecasts to 2032 (USD Billion)
7.2.7 Yield Monitors
7.2.7.1 Yield Monitors Market Trends Analysis (2020-2032)
7.2.7.2 Yield Monitors Market Size Estimates and Forecasts to 2032 (USD Billion)
7.2.8 Others
7.2.8.1 Others Market Trends Analysis (2020-2032)
7.2.8.2 Others Market Size Estimates and Forecasts to 2032 (USD Billion)
7.3 Software
7.3.1 Software Market Trends Analysis (2020-2032)
7.3.2 Software Market Size Estimates and Forecasts to 2032 (USD Billion)
7.4 Services
7.4.1 Services Market Trends Analysis (2020-2032)
7.4.2 Services Market Size Estimates and Forecasts to 2032 (USD Billion)
7.4.3 Farm Operation Service
7.4.3.1 Farm Operation Service Market Trends Analysis (2020-2032)
7.4.3.2 Farm Operation Service Market Size Estimates and Forecasts to 2032 (USD Billion)
7.4.4 Integration and Consultation Services
7.4.4.1 Integration and Consultation Services Market Trends Analysis (2020-2032)
7.4.4.2 Integration and Consultation Services Market Size Estimates and Forecasts to 2032 (USD Billion)
8. Variable Rate Technology Market Segmentation, By Application
8.1 Chapter Overview
8.2 Fertilizers
8.2.1 Fertilizers Market Trends Analysis (2020-2032)
8.2.2 Fertilizers Market Size Estimates And Forecasts To 2032 (USD Billion)
8.2.3 Urea VRT
8.2.3.1 Urea VRT Market Trends Analysis (2020-2032)
8.2.3.2 Urea VRT Market Size Estimates and Forecasts to 2032 (USD Billion)
8.2.4 UAN VRT
8.2.4.1 UAN VRT Market Trends Analysis (2020-2032)
8.2.4.2 UAN VRT Market Size Estimates and Forecasts to 2032 (USD Billion)
8.2.5 NH3 VRT
8.2.5.1 NH3 VRT Market Trends Analysis (2020-2032)
8.2.5.2 NH3 VRT Market Size Estimates and Forecasts to 2032 (USD Billion)
8.2.6 Other VRT
8.2.6.1 Other VRT Market Trends Analysis (2020-2032)
8.2.6.2 Other VRT Market Size Estimates and Forecasts to 2032 (USD Billion)
8.3 Crop Protection Chemicals
8.3.1 Crop Protection Chemicals Market Trends Analysis (2020-2032)
8.3.2 Crop Protection Chemicals Market Size Estimates And Forecasts To 2032 (USD Billion)
8.3.3 Herbicides
8.3.3.1 Herbicides Market Trends Analysis (2020-2032)
8.3.3.2 Herbicides Market Size Estimates and Forecasts to 2032 (USD Billion)
8.3.4 Fungicides & Bactericides
8.3.4.1 Fungicides & Bactericides Market Trends Analysis (2020-2032)
8.3.4.2 Fungicides & Bactericides Market Size Estimates and Forecasts to 2032 (USD Billion)
8.3.5 Insecticides
8.3.5.1 Insecticides Market Trends Analysis (2020-2032)
8.3.5.2 Insecticides Market Size Estimates and Forecasts to 2032 (USD Billion)
8.3.6 Nematicides and others
8.3.6.1 Nematicides and others Market Trends Analysis (2020-2032)
8.3.6.2 Nematicides and others Market Size Estimates and Forecasts to 2032 (USD Billion)
8.4 Yield Monitoring
8.4.1 Yield Monitoring Market Trends Analysis (2020-2032)
8.4.2 Yield Monitoring Market Size Estimates And Forecasts To 2032 (USD Billion)
8.5 Irrigation
8.5.1 Irrigation Market Trends Analysis (2020-2032)
8.5.2 Irrigation Market Size Estimates And Forecasts To 2032 (USD Billion)
8.6 Soil Sensing
8.6.1 Soil Sensing Market Trends Analysis (2020-2032)
8.6.2 Soil Sensing Market Size Estimates And Forecasts To 2032 (USD Billion)
8.7 Others
8.7.1 Others Market Trends Analysis (2020-2032)
8.7.2 Others Market Size Estimates And Forecasts To 2032 (USD Billion)
9. Variable Rate Technology Market Segmentation, By Crop Type
9.1 Chapter Overview
9.2 Cereals and Grains
9.2.1 Cereals and Grains Market Trends Analysis (2020-2032)
9.2.2 Cereals and Grains Market Size Estimates And Forecasts To 2032 (USD Billion)
9.2.3 Corn
9.2.3.1 Corn Market Trends Analysis (2020-2032)
9.2.3.2 Corn Market Size Estimates and Forecasts to 2032 (USD Billion)
9.2.4 Wheat
9.2.4.1 Wheat Market Trends Analysis (2020-2032)
9.2.4.2 Wheat Market Size Estimates and Forecasts to 2032 (USD Billion)
9.2.5 Others
9.2.5.1 Others Market Trends Analysis (2020-2032)
9.2.5.2 Others Market Size Estimates and Forecasts to 2032 (USD Billion)
9.3 Fruits and Vegetables
9.3.1 Fruits and Vegetables Market Trends Analysis (2020-2032)
9.3.2 Fruits and Vegetables Market Size Estimates And Forecasts To 2032 (USD Billion)
9.4 Oilseeds and Pulses
9.4.1 Oilseeds and Pulses Market Trends Analysis (2020-2032)
9.4.2 Oilseeds and Pulses Market Size Estimates And Forecasts To 2032 (USD Billion)
9.4.3 Soybeans
9.4.3.1 Soybeans Market Trends Analysis (2020-2032)
9.4.3.2 Soybeans Market Size Estimates and Forecasts to 2032 (USD Billion)
9.4.4 Cotton
9.4.4.1 Cotton Market Trends Analysis (2020-2032)
9.4.4.2 Cotton Market Size Estimates and Forecasts to 2032 (USD Billion)
9.4.5 Other
9.4.5.1 Other Market Trends Analysis (2020-2032)
9.4.5.2 Other Market Size Estimates and Forecasts to 2032 (USD Billion)
9.5 Others
9.5.1 Others Market Trends Analysis (2020-2032)
9.5.2 Others Market Size Estimates And Forecasts To 2032 (USD Billion)
10. Variable Rate Technology Market Segmentation, By Technology
10.1 Chapter Overview
10.2 Map-based
10.2.1 Map-based Market Trends Analysis (2020-2032)
10.2.2 Map-based Market Size Estimates And Forecasts To 2032 (USD Billion)
10.3 Sensor-based
10.3.1 Sensor-based Market Trends Analysis (2020-2032)
10.3.2 Sensor-based Market Size Estimates And Forecasts To 2032 (USD Billion)
10.3.3 Active Optical Sensor VRT
10.3.3.1 Active Optical Sensor VRT Market Trends Analysis (2020-2032)
10.3.3.2 Active Optical Sensor VRT Market Size Estimates and Forecasts to 2032 (USD Billion)
10.3.4 Drone-based VRT
10.3.4.1 Drone-based VRT Market Trends Analysis (2020-2032)
10.3.4.2 Drone-based VRT Market Size Estimates and Forecasts to 2032 (USD Billion)
10.3.5 Satellite-based VRT
10.3.5.1 Satellite-based VRT Market Trends Analysis (2020-2032)
10.3.5.2 Satellite-based VRT Market Size Estimates and Forecasts to 2032 (USD Billion)
11. Variable Rate Technology Market Segmentation, By Farm Size
11.1 Chapter Overview
11.2 Large farms
11.2.1 Large farms Market Trends Analysis (2020-2032)
11.2.2 Large farms Market Size Estimates And Forecasts To 2032 (USD Billion)
11.3 Mid-sized Farms
11.3.1 Mid-sized Farms Market Trends Analysis (2020-2032)
11.3.2 Mid-sized Farms Market Size Estimates And Forecasts To 2032 (USD Billion)
11.4 Small Farms
11.4.1 Small Farms Market Trends Analysis (2020-2032)
11.4.2 Small Farms Market Size Estimates And Forecasts To 2032 (USD Billion)
12. Regional Analysis
12.1 Chapter Overview
12.2 North America
12.2.1 Trends Analysis
12.2.2 North America Variable Rate Technology Market Estimates And Forecasts, By Country (2020-2032) (USD Billion)
12.2.3 North America Variable Rate Technology Market Estimates And Forecasts, By Component (2020-2032) (USD Billion)
12.2.4 North America Variable Rate Technology Market Estimates And Forecasts, By Application (2020-2032) (USD Billion)
12.2.5 North America Variable Rate Technology Market Estimates And Forecasts, By Crop Type (2020-2032) (USD Billion)
12.2.6 North America Variable Rate Technology Market Estimates And Forecasts, By Technology (2020-2032) (USD Billion)
12.2.7 North America Variable Rate Technology Market Estimates And Forecasts, By Farm Size (2020-2032) (USD Billion)
12.2.8 USA
12.2.8.1 USA Variable Rate Technology Market Estimates And Forecasts, By Component (2020-2032) (USD Billion)
12.2.8.2 USA Variable Rate Technology Market Estimates And Forecasts, By Application (2020-2032) (USD Billion)
12.2.8.3 USA Variable Rate Technology Market Estimates And Forecasts, By Crop Type (2020-2032) (USD Billion)
12.2.8.4 USA Variable Rate Technology Market Estimates And Forecasts, By Technology (2020-2032) (USD Billion)
12.2.8.5 USA Variable Rate Technology Market Estimates And Forecasts, By Farm Size (2020-2032) (USD Billion)
12.2.9 Canada
12.2.9.1 Canada Variable Rate Technology Market Estimates And Forecasts, By Component (2020-2032) (USD Billion)
12.2.9.2 Canada Variable Rate Technology Market Estimates And Forecasts, By Application (2020-2032) (USD Billion)
12.2.9.3 Canada Variable Rate Technology Market Estimates And Forecasts, By Crop Type (2020-2032) (USD Billion)
12.2.9.4 Canada Variable Rate Technology Market Estimates And Forecasts, By Technology (2020-2032) (USD Billion)
12.2.9.5 Canada Variable Rate Technology Market Estimates And Forecasts, By Farm Size (2020-2032) (USD Billion)
12.2.10 Mexico
12.2.10.1 Mexico Variable Rate Technology Market Estimates And Forecasts, By Component (2020-2032) (USD Billion)
12.2.10.2 Mexico Variable Rate Technology Market Estimates And Forecasts, By Application (2020-2032) (USD Billion)
12.2.10.3 Mexico Variable Rate Technology Market Estimates And Forecasts, By Crop Type (2020-2032) (USD Billion)
12.2.10.4 Mexico Variable Rate Technology Market Estimates And Forecasts, By Technology (2020-2032) (USD Billion)
12.2.10.5 Mexico Variable Rate Technology Market Estimates And Forecasts, By Farm Size (2020-2032) (USD Billion)
12.3 Europe
12.3.1 Eastern Europe
12.3.1.1 Trends Analysis
12.3.1.2 Eastern Europe Variable Rate Technology Market Estimates And Forecasts, By Country (2020-2032) (USD Billion)
12.3.1.3 Eastern Europe Variable Rate Technology Market Estimates And Forecasts, By Component (2020-2032) (USD Billion)
12.3.1.4 Eastern Europe Variable Rate Technology Market Estimates And Forecasts, By Application (2020-2032) (USD Billion)
12.3.1.5 Eastern Europe Variable Rate Technology Market Estimates And Forecasts, By Crop Type (2020-2032) (USD Billion)
12.3.1.6 Eastern Europe Variable Rate Technology Market Estimates And Forecasts, By Technology (2020-2032) (USD Billion)
12.3.1.7 Eastern Europe Variable Rate Technology Market Estimates And Forecasts, By Farm Size (2020-2032) (USD Billion)
12.3.1.8 Poland
12.3.1.8.1 Poland Variable Rate Technology Market Estimates And Forecasts, By Component (2020-2032) (USD Billion)
12.3.1.8.2 Poland Variable Rate Technology Market Estimates And Forecasts, By Application (2020-2032) (USD Billion)
12.3.1.8.3 Poland Variable Rate Technology Market Estimates And Forecasts, By Crop Type (2020-2032) (USD Billion)
12.3.1.8.4 Poland Variable Rate Technology Market Estimates And Forecasts, By Technology (2020-2032) (USD Billion)
12.3.1.8.5 Poland Variable Rate Technology Market Estimates And Forecasts, By Farm Size (2020-2032) (USD Billion)
12.3.1.9 Romania
12.3.1.9.1 Romania Variable Rate Technology Market Estimates And Forecasts, By Component (2020-2032) (USD Billion)
12.3.1.9.2 Romania Variable Rate Technology Market Estimates And Forecasts, By Application (2020-2032) (USD Billion)
12.3.1.9.3 Romania Variable Rate Technology Market Estimates And Forecasts, By Crop Type (2020-2032) (USD Billion)
12.3.1.9.4 Romania Variable Rate Technology Market Estimates And Forecasts, By Technology (2020-2032) (USD Billion)
12.3.1.9.5 Romania Variable Rate Technology Market Estimates And Forecasts, By Farm Size (2020-2032) (USD Billion)
12.3.1.10 Hungary
12.3.1.10.1 Hungary Variable Rate Technology Market Estimates And Forecasts, By Component (2020-2032) (USD Billion)
12.3.1.10.2 Hungary Variable Rate Technology Market Estimates And Forecasts, By Application (2020-2032) (USD Billion)
12.3.1.10.3 Hungary Variable Rate Technology Market Estimates And Forecasts, By Crop Type (2020-2032) (USD Billion)
12.3.1.10.4 Hungary Variable Rate Technology Market Estimates And Forecasts, By Technology (2020-2032) (USD Billion)
12.3.1.10.5 Hungary Variable Rate Technology Market Estimates And Forecasts, By Farm Size (2020-2032) (USD Billion)
12.3.1.11 Turkey
12.3.1.11.1 Turkey Variable Rate Technology Market Estimates And Forecasts, By Component (2020-2032) (USD Billion)
12.3.1.11.2 Turkey Variable Rate Technology Market Estimates And Forecasts, By Application (2020-2032) (USD Billion)
12.3.1.11.3 Turkey Variable Rate Technology Market Estimates And Forecasts, By Crop Type (2020-2032) (USD Billion)
12.3.1.11.4 Turkey Variable Rate Technology Market Estimates And Forecasts, By Technology (2020-2032) (USD Billion)
12.3.1.11.5 Turkey Variable Rate Technology Market Estimates And Forecasts, By Farm Size (2020-2032) (USD Billion)
12.3.1.12 Rest Of Eastern Europe
12.3.1.12.1 Rest Of Eastern Europe Variable Rate Technology Market Estimates And Forecasts, By Component (2020-2032) (USD Billion)
12.3.1.12.2 Rest Of Eastern Europe Variable Rate Technology Market Estimates And Forecasts, By Application (2020-2032) (USD Billion)
12.3.1.12.3 Rest Of Eastern Europe Variable Rate Technology Market Estimates And Forecasts, By Crop Type (2020-2032) (USD Billion)
12.3.1.12.4 Rest Of Eastern Europe Variable Rate Technology Market Estimates And Forecasts, By Technology (2020-2032) (USD Billion)
12.3.1.12.5 Rest Of Eastern Europe Variable Rate Technology Market Estimates And Forecasts, By Farm Size (2020-2032) (USD Billion)
12.3.2 Western Europe
12.3.2.1 Trends Analysis
12.3.2.2 Western Europe Variable Rate Technology Market Estimates And Forecasts, By Country (2020-2032) (USD Billion)
12.3.2.3 Western Europe Variable Rate Technology Market Estimates And Forecasts, By Component (2020-2032) (USD Billion)
12.3.2.4 Western Europe Variable Rate Technology Market Estimates And Forecasts, By Application (2020-2032) (USD Billion)
12.3.2.5 Western Europe Variable Rate Technology Market Estimates And Forecasts, By Crop Type (2020-2032) (USD Billion)
12.3.2.6 Western Europe Variable Rate Technology Market Estimates And Forecasts, By Technology (2020-2032) (USD Billion)
12.3.2.7 Western Europe Variable Rate Technology Market Estimates And Forecasts, By Farm Size (2020-2032) (USD Billion)
12.3.2.8 Germany
12.3.2.8.1 Germany Variable Rate Technology Market Estimates And Forecasts, By Component (2020-2032) (USD Billion)
12.3.2.8.2 Germany Variable Rate Technology Market Estimates And Forecasts, By Application (2020-2032) (USD Billion)
12.3.2.8.3 Germany Variable Rate Technology Market Estimates And Forecasts, By Crop Type (2020-2032) (USD Billion)
12.3.2.8.4 Germany Variable Rate Technology Market Estimates And Forecasts, By Technology (2020-2032) (USD Billion)
12.3.2.8.5 Germany Variable Rate Technology Market Estimates And Forecasts, By Farm Size (2020-2032) (USD Billion)
12.3.2.9 France
12.3.2.9.1 France Variable Rate Technology Market Estimates And Forecasts, By Component (2020-2032) (USD Billion)
12.3.2.9.2 France Variable Rate Technology Market Estimates And Forecasts, By Application (2020-2032) (USD Billion)
12.3.2.9.3 France Variable Rate Technology Market Estimates And Forecasts, By Crop Type (2020-2032) (USD Billion)
12.3.2.9.4 France Variable Rate Technology Market Estimates And Forecasts, By Technology (2020-2032) (USD Billion)
12.3.2.9.5 France Variable Rate Technology Market Estimates And Forecasts, By Farm Size (2020-2032) (USD Billion)
12.3.2.10 UK
12.3.2.10.1 UK Variable Rate Technology Market Estimates And Forecasts, By Component (2020-2032) (USD Billion)
12.3.2.10.2 UK Variable Rate Technology Market Estimates And Forecasts, By Application (2020-2032) (USD Billion)
12.3.2.10.3 UK Variable Rate Technology Market Estimates And Forecasts, By Crop Type (2020-2032) (USD Billion)
12.3.2.10.4 UK Variable Rate Technology Market Estimates And Forecasts, By Technology (2020-2032) (USD Billion)
12.3.2.10.5 UK Variable Rate Technology Market Estimates And Forecasts, By Farm Size (2020-2032) (USD Billion)
12.3.2.11 Italy
12.3.2.11.1 Italy Variable Rate Technology Market Estimates And Forecasts, By Component (2020-2032) (USD Billion)
12.3.2.11.2 Italy Variable Rate Technology Market Estimates And Forecasts, By Application (2020-2032) (USD Billion)
12.3.2.11.3 Italy Variable Rate Technology Market Estimates And Forecasts, By Crop Type (2020-2032) (USD Billion)
12.3.2.11.4 Italy Variable Rate Technology Market Estimates And Forecasts, By Technology (2020-2032) (USD Billion)
12.3.2.11.5 Italy Variable Rate Technology Market Estimates And Forecasts, By Farm Size (2020-2032) (USD Billion)
12.3.2.12 Spain
12.3.2.12.1 Spain Variable Rate Technology Market Estimates And Forecasts, By Component (2020-2032) (USD Billion)
12.3.2.12.2 Spain Variable Rate Technology Market Estimates And Forecasts, By Application (2020-2032) (USD Billion)
12.3.2.12.3 Spain Variable Rate Technology Market Estimates And Forecasts, By Crop Type (2020-2032) (USD Billion)
12.3.2.12.4 Spain Variable Rate Technology Market Estimates And Forecasts, By Technology (2020-2032) (USD Billion)
12.3.2.12.5 Spain Variable Rate Technology Market Estimates And Forecasts, By Farm Size (2020-2032) (USD Billion)
12.3.2.13 Netherlands
12.3.2.13.1 Netherlands Variable Rate Technology Market Estimates And Forecasts, By Component (2020-2032) (USD Billion)
12.3.2.13.2 Netherlands Variable Rate Technology Market Estimates And Forecasts, By Application (2020-2032) (USD Billion)
12.3.2.13.3 Netherlands Variable Rate Technology Market Estimates And Forecasts, By Crop Type (2020-2032) (USD Billion)
12.3.2.13.4 Netherlands Variable Rate Technology Market Estimates And Forecasts, By Technology (2020-2032) (USD Billion)
12.3.2.13.5 Netherlands Variable Rate Technology Market Estimates And Forecasts, By Farm Size (2020-2032) (USD Billion)
12.3.2.14 Switzerland
12.3.2.14.1 Switzerland Variable Rate Technology Market Estimates And Forecasts, By Component (2020-2032) (USD Billion)
12.3.2.14.2 Switzerland Variable Rate Technology Market Estimates And Forecasts, By Application (2020-2032) (USD Billion)
12.3.2.14.3 Switzerland Variable Rate Technology Market Estimates And Forecasts, By Crop Type (2020-2032) (USD Billion)
12.3.2.14.4 Switzerland Variable Rate Technology Market Estimates And Forecasts, By Technology (2020-2032) (USD Billion)
12.3.2.12.5 Switzerland Variable Rate Technology Market Estimates And Forecasts, By Farm Size (2020-2032) (USD Billion)
12.3.2.15 Austria
12.3.2.15.1 Austria Variable Rate Technology Market Estimates And Forecasts, By Component (2020-2032) (USD Billion)
12.3.2.15.2 Austria Variable Rate Technology Market Estimates And Forecasts, By Application (2020-2032) (USD Billion)
12.3.2.15.3 Austria Variable Rate Technology Market Estimates And Forecasts, By Crop Type (2020-2032) (USD Billion)
12.3.2.15.4 Austria Variable Rate Technology Market Estimates And Forecasts, By Technology (2020-2032) (USD Billion)
12.3.2.15.5 Austria Variable Rate Technology Market Estimates And Forecasts, By Farm Size (2020-2032) (USD Billion)
12.3.2.16 Rest Of Western Europe
12.3.2.16.1 Rest Of Western Europe Variable Rate Technology Market Estimates And Forecasts, By Component (2020-2032) (USD Billion)
12.3.2.16.2 Rest Of Western Europe Variable Rate Technology Market Estimates And Forecasts, By Application (2020-2032) (USD Billion)
12.3.2.16.3 Rest Of Western Europe Variable Rate Technology Market Estimates And Forecasts, By Crop Type (2020-2032) (USD Billion)
12.3.2.16.4 Rest Of Western Europe Variable Rate Technology Market Estimates And Forecasts, By Technology (2020-2032) (USD Billion)
12.3.2.16.5 Rest Of Western Europe Variable Rate Technology Market Estimates And Forecasts, By Farm Size (2020-2032) (USD Billion)
12.4 Asia Pacific
12.4.1 Trends Analysis
12.4.2 Asia Pacific Variable Rate Technology Market Estimates And Forecasts, By Country (2020-2032) (USD Billion)
12.4.3 Asia Pacific Variable Rate Technology Market Estimates And Forecasts, By Component (2020-2032) (USD Billion)
12.4.4 Asia Pacific Variable Rate Technology Market Estimates And Forecasts, By Application (2020-2032) (USD Billion)
12.4.5 Asia Pacific Variable Rate Technology Market Estimates And Forecasts, By Crop Type (2020-2032) (USD Billion)
12.4.6 Asia Pacific Variable Rate Technology Market Estimates And Forecasts, By Technology (2020-2032) (USD Billion)
12.4.7 Asia Pacific Variable Rate Technology Market Estimates And Forecasts, By Farm Size (2020-2032) (USD Billion)
12.4.8 China
12.4.8.1 China Variable Rate Technology Market Estimates And Forecasts, By Component (2020-2032) (USD Billion)
12.4.8.2 China Variable Rate Technology Market Estimates And Forecasts, By Application (2020-2032) (USD Billion)
12.4.8.3 China Variable Rate Technology Market Estimates And Forecasts, By Crop Type (2020-2032) (USD Billion)
12.4.8.4 China Variable Rate Technology Market Estimates And Forecasts, By Technology (2020-2032) (USD Billion)
12.4.8.5 China Variable Rate Technology Market Estimates And Forecasts, By Farm Size (2020-2032) (USD Billion)
12.4.9 India
12.4.9.1 India Variable Rate Technology Market Estimates And Forecasts, By Component (2020-2032) (USD Billion)
12.4.9.2 India Variable Rate Technology Market Estimates And Forecasts, By Application (2020-2032) (USD Billion)
12.4.9.3 India Variable Rate Technology Market Estimates And Forecasts, By Crop Type (2020-2032) (USD Billion)
12.4.9.4 India Variable Rate Technology Market Estimates And Forecasts, By Technology (2020-2032) (USD Billion)
12.4.9.5 India Variable Rate Technology Market Estimates And Forecasts, By Farm Size (2020-2032) (USD Billion)
12.4.10 Japan
12.4.10.1 Japan Variable Rate Technology Market Estimates And Forecasts, By Component (2020-2032) (USD Billion)
12.4.10.2 Japan Variable Rate Technology Market Estimates And Forecasts, By Application (2020-2032) (USD Billion)
12.4.10.3 Japan Variable Rate Technology Market Estimates And Forecasts, By Crop Type (2020-2032) (USD Billion)
12.4.10.4 Japan Variable Rate Technology Market Estimates And Forecasts, By Technology (2020-2032) (USD Billion)
12.4.10.5 Japan Variable Rate Technology Market Estimates And Forecasts, By Farm Size (2020-2032) (USD Billion)
12.4.11 South Korea
12.4.11.1 South Korea Variable Rate Technology Market Estimates And Forecasts, By Component (2020-2032) (USD Billion)
12.4.11.2 South Korea Variable Rate Technology Market Estimates And Forecasts, By Application (2020-2032) (USD Billion)
12.4.11.3 South Korea Variable Rate Technology Market Estimates And Forecasts, By Crop Type (2020-2032) (USD Billion)
12.4.11.4 South Korea Variable Rate Technology Market Estimates And Forecasts, By Technology (2020-2032) (USD Billion)
12.4.11.5 South Korea Variable Rate Technology Market Estimates And Forecasts, By Farm Size (2020-2032) (USD Billion)
12.4.12 Vietnam
12.4.12.1 Vietnam Variable Rate Technology Market Estimates And Forecasts, By Component (2020-2032) (USD Billion)
12.4.12.2 Vietnam Variable Rate Technology Market Estimates And Forecasts, By Application (2020-2032) (USD Billion)
12.4.12.3 Vietnam Variable Rate Technology Market Estimates And Forecasts, By Crop Type (2020-2032) (USD Billion)
12.4.12.4 Vietnam Variable Rate Technology Market Estimates And Forecasts, By Technology (2020-2032) (USD Billion)
12.4.12.5 Vietnam Variable Rate Technology Market Estimates And Forecasts, By Farm Size (2020-2032) (USD Billion)
12.4.13 Singapore
12.4.13.1 Singapore Variable Rate Technology Market Estimates And Forecasts, By Component (2020-2032) (USD Billion)
12.4.13.2 Singapore Variable Rate Technology Market Estimates And Forecasts, By Application (2020-2032) (USD Billion)
12.4.13.3 Singapore Variable Rate Technology Market Estimates And Forecasts, By Crop Type (2020-2032) (USD Billion)
12.4.13.4 Singapore Variable Rate Technology Market Estimates And Forecasts, By Technology (2020-2032) (USD Billion)
12.4.13.5 Singapore Variable Rate Technology Market Estimates And Forecasts, By Farm Size (2020-2032) (USD Billion)
12.4.14 Australia
12.4.14.1 Australia Variable Rate Technology Market Estimates And Forecasts, By Component (2020-2032) (USD Billion)
12.4.14.2 Australia Variable Rate Technology Market Estimates And Forecasts, By Application (2020-2032) (USD Billion)
12.4.14.3 Australia Variable Rate Technology Market Estimates And Forecasts, By Crop Type (2020-2032) (USD Billion)
12.4.14.4 Australia Variable Rate Technology Market Estimates And Forecasts, By Technology (2020-2032) (USD Billion)
12.4.14.5 Australia Variable Rate Technology Market Estimates And Forecasts, By Farm Size (2020-2032) (USD Billion)
12.4.15 Rest Of Asia Pacific
12.4.15.1 Rest Of Asia Pacific Variable Rate Technology Market Estimates And Forecasts, By Component (2020-2032) (USD Billion)
12.4.15.2 Rest Of Asia Pacific Variable Rate Technology Market Estimates And Forecasts, By Application (2020-2032) (USD Billion)
12.4.15.3 Rest Of Asia Pacific Variable Rate Technology Market Estimates And Forecasts, By Crop Type (2020-2032) (USD Billion)
12.4.15.4 Rest Of Asia Pacific Variable Rate Technology Market Estimates And Forecasts, By Technology (2020-2032) (USD Billion)
12.4.15.5 Rest Of Asia Pacific Variable Rate Technology Market Estimates And Forecasts, By Farm Size (2020-2032) (USD Billion)
12.5 Middle East And Africa
12.5.1 Middle East
12.5.1.1 Trends Analysis
12.5.1.2 Middle East Variable Rate Technology Market Estimates And Forecasts, By Country (2020-2032) (USD Billion)
12.5.1.3 Middle East Variable Rate Technology Market Estimates And Forecasts, By Component (2020-2032) (USD Billion)
12.5.1.4 Middle East Variable Rate Technology Market Estimates And Forecasts, By Application (2020-2032) (USD Billion)
12.5.1.5 Middle East Variable Rate Technology Market Estimates And Forecasts, By Crop Type (2020-2032) (USD Billion)
12.5.1.6 Middle East Variable Rate Technology Market Estimates And Forecasts, By Technology (2020-2032) (USD Billion)
12.5.1.7 Middle East Variable Rate Technology Market Estimates And Forecasts, By Farm Size (2020-2032) (USD Billion)
12.5.1.8 UAE
12.5.1.8.1 UAE Variable Rate Technology Market Estimates And Forecasts, By Component (2020-2032) (USD Billion)
12.5.1.8.2 UAE Variable Rate Technology Market Estimates And Forecasts, By Application (2020-2032) (USD Billion)
12.5.1.8.3 UAE Variable Rate Technology Market Estimates And Forecasts, By Crop Type (2020-2032) (USD Billion)
12.5.1.8.4 UAE Variable Rate Technology Market Estimates And Forecasts, By Technology (2020-2032) (USD Billion)
12.5.1.8.5 UAE Variable Rate Technology Market Estimates And Forecasts, By Farm Size (2020-2032) (USD Billion)
12.5.1.9 Egypt
12.5.1.9.1 Egypt Variable Rate Technology Market Estimates And Forecasts, By Component (2020-2032) (USD Billion)
12.5.1.9.2 Egypt Variable Rate Technology Market Estimates And Forecasts, By Application (2020-2032) (USD Billion)
12.5.1.9.3 Egypt Variable Rate Technology Market Estimates And Forecasts, By Crop Type (2020-2032) (USD Billion)
12.5.1.9.4 Egypt Variable Rate Technology Market Estimates And Forecasts, By Technology (2020-2032) (USD Billion)
12.5.1.9.5 Egypt Variable Rate Technology Market Estimates And Forecasts, By Farm Size (2020-2032) (USD Billion)
12.5.1.10 Saudi Arabia
12.5.1.10.1 Saudi Arabia Variable Rate Technology Market Estimates And Forecasts, By Component (2020-2032) (USD Billion)
12.5.1.10.2 Saudi Arabia Variable Rate Technology Market Estimates And Forecasts, By Application (2020-2032) (USD Billion)
12.5.1.10.3 Saudi Arabia Variable Rate Technology Market Estimates And Forecasts, By Crop Type (2020-2032) (USD Billion)
12.5.1.10.4 Saudi Arabia Variable Rate Technology Market Estimates And Forecasts, By Technology (2020-2032) (USD Billion)
12.5.1.10.5 Saudi Arabia Variable Rate Technology Market Estimates And Forecasts, By Farm Size (2020-2032) (USD Billion)
12.5.1.11 Qatar
12.5.1.11.1 Qatar Variable Rate Technology Market Estimates And Forecasts, By Component (2020-2032) (USD Billion)
12.5.1.11.2 Qatar Variable Rate Technology Market Estimates And Forecasts, By Application (2020-2032) (USD Billion)
12.5.1.11.3 Qatar Variable Rate Technology Market Estimates And Forecasts, By Crop Type (2020-2032) (USD Billion)
12.5.1.11.4 Qatar Variable Rate Technology Market Estimates And Forecasts, By Technology (2020-2032) (USD Billion)
12.5.1.11.5 Qatar Variable Rate Technology Market Estimates And Forecasts, By Farm Size (2020-2032) (USD Billion)
12.5.1.12 Rest Of Middle East
12.5.1.12.1 Rest Of Middle East Variable Rate Technology Market Estimates And Forecasts, By Component (2020-2032) (USD Billion)
12.5.1.12.2 Rest Of Middle East Variable Rate Technology Market Estimates And Forecasts, By Application (2020-2032) (USD Billion)
12.5.1.12.3 Rest Of Middle East Variable Rate Technology Market Estimates And Forecasts, By Crop Type (2020-2032) (USD Billion)
12.5.1.12.4 Rest Of Middle East Variable Rate Technology Market Estimates And Forecasts, By Technology (2020-2032) (USD Billion)
12.5.1.12.5 Rest Of Middle East Variable Rate Technology Market Estimates And Forecasts, By Farm Size (2020-2032) (USD Billion)
12.5.2 Africa
12.5.2.1 Trends Analysis
12.5.2.2 Africa Variable Rate Technology Market Estimates And Forecasts, By Country (2020-2032) (USD Billion)
12.5.2.3 Africa Variable Rate Technology Market Estimates And Forecasts, By Component (2020-2032) (USD Billion)
12.5.2.4 Africa Variable Rate Technology Market Estimates And Forecasts, By Application (2020-2032) (USD Billion)
12.5.2.5 Africa Variable Rate Technology Market Estimates And Forecasts, By Crop Type (2020-2032) (USD Billion)
12.5.2.6 Africa Variable Rate Technology Market Estimates And Forecasts, By Technology (2020-2032) (USD Billion)
12.5.2.7 Africa Variable Rate Technology Market Estimates And Forecasts, By Farm Size (2020-2032) (USD Billion)
12.5.2.8 South Africa
12.5.2.8.1 South Africa Variable Rate Technology Market Estimates And Forecasts, By Component (2020-2032) (USD Billion)
12.5.2.8.2 South Africa Variable Rate Technology Market Estimates And Forecasts, By Application (2020-2032) (USD Billion)
12.5.2.8.3 South Africa Variable Rate Technology Market Estimates And Forecasts, By Crop Type (2020-2032) (USD Billion)
12.5.2.8.4 South Africa Variable Rate Technology Market Estimates And Forecasts, By Technology (2020-2032) (USD Billion)
12.5.2.8.5 South Africa Variable Rate Technology Market Estimates And Forecasts, By Farm Size (2020-2032) (USD Billion)
12.5.2.9 Nigeria
12.5.2.9.1 Nigeria Variable Rate Technology Market Estimates And Forecasts, By Component (2020-2032) (USD Billion)
12.5.2.9.2 Nigeria Variable Rate Technology Market Estimates And Forecasts, By Application (2020-2032) (USD Billion)
12.5.2.9.3 Nigeria Variable Rate Technology Market Estimates And Forecasts, By Crop Type (2020-2032) (USD Billion)
12.5.2.9.4 Nigeria Variable Rate Technology Market Estimates And Forecasts, By Technology (2020-2032) (USD Billion)
12.5.2.9.5 Nigeria Variable Rate Technology Market Estimates And Forecasts, By Farm Size (2020-2032) (USD Billion)
12.5.2.10 Rest Of Africa
12.5.2.10.1 Rest Of Africa Variable Rate Technology Market Estimates And Forecasts, By Component (2020-2032) (USD Billion)
12.5.2.10.2 Rest Of Africa Variable Rate Technology Market Estimates And Forecasts, By Application (2020-2032) (USD Billion)
12.5.2.10.3 Rest Of Africa Variable Rate Technology Market Estimates And Forecasts, By Crop Type (2020-2032) (USD Billion)
12.5.2.10.4 Rest Of Africa Variable Rate Technology Market Estimates And Forecasts, By Technology (2020-2032) (USD Billion)
12.5.2.10.5 Rest Of Africa Variable Rate Technology Market Estimates And Forecasts, By Farm Size (2020-2032) (USD Billion)
12.6 Latin America
12.6.1 Trends Analysis
12.6.2 Latin America Variable Rate Technology Market Estimates And Forecasts, By Country (2020-2032) (USD Billion)
12.6.3 Latin America Variable Rate Technology Market Estimates And Forecasts, By Component (2020-2032) (USD Billion)
12.6.4 Latin America Variable Rate Technology Market Estimates And Forecasts, By Application (2020-2032) (USD Billion)
12.6.5 Latin America Variable Rate Technology Market Estimates And Forecasts, By Crop Type (2020-2032) (USD Billion)
12.6.6 Latin America Variable Rate Technology Market Estimates And Forecasts, By Technology (2020-2032) (USD Billion)
12.6.7 Latin America Variable Rate Technology Market Estimates And Forecasts, By Farm Size (2020-2032) (USD Billion)
12.6.8 Brazil
12.6.8.1 Brazil Variable Rate Technology Market Estimates And Forecasts, By Component (2020-2032) (USD Billion)
12.6.8.2 Brazil Variable Rate Technology Market Estimates And Forecasts, By Application (2020-2032) (USD Billion)
12.6.8.3 Brazil Variable Rate Technology Market Estimates And Forecasts, By Crop Type (2020-2032) (USD Billion)
12.6.8.4 Brazil Variable Rate Technology Market Estimates And Forecasts, By Technology (2020-2032) (USD Billion)
12.6.8.5 Brazil Variable Rate Technology Market Estimates And Forecasts, By Farm Size (2020-2032) (USD Billion)
12.6.9 Argentina
12.6.9.1 Argentina Variable Rate Technology Market Estimates And Forecasts, By Component (2020-2032) (USD Billion)
12.6.9.2 Argentina Variable Rate Technology Market Estimates And Forecasts, By Application (2020-2032) (USD Billion)
12.6.9.3 Argentina Variable Rate Technology Market Estimates And Forecasts, By Crop Type (2020-2032) (USD Billion)
12.6.9.4 Argentina Variable Rate Technology Market Estimates And Forecasts, By Technology (2020-2032) (USD Billion)
12.6.9.5 Argentina Variable Rate Technology Market Estimates And Forecasts, By Farm Size (2020-2032) (USD Billion)
12.6.10 Colombia
12.6.10.1 Colombia Variable Rate Technology Market Estimates And Forecasts, By Component (2020-2032) (USD Billion)
12.6.10.2 Colombia Variable Rate Technology Market Estimates And Forecasts, By Application (2020-2032) (USD Billion)
12.6.10.3 Colombia Variable Rate Technology Market Estimates And Forecasts, By Crop Type (2020-2032) (USD Billion)
12.6.10.4 Colombia Variable Rate Technology Market Estimates And Forecasts, By Technology (2020-2032) (USD Billion)
12.6.10.5 Colombia Variable Rate Technology Market Estimates And Forecasts, By Farm Size (2020-2032) (USD Billion)
12.6.11 Rest Of Latin America
12.6.11.1 Rest Of Latin America Variable Rate Technology Market Estimates And Forecasts, By Component (2020-2032) (USD Billion)
12.6.11.2 Rest Of Latin America Variable Rate Technology Market Estimates And Forecasts, By Application (2020-2032) (USD Billion)
12.6.11.3 Rest Of Latin America Variable Rate Technology Market Estimates And Forecasts, By Crop Type (2020-2032) (USD Billion)
12.6.11.4 Rest Of Latin America Variable Rate Technology Market Estimates And Forecasts, By Technology (2020-2032) (USD Billion)
12.6.11.5 Rest Of Latin America Variable Rate Technology Market Estimates And Forecasts, By Farm Size (2020-2032) (USD Billion)
13. Company Profiles
13.1 Trimble Inc.
13.1.1 Company Overview
13.1.2 Financial
13.1.3 Products/ Services Offered
13.1.4 SWOT Analysis
13.2 John Deere & Company
13.2.1 Company Overview
13.2.2 Financial
13.2.3 Products/ Services Offered
13.2.4 SWOT Analysis
13.3 AGCO Corporation
13.3.1 Company Overview
13.3.2 Financial
13.3.3 Products/ Services Offered
13.3.4 SWOT Analysis
13.4 Topcon Corporation
13.4.1 Company Overview
13.4.2 Financial
13.4.3 Products/ Services Offered
13.4.4 SWOT Analysis
13.5 CNH Industrial NV
13.5.1 Company Overview
13.5.2 Financial
13.5.3 Products/ Services Offered
13.5.4 SWOT Analysis
13.6 Kubota Corporation
13.6.1 Company Overview
13.6.2 Financial
13.6.3 Products/ Services Offered
13.6.4 SWOT Analysis
13.7 Yara International
13.7.1 Company Overview
13.7.2 Financial
13.7.3 Products/ Services Offered
13.7.4 SWOT Analysis
13.8 Valmont Industries, Inc.
13.8.1 Company Overview
13.8.2 Financial
13.8.3 Products/ Services Offered
13.8.4 SWOT Analysis
13.9 Lindsay Corporation
13.9.1 Company Overview
13.9.2 Financial
13.9.3 Products/ Services Offered
13.9.4 SWOT Analysis
13.10 Hexagon
13.10.1 Company Overview
13.10.2 Financial
13.10.3 Products/ Services Offered
13.10.4 SWOT Analysis
14. Use Cases and Best Practices
15. Conclusion
An accurate research report requires proper strategizing as well as implementation. There are multiple factors involved in the completion of good and accurate research report and selecting the best methodology to compete the research is the toughest part. Since the research reports we provide play a crucial role in any company’s decision-making process, therefore we at SNS Insider always believe that we should choose the best method which gives us results closer to reality. This allows us to reach at a stage wherein we can provide our clients best and accurate investment to output ratio.
Each report that we prepare takes a timeframe of 350-400 business hours for production. Starting from the selection of titles through a couple of in-depth brain storming session to the final QC process before uploading our titles on our website we dedicate around 350 working hours. The titles are selected based on their current market cap and the foreseen CAGR and growth.
The 5 steps process:
Step 1: Secondary Research:
Secondary Research or Desk Research is as the name suggests is a research process wherein, we collect data through the readily available information. In this process we use various paid and unpaid databases which our team has access to and gather data through the same. This includes examining of listed companies’ annual reports, Journals, SEC filling etc. Apart from this our team has access to various associations across the globe across different industries. Lastly, we have exchange relationships with various university as well as individual libraries.

Step 2: Primary Research
When we talk about primary research, it is a type of study in which the researchers collect relevant data samples directly, rather than relying on previously collected data. This type of research is focused on gaining content specific facts that can be sued to solve specific problems. Since the collected data is fresh and first hand therefore it makes the study more accurate and genuine.
We at SNS Insider have divided Primary Research into 2 parts.
Part 1 wherein we interview the KOLs of major players as well as the upcoming ones across various geographic regions. This allows us to have their view over the market scenario and acts as an important tool to come closer to the accurate market numbers. As many as 45 paid and unpaid primary interviews are taken from both the demand and supply side of the industry to make sure we land at an accurate judgement and analysis of the market.
This step involves the triangulation of data wherein our team analyses the interview transcripts, online survey responses and observation of on filed participants. The below mentioned chart should give a better understanding of the part 1 of the primary interview.

Part 2: In this part of primary research the data collected via secondary research and the part 1 of the primary research is validated with the interviews from individual consultants and subject matter experts.
Consultants are those set of people who have at least 12 years of experience and expertise within the industry whereas Subject Matter Experts are those with at least 15 years of experience behind their back within the same space. The data with the help of two main processes i.e., FGDs (Focused Group Discussions) and IDs (Individual Discussions). This gives us a 3rd party nonbiased primary view of the market scenario making it a more dependable one while collation of the data pointers.
Step 3: Data Bank Validation
Once all the information is collected via primary and secondary sources, we run that information for data validation. At our intelligence centre our research heads track a lot of information related to the market which includes the quarterly reports, the daily stock prices, and other relevant information. Our data bank server gets updated every fortnight and that is how the information which we collected using our primary and secondary information is revalidated in real time.

Step 4: QA/QC Process
After all the data collection and validation our team does a final level of quality check and quality assurance to get rid of any unwanted or undesired mistakes. This might include but not limited to getting rid of the any typos, duplication of numbers or missing of any important information. The people involved in this process include technical content writers, research heads and graphics people. Once this process is completed the title gets uploader on our platform for our clients to read it.
Step 5: Final QC/QA Process:
This is the last process and comes when the client has ordered the study. In this process a final QA/QC is done before the study is emailed to the client. Since we believe in giving our clients a good experience of our research studies, therefore, to make sure that we do not lack at our end in any way humanly possible we do a final round of quality check and then dispatch the study to the client.
Key Segments:
By Component
Hardware
Guidance and Steering systems
Flow and Application Control Devices
GPS/ DGPS Receivers
Handheld Mobile Devices/Computers
Yield Monitors
Others
Software
Services
Farm Operation Service
Integration and Consultation Services
By Technology
Map-based
Sensor-based
Active Optical Sensor VRT
Drone-based VRT
Satellite-based VRT
By Crop Type
Cereals and Grains
Corn
Wheat
Others
Fruits and Vegetables
Oilseeds and Pulses
Soybeans
Cotton
Other
Others
By Farm Size
Large farms
Mid-sized Farms
Small Farms
By Application
Fertilizers
Urea VRT
UAN VRT
NH3 VRT
Other VRT
Crop Protection Chemicals
Herbicides
Fungicides & Bactericides
Insecticides
Nematicides and others
Soil Sensing
Yield Monitoring
Irrigation
Others
Request for Segment Customization as per your Business Requirement: Segment Customization Request
Regional Coverage:
North America
US
Canada
Mexico
Europe
Eastern Europe
Poland
Romania
Hungary
Turkey
Rest of Eastern Europe
Western Europe
Germany
France
UK
Italy
Spain
Netherlands
Switzerland
Austria
Rest of Western Europe
Asia Pacific
China
India
Japan
South Korea
Vietnam
Singapore
Australia
Rest of Asia Pacific
Middle East & Africa
Middle East
UAE
Egypt
Saudi Arabia
Qatar
Rest of the Middle East
Africa
Nigeria
South Africa
Rest of Africa
Latin America
Brazil
Argentina
Colombia
Rest of Latin America
Request for Country Level Research Report: Country Level Customization Request
Available Customization
With the given market data, SNS Insider offers customization as per the company’s specific needs. The following customization options are available for the report:
Product Analysis
Criss-Cross segment analysis (e.g. Product X Application)
Product Matrix which gives a detailed comparison of the product portfolio of each company
Geographic Analysis
Additional countries in any of the regions
Company Information
Detailed analysis and profiling of additional market players (Up to five)
Cloud Data Warehouse Market was valued at USD 6.71 billion in 2023 and is expected to reach USD 43.57 billion by 2032, growing at a CAGR of 23.18% from 2024-2032.
Privileged Access Management Market was valued at USD 2.69 billion in 2023 and is expected to reach USD 17.42 billion by 2032, growing at a CAGR of 23.13% from 2024-2032.
The Data Center Transformation Market Size was valued at USD 13.85 Billion in 2023 and will reach USD 35.73 Billion by 2032 and grow at a CAGR of 11.2% by 2032.
Unified Communications as a Service Market was valued at USD 65.05 billion in 2023 and will reach USD 316.23 billion by 2032, growing at a CAGR of 19.27% by 2032.
The WAN Optimization Market size was valued at USD 1.87 Billion in 2023 and is expected to reach USD 3.81 Billion by 2032 and grow at a CAGR of 8.24% over the forecast period 2024-2032.
The Password Management Market was valued at USD 3.7 Billion in 2023 and is expected to reach USD 23.2 Billion by 2032, growing at a CAGR of 22.49% by 2032.

Hi! Click one of our member below to chat on Phone
© 2025 All Rights Reserved by SNS Insider Pvt Ltd


