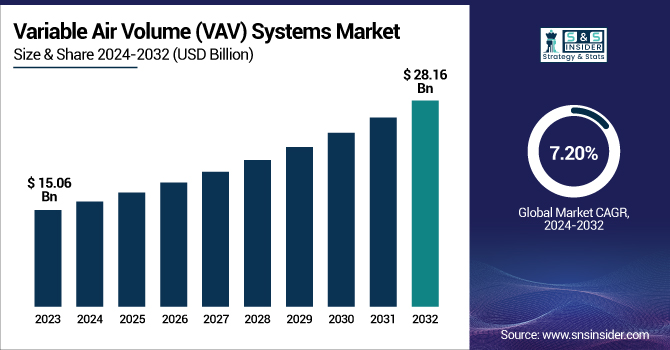
The Variable Air Volume (VAV) Systems Market Size was estimated at USD 15.06 billion in 2023 and is expected to arrive at USD 28.16 billion by 2032 with a growing CAGR of 7.20% over the forecast period 2024-2032. The Variable Air Volume (VAV) Systems Market has seen significant energy efficiency improvements, with retrofitting initiatives enhancing HVAC performance and cost savings. North America remains a key market, while Asia-Pacific is experiencing rapid adoption due to urbanization and sustainability goals. Innovations such as AI-driven airflow control, IoT-enabled predictive maintenance, and demand-based ventilation are driving technological advancements. Additionally, the growing focus on net-zero buildings and smart climate control solutions is shaping the future of VAV systems in modern infrastructure.
Drivers
The growing adoption of VAV systems is driven by rising energy efficiency regulations, sustainability initiatives, and advancements in smart HVAC technology.
The growing demand for energy-efficient HVAC systems is a key driver for the Variable Air Volume (VAV) Systems market. Exponential growth in energy consumption, and increasing government rules are pushing VAV systems adoption further in commercial, industrial, and residential buildings. One highly influential technology that reduces power usage and operating expenses in addition to the superior indoor air quality and thermal comfort these systems provide are VAV systems by optimizing airflow in real time according to the demand. Apart from these, the market is also driven by changing building standards related to green buildings like LEED certification and ASHRAE standards towards sustainability initiatives from municipalities and states. Moreover, the integration of smart sensors, IoT-enabled controls, and AI-based automation refinements coupled with technological advancements are improving efficiency and energy optimization of VAV systems. An integrated suite of building management systems (BMS) is also emerging in the market which allows different systems to operate together and save energy. Due to the extensive commercial infrastructure and urbanization, the VAV systems market is expected to grow steadily as there is wide emphasis across the globe on energy conservation & carbon footprint reduction.
Restraint
The high initial cost of VAV systems, including installation and customization, limits adoption among SMEs despite long-term efficiency benefits.
The high initial investment and installation costs of Variable Air Volume (VAV) systems pose a significant challenge, particularly for small and medium-sized enterprises (SMEs). VAV systems cost more upfront since they need special components such as dampers, sensors, and controllers that you will not find in conventional HVAC systems. Furthermore, the installation process is quite difficult and generally necessitates the support of professionals to make all the necessary modifications based on your particular building and the airflow required. This makes them more expensive upfront than traditional constant air volume (CAV) systems. While costs may be recovered over time with energy savings and operational efficiencies, the high capital expenditure associated with VAV system deployment serves as a barrier to adoption for many SMEs operating on tighter budgets. In addition, if existing infrastructure needs to be upgraded to accommodate VAV systems, it may be necessary to make changes that could significantly add to cost. Although energy efficiency incentives and rebates offered in several countries reduce the cost of no-cost measures, upfront capital cost is still considered as a major barrier that restrains the market penetration rate, particularly in cost-sensitive sectors and developing countries.
Opportunities
Technological advancements in sensor-based controls, AI-driven air distribution, and automation are enhancing VAV system efficiency, reducing energy consumption, and driving market growth.
Technological innovations in HVAC systems are transforming the Variable Air Volume (VAV) market by enhancing efficiency, automation, and sustainability. Research on sensor-based controls, which include continuous measurement of airflow and temperature to ensure better energy utilization, is still ongoing to enhance indoor air quality. These help in creating an adaptive air distribution mechanism going with the flow of occupancy in the building and cutting down energy wastage, along with providing comfort. Automation, such as IoT driven VAV systems, helps a lot to integrate seamlessly with a smart building management system that can provide predictive maintenance and real-time control capabilities. Such improvements cut down the operating costs, while also making sure they meet energy efficiency regulations that are getting stricter as every day goes by. By analyzing usage patterns and automatically tuning settings, machine learning algorithms further boost system performance. The VAV Systems market will see exponential growth as industries and commercial building & factories are accelerating the shift to smart infrastructure, which is anticipated to stimulate innovation and expand the HVAC sector.
Challenges
Evolving energy regulations and certification requirements increase compliance costs and complexity for VAV system manufacturers and end-users.
Regulatory and compliance challenges in the Variable Air Volume (VAV) systems market stem from the evolving landscape of energy efficiency standards and environmental regulations. Governments around the globe regulate strict building codes , including standards like ASHRAE, LEED certification, and the European Union Energy Performance of Buildings Directive (EPBD) to ensure HVAC manufacturers have equipment with high-efficiency thresholds. Adherance to these regulations requires ongoing technology, thus pushing R&D expenses up for production. In addition, the long and expensive certification processes can cause delays for product launches and market entry. This means end-users must typically retrofit or upgrade existing HVAC systems to comply, which drives their investment cost. Companies have to adapt their product to each regional regulation and the fact that there are so many different regulations around the world makes it all much more complex! All of these regulations listed above pose challenges for VAV system manufacturers and consumers alike, balancing cost metrics while needing to apply binding regulatory frameworks into VAV applications.
By Type
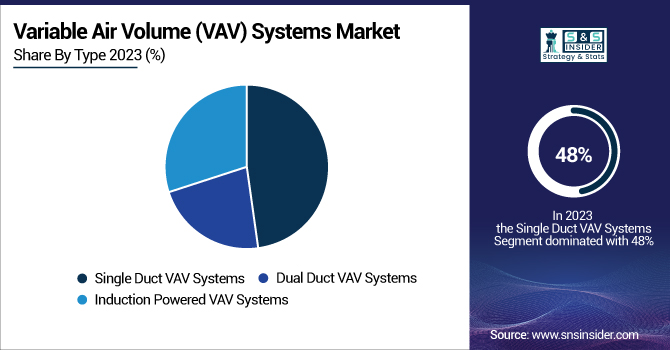
The Single Duct VAV Systems segment dominated with a market share of over 48% in 2023, due to its extensive use in commercial buildings, including offices, hospitals, and educational institutions. Such systems are extremely popular due to the efficient control of air and thermal comfort with energy savings. They are ideal for large-scale applications due to their low component and maintenance requirements, making them a cost-effective solution when compared to other VAV systems. Also, HVAC innovation enhanced the preference for these devices along with a developing focus on energy efficiency. The market of single duct VAV systems is continuously increasing due to increasing demand for the sustainable and smart building solutions, which makes it the most significant part of the market.
By End-Use Vertical
The commercial segment dominated with a market share of over 42% in 2023, and is also the fastest-growing segment. As a result of the enormous use of VAV systems in commercial areas, including office buildings, shopping malls, hospitals, and hotels. Such systems deliver accurate environmental temperature control, improve indoor air quality, and offer excellent energy savings, with these being especially applicable to large-scale establishments. With an increasing focus on sustainability and energy efficiency in businesses, the demand for VAV systems is on the rise. Furthermore, their adoption is being accelerated by advancements in smart building technologies as well as rigorous energy regulations. Due to increasing focus on economical and energy efficient HVAC systems, the commercial segment is expected to dominate the VAV systems market during the forecast period.
By Application
The Air Filter segment holds a significant share in the Variable Air Volume (VAV) Systems Market due to its essential role in maintaining indoor air quality and ensuring efficient airflow. The concept of HVAC systems is becoming more advanced, which thus increases the demand for high-performance air filters due to the greater awareness towards air pollution and its effects on health. The adoption of technologically advanced filtration systems is further fueled by stringent air quality regulations and sustainability initiatives. And commercial sectors like healthcare, commercial buildings, and manufacturing require improved air filtration to meet safety and environmental regulations. The increasing demand for the energy consumption of HVAC components is one of the key factors that will drive growth in the air filter market in the coming years.
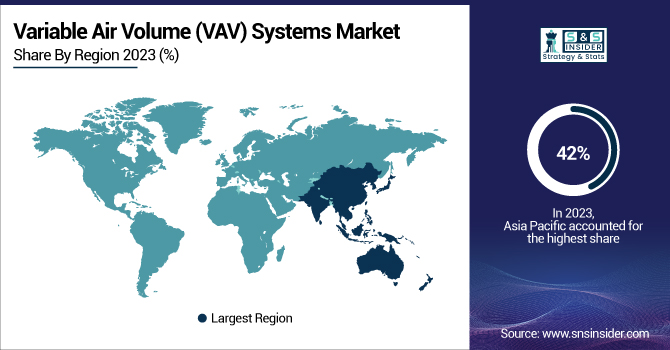
The Asia-Pacific region dominated with a market share of over 42% in 2023, primarily due to rapid urbanization and expanding commercial infrastructure. In countries such as China, India, and Japan, the development of office spaces, shopping malls, and industrial plants is on the rise, leading to a further increase in demand for HVAC solutions. Moreover, government policies focused on establishing energy-efficient buildings and sustainable practices of construction further aid the market growth. Increasing awareness regarding indoor air quality and demand for economic climate control solutions is also promoting growth. Another reason for the dominance of the region can be attributed to the technological innovations such as smart and connected HVAC systems incorporated through automation and the Internet of Things (IoT). The Asia-Pacific market will continue its leadership through investments in infrastructure development, and strict energy regulations.
Europe is experiencing the fastest growth in the Variable Air Volume (VAV) Systems Market due to stringent energy efficiency regulations and the increasing adoption of smart building solutions. The institution of strict policies by several governments across the region, for reduction of carbon emissions, is encouraging the use of energy-efficient HVAC systems such as VAV. Moreover, the increasing focus on sustainable development and the green building standards, such as BREEAM and LEED, are juga memacu permintaannyan. The market is additionally benefited by technological advancements such as IoT-enabled climate control and automation. Growth is also driven by the increasing adoption of smart infrastructure and retrofitting projects in commercial buildings. The demand for such solutions in Europe is anticipated to keep experiencing positive market growth in the upcoming years due to the growing focus on energy conservation and sustainability-focused goals.
Honeywell International Inc. (VAV Controllers, Smart Thermostats)
Carrier Corporation (VAV Air Terminals, HVAC Control Systems)
Johnson Controls (VAV Boxes, Building Automation Systems)
Warren Technologies (Electric Duct Heaters, VAV Terminals)
Emerson Electric Co. (HVAC Control Solutions, Actuators)
Siemens (VAV Compact Controllers, Damper Actuators)
TROX GmbH (VAV Terminal Units, Air Volume Controllers)
Swegon Group AB (VAV Diffusers, Climate Control Systems)
Triton Process Automation Pvt. Ltd. (VAV Control Panels, HVAC Automation Solutions)
Trane (VAV Terminal Units, Air Handling Systems)
Daikin Industries Ltd. (VAV Air Handlers, HVAC Controls)
Lennox International Inc. (VAV Rooftop Units, Airflow Systems)
Schneider Electric (VAV Controllers, Smart Building Solutions)
Belimo Holding AG (Damper Actuators, VAV System Sensors)
Greenheck Fan Corporation (VAV Diffusers, Air Distribution Systems)
Price Industries (VAV Boxes, Airflow Control Systems)
United Technologies Corporation (VAV Terminals, Energy Management Systems)
Mitsubishi Electric Corporation (VAV Controllers, HVAC Energy Solutions)
Ruskin Company (VAV Dampers, Air Control Solutions)
Krueger HVAC (VAV Terminal Units, Air Distribution Products)
Johnson Controls
Ingersoll Rand Plc.
Daikin Industries, Ltd.
United Technologies Corporation
Emerson Electric Co.
Honeywell International Inc.
Siemens
TROX GmbH
KMC Controls
Barcol-Air
On October 3, 2024: Trane introduced its redesigned Precedent Rooftop Unit portfolio, along with enhancements to its unitary, split system, and VAV products. These upgrades focus on decarbonization, incorporating low-GWP refrigerants to support building owners and engineers in adopting more sustainable HVAC solutions.
On March 7, 2024: Schneider Electric launched its EasyLogic Building Management System (BMS) range, tailored for basic building architectures. This cost-effective solution features field controllers and sensors for HVAC applications, enhancing installation efficiency and energy management while maintaining Schneider Electric's trusted reliability.
Report Attributes | Details |
Market Size in 2023 | USD 15.06 Billion |
Market Size by 2032 | USD 28.16 Billion |
CAGR | CAGR of 7.20% From 2024 to 2032 |
Base Year | 2023 |
Forecast Period | 2024-2032 |
Historical Data | 2020-2022 |
Report Scope & Coverage | Market Size, Segments Analysis, Competitive Landscape, Regional Analysis, DROC & SWOT Analysis, Forecast Outlook |
Key Segments | • By Type (Single Duct VAV Systems, Dual Duct VAV Systems, Induction Powered VAV Systems) • By End-use Vertical (Residential, Industrial, Commercial, Others) • By Application (Air Filter, Heating & Cooling Coil, Fan (Inlet & Outlet), Diffuser, Damper & Air Handler, Radiator, Thermostat, Others (Sensors & Inductors) |
Regional Analysis/Coverage | North America (US, Canada, Mexico), Europe (Eastern Europe [Poland, Romania, Hungary, Turkey, Rest of Eastern Europe] Western Europe] Germany, France, UK, Italy, Spain, Netherlands, Switzerland, Austria, Rest of Western Europe]), Asia Pacific (China, India, Japan, South Korea, Vietnam, Singapore, Australia, Rest of Asia Pacific), Middle East & Africa (Middle East [UAE, Egypt, Saudi Arabia, Qatar, Rest of Middle East], Africa [Nigeria, South Africa, Rest of Africa], Latin America (Brazil, Argentina, Colombia, Rest of Latin America) |
Company Profiles | Honeywell International Inc., Carrier Corporation, Johnson Controls, Warren Technologies, Emerson Electric Co., Siemens, TROX GmbH, Swegon Group AB, Triton Process Automation Pvt. Ltd., Trane, Daikin Industries Ltd., Lennox International Inc., Schneider Electric, Belimo Holding AG, Greenheck Fan Corporation, Price Industries, United Technologies Corporation, Mitsubishi Electric Corporation, Ruskin Company, Krueger HVAC. |
Ans: The Variable Air Volume (VAV) Systems Market is expected to grow at a CAGR of 7.20% during 2024-2032.
Ans: The Variable Air Volume (VAV) Systems Market was USD 15.06 billion in 2023 and is expected to reach USD 28.16 billion by 2032.
Ans: The growing adoption of VAV systems is driven by rising energy efficiency regulations, sustainability initiatives, and advancements in smart HVAC technology.
Ans: The “Single Duct VAV Systems” segment dominated the Variable Air Volume (VAV) Systems Market.
Ans: Asia-Pacific dominated the Variable Air Volume (VAV) Systems Market in 2023
TABLE OF CONTENT
1. Introduction
1.1 Market Definition
1.2 Scope (Inclusion and Exclusions)
1.3 Research Assumptions
2. Executive Summary
2.1 Market Overview
2.2 Regional Synopsis
2.3 Competitive Summary
3. Research Methodology
3.1 Top-Down Approach
3.2 Bottom-up Approach
3.3. Data Validation
3.4 Primary Interviews
4. Market Dynamics
4.1 Market Analysis
4.1.1 Drivers
4.1.2 Restraints
4.1.3 Opportunities
4.1.4 Challenges
4.2 PESTLE Analysis
4.3 Porter’s Five Forces Model
5. Statistical Insights and Trend Reporting
5.1 Energy Efficiency Improvements & Cost Savings (2020-2023)
5.2 Installed Base of VAV Systems, by Region
5.3 Retrofitting vs. New Installations, by Region (2020-2023)
5.4 Technological Advancements in VAV Systems
6. Competitive Landscape
6.1 List of Major Companies, By Region
6.2 Market Share Analysis, By Region
6.3 Product Benchmarking
6.3.1 Product specifications and features
6.3.2 Pricing
6.4 Strategic Initiatives
6.4.1 Marketing and promotional activities
6.4.2 Distribution and Supply Chain Strategies
6.4.3 Expansion plans and new product launches
6.4.4 Strategic partnerships and collaborations
6.5 Technological Advancements
6.6 Market Positioning and Branding
7. Variable Air Volume (VAV) Systems Market Segmentation, By Type
7.1 Chapter Overview
7.2 Single Duct VAV Systems
7.2.1 Single Duct VAV Systems Market Trends Analysis (2020-2032)
7.2.2 Single Duct VAV Systems Market Size Estimates and Forecasts to 2032 (USD Billion)
7.3 Dual Duct VAV Systems
7.3.1 Dual Duct VAV Systems Market Trends Analysis (2020-2032)
7.3.2 Dual Duct VAV Systems Market Size Estimates and Forecasts to 2032 (USD Billion)
7.4 Induction Powered VAV Systems
7.4.1 Induction Powered VAV Systems Market Trends Analysis (2020-2032)
7.4.2 Induction Powered VAV Systems Market Size Estimates and Forecasts to 2032 (USD Billion)
8. Variable Air Volume (VAV) Systems Market Segmentation, By End-use Vertical
8.1 Chapter Overview
8.2 Residential
8.2.1 Residential Market Trends Analysis (2020-2032)
8.2.2 Residential Market Size Estimates and Forecasts to 2032 (USD Billion)
8.3 Industrial
8.3.1 Industrial Market Trends Analysis (2020-2032)
8.3.2 Industrial Market Size Estimates and Forecasts to 2032 (USD Billion)
8.4 Commercial
8.4.1 Commercial Market Trends Analysis (2020-2032)
8.4.2 Commercial Market Size Estimates and Forecasts to 2032 (USD Billion)
8.5 Others
8.5.1 Others Market Trends Analysis (2020-2032)
8.5.2 Others Market Size Estimates and Forecasts to 2032 (USD Billion)
9. Variable Air Volume (VAV) Systems Market Segmentation, By Application
9.1 Chapter Overview
9.2 Air Filter
9.2.1 Air Filter Market Trends Analysis (2020-2032)
9.2.2 Air Filter Market Size Estimates and Forecasts to 2032 (USD Billion)
9.3 Heating & Cooling Coil
9.3.1 Heating & Cooling Coil Market Trends Analysis (2020-2032)
9.3.2 Heating & Cooling Coil Market Size Estimates and Forecasts to 2032 (USD Billion)
9.4 Fan (Inlet & Outlet)
9.4.1 Fan (Inlet & Outlet) Market Trends Analysis (2020-2032)
9.4.2 Fan (Inlet & Outlet) Market Size Estimates and Forecasts to 2032 (USD Billion)
9.5 Diffuser
9.5.1 Diffuser Market Trends Analysis (2020-2032)
9.5.2 Diffuser Market Size Estimates and Forecasts to 2032 (USD Billion)
9.6 Damper & Air Handler
9.6.1 Damper & Air Handler Market Trends Analysis (2020-2032)
9.6.2 Damper & Air Handler Market Size Estimates and Forecasts to 2032 (USD Billion)
9.7 Radiator
9.7.1 Radiator Market Trends Analysis (2020-2032)
9.7.2 Radiator Market Size Estimates and Forecasts to 2032 (USD Billion)
9.8 Thermostat
9.8.1 Thermostat Market Trends Analysis (2020-2032)
9.8.2 Thermostat Market Size Estimates and Forecasts to 2032 (USD Billion)
9.9 Others (Sensors & Inductors)
9.9.1 Others (Sensors & Inductors) Market Trends Analysis (2020-2032)
9.9.2 Others (Sensors & Inductors) Market Size Estimates and Forecasts to 2032 (USD Billion)
10. Regional Analysis
10.1 Chapter Overview
10.2 North America
10.2.1 Trends Analysis
10.2.2 North America Variable Air Volume (VAV) Systems Market Estimates and Forecasts, by Country (2020-2032) (USD Billion)
10.2.3 North America Variable Air Volume (VAV) Systems Market Estimates and Forecasts, By Type(2020-2032) (USD Billion)
10.2.4 North America Variable Air Volume (VAV) Systems Market Estimates and Forecasts, By End-use Vertical (2020-2032) (USD Billion)
10.2.5 North America Variable Air Volume (VAV) Systems Market Estimates and Forecasts, By Application (2020-2032) (USD Billion)
10.2.6 USA
10.2.6.1 USA Variable Air Volume (VAV) Systems Market Estimates and Forecasts, By Type(2020-2032) (USD Billion)
10.2.6.2 USA Variable Air Volume (VAV) Systems Market Estimates and Forecasts, By End-use Vertical (2020-2032) (USD Billion)
10.2.6.3 USA Variable Air Volume (VAV) Systems Market Estimates and Forecasts, By Application (2020-2032) (USD Billion)
10.2.7 Canada
10.2.7.1 Canada Variable Air Volume (VAV) Systems Market Estimates and Forecasts, By Type(2020-2032) (USD Billion)
10.2.7.2 Canada Variable Air Volume (VAV) Systems Market Estimates and Forecasts, By End-use Vertical (2020-2032) (USD Billion)
10.2.7.3 Canada Variable Air Volume (VAV) Systems Market Estimates and Forecasts, By Application (2020-2032) (USD Billion)
10.2.8 Mexico
10.2.8.1 Mexico Variable Air Volume (VAV) Systems Market Estimates and Forecasts, By Type(2020-2032) (USD Billion)
10.2.8.2 Mexico Variable Air Volume (VAV) Systems Market Estimates and Forecasts, By End-use Vertical (2020-2032) (USD Billion)
10.2.8.3 Mexico Variable Air Volume (VAV) Systems Market Estimates and Forecasts, By Application (2020-2032) (USD Billion)
10.3 Europe
10.3.1 Eastern Europe
10.3.1.1 Trends Analysis
10.3.1.2 Eastern Europe Variable Air Volume (VAV) Systems Market Estimates and Forecasts, by Country (2020-2032) (USD Billion)
10.3.1.3 Eastern Europe Variable Air Volume (VAV) Systems Market Estimates and Forecasts, By Type(2020-2032) (USD Billion)
10.3.1.4 Eastern Europe Variable Air Volume (VAV) Systems Market Estimates and Forecasts, By End-use Vertical (2020-2032) (USD Billion)
10.3.1.5 Eastern Europe Variable Air Volume (VAV) Systems Market Estimates and Forecasts, By Application (2020-2032) (USD Billion)
10.3.1.6 Poland
10.3.1.6.1 Poland Variable Air Volume (VAV) Systems Market Estimates and Forecasts, By Type(2020-2032) (USD Billion)
10.3.1.6.2 Poland Variable Air Volume (VAV) Systems Market Estimates and Forecasts, By End-use Vertical (2020-2032) (USD Billion)
10.3.1.6.3 Poland Variable Air Volume (VAV) Systems Market Estimates and Forecasts, By Application (2020-2032) (USD Billion)
10.3.1.7 Romania
10.3.1.7.1 Romania Variable Air Volume (VAV) Systems Market Estimates and Forecasts, By Type(2020-2032) (USD Billion)
10.3.1.7.2 Romania Variable Air Volume (VAV) Systems Market Estimates and Forecasts, By End-use Vertical (2020-2032) (USD Billion)
10.3.1.7.3 Romania Variable Air Volume (VAV) Systems Market Estimates and Forecasts, By Application (2020-2032) (USD Billion)
10.3.1.8 Hungary
10.3.1.8.1 Hungary Variable Air Volume (VAV) Systems Market Estimates and Forecasts, By Type(2020-2032) (USD Billion)
10.3.1.8.2 Hungary Variable Air Volume (VAV) Systems Market Estimates and Forecasts, By End-use Vertical (2020-2032) (USD Billion)
10.3.1.8.3 Hungary Variable Air Volume (VAV) Systems Market Estimates and Forecasts, By Application (2020-2032) (USD Billion)
10.3.1.9 Turkey
10.3.1.9.1 Turkey Variable Air Volume (VAV) Systems Market Estimates and Forecasts, By Type(2020-2032) (USD Billion)
10.3.1.9.2 Turkey Variable Air Volume (VAV) Systems Market Estimates and Forecasts, By End-use Vertical (2020-2032) (USD Billion)
10.3.1.9.3 Turkey Variable Air Volume (VAV) Systems Market Estimates and Forecasts, By Application (2020-2032) (USD Billion)
10.3.1.10 Rest of Eastern Europe
10.3.1.10.1 Rest of Eastern Europe Variable Air Volume (VAV) Systems Market Estimates and Forecasts, By Type(2020-2032) (USD Billion)
10.3.1.10.2 Rest of Eastern Europe Variable Air Volume (VAV) Systems Market Estimates and Forecasts, By End-use Vertical (2020-2032) (USD Billion)
10.3.1.10.3 Rest of Eastern Europe Variable Air Volume (VAV) Systems Market Estimates and Forecasts, By Application (2020-2032) (USD Billion)
10.3.2 Western Europe
10.3.2.1 Trends Analysis
10.3.2.2 Western Europe Variable Air Volume (VAV) Systems Market Estimates and Forecasts, by Country (2020-2032) (USD Billion)
10.3.2.3 Western Europe Variable Air Volume (VAV) Systems Market Estimates and Forecasts, By Type(2020-2032) (USD Billion)
10.3.2.4 Western Europe Variable Air Volume (VAV) Systems Market Estimates and Forecasts, By End-use Vertical (2020-2032) (USD Billion)
10.3.2.5 Western Europe Variable Air Volume (VAV) Systems Market Estimates and Forecasts, By Application (2020-2032) (USD Billion)
10.3.2.6 Germany
10.3.2.6.1 Germany Variable Air Volume (VAV) Systems Market Estimates and Forecasts, By Type(2020-2032) (USD Billion)
10.3.2.6.2 Germany Variable Air Volume (VAV) Systems Market Estimates and Forecasts, By End-use Vertical (2020-2032) (USD Billion)
10.3.2.6.3 Germany Variable Air Volume (VAV) Systems Market Estimates and Forecasts, By Application (2020-2032) (USD Billion)
10.3.2.7 France
10.3.2.7.1 France Variable Air Volume (VAV) Systems Market Estimates and Forecasts, By Type(2020-2032) (USD Billion)
10.3.2.7.2 France Variable Air Volume (VAV) Systems Market Estimates and Forecasts, By End-use Vertical (2020-2032) (USD Billion)
10.3.2.7.3 France Variable Air Volume (VAV) Systems Market Estimates and Forecasts, By Application (2020-2032) (USD Billion)
10.3.2.8 UK
10.3.2.8.1 UK Variable Air Volume (VAV) Systems Market Estimates and Forecasts, By Type(2020-2032) (USD Billion)
10.3.2.8.2 UK Variable Air Volume (VAV) Systems Market Estimates and Forecasts, By End-use Vertical (2020-2032) (USD Billion)
10.3.2.8.3 UK Variable Air Volume (VAV) Systems Market Estimates and Forecasts, By Application (2020-2032) (USD Billion)
10.3.2.9 Italy
10.3.2.9.1 Italy Variable Air Volume (VAV) Systems Market Estimates and Forecasts, By Type(2020-2032) (USD Billion)
10.3.2.9.2 Italy Variable Air Volume (VAV) Systems Market Estimates and Forecasts, By End-use Vertical (2020-2032) (USD Billion)
10.3.2.9.3 Italy Variable Air Volume (VAV) Systems Market Estimates and Forecasts, By Application (2020-2032) (USD Billion)
10.3.2.10 Spain
10.3.2.10.1 Spain Variable Air Volume (VAV) Systems Market Estimates and Forecasts, By Type(2020-2032) (USD Billion)
10.3.2.10.2 Spain Variable Air Volume (VAV) Systems Market Estimates and Forecasts, By End-use Vertical (2020-2032) (USD Billion)
10.3.2.10.3 Spain Variable Air Volume (VAV) Systems Market Estimates and Forecasts, By Application (2020-2032) (USD Billion)
10.3.2.11 Netherlands
10.3.2.11.1 Netherlands Variable Air Volume (VAV) Systems Market Estimates and Forecasts, By Type(2020-2032) (USD Billion)
10.3.2.11.2 Netherlands Variable Air Volume (VAV) Systems Market Estimates and Forecasts, By End-use Vertical (2020-2032) (USD Billion)
10.3.2.11.3 Netherlands Variable Air Volume (VAV) Systems Market Estimates and Forecasts, By Application (2020-2032) (USD Billion)
10.3.2.12 Switzerland
10.3.2.12.1 Switzerland Variable Air Volume (VAV) Systems Market Estimates and Forecasts, By Type(2020-2032) (USD Billion)
10.3.2.12.2 Switzerland Variable Air Volume (VAV) Systems Market Estimates and Forecasts, By End-use Vertical (2020-2032) (USD Billion)
10.3.2.12.3 Switzerland Variable Air Volume (VAV) Systems Market Estimates and Forecasts, By Application (2020-2032) (USD Billion)
10.3.2.13 Austria
10.3.2.13.1 Austria Variable Air Volume (VAV) Systems Market Estimates and Forecasts, By Type(2020-2032) (USD Billion)
10.3.2.13.2 Austria Variable Air Volume (VAV) Systems Market Estimates and Forecasts, By End-use Vertical (2020-2032) (USD Billion)
10.3.2.13.3 Austria Variable Air Volume (VAV) Systems Market Estimates and Forecasts, By Application (2020-2032) (USD Billion)
10.3.2.14 Rest of Western Europe
10.3.2.14.1 Rest of Western Europe Variable Air Volume (VAV) Systems Market Estimates and Forecasts, By Type(2020-2032) (USD Billion)
10.3.2.14.2 Rest of Western Europe Variable Air Volume (VAV) Systems Market Estimates and Forecasts, By End-use Vertical (2020-2032) (USD Billion)
10.3.2.14.3 Rest of Western Europe Variable Air Volume (VAV) Systems Market Estimates and Forecasts, By Application (2020-2032) (USD Billion)
10.4 Asia-Pacific
10.4.1 Trends Analysis
10.4.2 Asia-Pacific Variable Air Volume (VAV) Systems Market Estimates and Forecasts, by Country (2020-2032) (USD Billion)
10.4.3 Asia-Pacific Variable Air Volume (VAV) Systems Market Estimates and Forecasts, By Type(2020-2032) (USD Billion)
10.4.4 Asia-Pacific Variable Air Volume (VAV) Systems Market Estimates and Forecasts, By End-use Vertical (2020-2032) (USD Billion)
10.4.5 Asia-Pacific Variable Air Volume (VAV) Systems Market Estimates and Forecasts, By Application (2020-2032) (USD Billion)
10.4.6 China
10.4.6.1 China Variable Air Volume (VAV) Systems Market Estimates and Forecasts, By Type(2020-2032) (USD Billion)
10.4.6.2 China Variable Air Volume (VAV) Systems Market Estimates and Forecasts, By End-use Vertical (2020-2032) (USD Billion)
10.4.6.3 China Variable Air Volume (VAV) Systems Market Estimates and Forecasts, By Application (2020-2032) (USD Billion)
10.4.7 India
10.4.7.1 India Variable Air Volume (VAV) Systems Market Estimates and Forecasts, By Type(2020-2032) (USD Billion)
10.4.7.2 India Variable Air Volume (VAV) Systems Market Estimates and Forecasts, By End-use Vertical (2020-2032) (USD Billion)
10.4.7.3 India Variable Air Volume (VAV) Systems Market Estimates and Forecasts, By Application (2020-2032) (USD Billion)
10.4.8 Japan
10.4.8.1 Japan Variable Air Volume (VAV) Systems Market Estimates and Forecasts, By Type(2020-2032) (USD Billion)
10.4.8.2 Japan Variable Air Volume (VAV) Systems Market Estimates and Forecasts, By End-use Vertical (2020-2032) (USD Billion)
10.4.8.3 Japan Variable Air Volume (VAV) Systems Market Estimates and Forecasts, By Application (2020-2032) (USD Billion)
10.4.9 South Korea
10.4.9.1 South Korea Variable Air Volume (VAV) Systems Market Estimates and Forecasts, By Type(2020-2032) (USD Billion)
10.4.9.2 South Korea Variable Air Volume (VAV) Systems Market Estimates and Forecasts, By End-use Vertical (2020-2032) (USD Billion)
10.4.9.3 South Korea Variable Air Volume (VAV) Systems Market Estimates and Forecasts, By Application (2020-2032) (USD Billion)
10.4.10 Vietnam
10.4.10.1 Vietnam Variable Air Volume (VAV) Systems Market Estimates and Forecasts, By Type(2020-2032) (USD Billion)
10.4.10.2 Vietnam Variable Air Volume (VAV) Systems Market Estimates and Forecasts, By End-use Vertical (2020-2032) (USD Billion)
10.4.10.3 Vietnam Variable Air Volume (VAV) Systems Market Estimates and Forecasts, By Application (2020-2032) (USD Billion)
10.4.11 Singapore
10.4.11.1 Singapore Variable Air Volume (VAV) Systems Market Estimates and Forecasts, By Type(2020-2032) (USD Billion)
10.4.11.2 Singapore Variable Air Volume (VAV) Systems Market Estimates and Forecasts, By End-use Vertical (2020-2032) (USD Billion)
10.4.11.3 Singapore Variable Air Volume (VAV) Systems Market Estimates and Forecasts, By Application (2020-2032) (USD Billion)
10.4.12 Australia
10.4.12.1 Australia Variable Air Volume (VAV) Systems Market Estimates and Forecasts, By Type(2020-2032) (USD Billion)
10.4.12.2 Australia Variable Air Volume (VAV) Systems Market Estimates and Forecasts, By End-use Vertical (2020-2032) (USD Billion)
10.4.12.3 Australia Variable Air Volume (VAV) Systems Market Estimates and Forecasts, By Application (2020-2032) (USD Billion)
10.4.13 Rest of Asia-Pacific
10.4.13.1 Rest of Asia-Pacific Variable Air Volume (VAV) Systems Market Estimates and Forecasts, By Type(2020-2032) (USD Billion)
10.4.13.2 Rest of Asia-Pacific Variable Air Volume (VAV) Systems Market Estimates and Forecasts, By End-use Vertical (2020-2032) (USD Billion)
10.4.13.3 Rest of Asia-Pacific Variable Air Volume (VAV) Systems Market Estimates and Forecasts, By Application (2020-2032) (USD Billion)
10.5 Middle East and Africa
10.5.1 Middle East
10.5.1.1 Trends Analysis
10.5.1.2 Middle East Variable Air Volume (VAV) Systems Market Estimates and Forecasts, by Country (2020-2032) (USD Billion)
10.5.1.3 Middle East Variable Air Volume (VAV) Systems Market Estimates and Forecasts, By Type(2020-2032) (USD Billion)
10.5.1.4 Middle East Variable Air Volume (VAV) Systems Market Estimates and Forecasts, By End-use Vertical (2020-2032) (USD Billion)
10.5.1.5 Middle East Variable Air Volume (VAV) Systems Market Estimates and Forecasts, By Application (2020-2032) (USD Billion)
10.5.1.6 UAE
10.5.1.6.1 UAE Variable Air Volume (VAV) Systems Market Estimates and Forecasts, By Type(2020-2032) (USD Billion)
10.5.1.6.2 UAE Variable Air Volume (VAV) Systems Market Estimates and Forecasts, By End-use Vertical (2020-2032) (USD Billion)
10.5.1.6.3 UAE Variable Air Volume (VAV) Systems Market Estimates and Forecasts, By Application (2020-2032) (USD Billion)
10.5.1.7 Egypt
10.5.1.7.1 Egypt Variable Air Volume (VAV) Systems Market Estimates and Forecasts, By Type(2020-2032) (USD Billion)
10.5.1.7.2 Egypt Variable Air Volume (VAV) Systems Market Estimates and Forecasts, By End-use Vertical (2020-2032) (USD Billion)
10.5.1.7.3 Egypt Variable Air Volume (VAV) Systems Market Estimates and Forecasts, By Application (2020-2032) (USD Billion)
10.5.1.8 Saudi Arabia
10.5.1.8.1 Saudi Arabia Variable Air Volume (VAV) Systems Market Estimates and Forecasts, By Type(2020-2032) (USD Billion)
10.5.1.8.2 Saudi Arabia Variable Air Volume (VAV) Systems Market Estimates and Forecasts, By End-use Vertical (2020-2032) (USD Billion)
10.5.1.8.3 Saudi Arabia Variable Air Volume (VAV) Systems Market Estimates and Forecasts, By Application (2020-2032) (USD Billion)
10.5.1.9 Qatar
10.5.1.9.1 Qatar Variable Air Volume (VAV) Systems Market Estimates and Forecasts, By Type(2020-2032) (USD Billion)
10.5.1.9.2 Qatar Variable Air Volume (VAV) Systems Market Estimates and Forecasts, By End-use Vertical (2020-2032) (USD Billion)
10.5.1.9.3 Qatar Variable Air Volume (VAV) Systems Market Estimates and Forecasts, By Application (2020-2032) (USD Billion)
10.5.1.10 Rest of Middle East
10.5.1.10.1 Rest of Middle East Variable Air Volume (VAV) Systems Market Estimates and Forecasts, By Type(2020-2032) (USD Billion)
10.5.1.10.2 Rest of Middle East Variable Air Volume (VAV) Systems Market Estimates and Forecasts, By End-use Vertical (2020-2032) (USD Billion)
10.5.1.10.3 Rest of Middle East Variable Air Volume (VAV) Systems Market Estimates and Forecasts, By Application (2020-2032) (USD Billion)
10.5.2 Africa
10.5.2.1 Trends Analysis
10.5.2.2 Africa Variable Air Volume (VAV) Systems Market Estimates and Forecasts, by Country (2020-2032) (USD Billion)
10.5.2.3 Africa Variable Air Volume (VAV) Systems Market Estimates and Forecasts, By Type(2020-2032) (USD Billion)
10.5.2.4 Africa Variable Air Volume (VAV) Systems Market Estimates and Forecasts, By End-use Vertical (2020-2032) (USD Billion)
10.5.2.5 Africa Variable Air Volume (VAV) Systems Market Estimates and Forecasts, By Application (2020-2032) (USD Billion)
10.5.2.6 South Africa
10.5.2.6.1 South Africa Variable Air Volume (VAV) Systems Market Estimates and Forecasts, By Type(2020-2032) (USD Billion)
10.5.2.6.2 South Africa Variable Air Volume (VAV) Systems Market Estimates and Forecasts, By End-use Vertical (2020-2032) (USD Billion)
10.5.2.6.3 South Africa Variable Air Volume (VAV) Systems Market Estimates and Forecasts, By Application (2020-2032) (USD Billion)
10.5.2.7 Nigeria
10.5.2.7.1 Nigeria Variable Air Volume (VAV) Systems Market Estimates and Forecasts, By Type(2020-2032) (USD Billion)
10.5.2.7.2 Nigeria Variable Air Volume (VAV) Systems Market Estimates and Forecasts, By End-use Vertical (2020-2032) (USD Billion)
10.5.2.7.3 Nigeria Variable Air Volume (VAV) Systems Market Estimates and Forecasts, By Application (2020-2032) (USD Billion)
10.5.2.8 Rest of Africa
10.5.2.8.1 Rest of Africa Variable Air Volume (VAV) Systems Market Estimates and Forecasts, By Type(2020-2032) (USD Billion)
10.5.2.8.2 Rest of Africa Variable Air Volume (VAV) Systems Market Estimates and Forecasts, By End-use Vertical (2020-2032) (USD Billion)
10.5.2.8.3 Rest of Africa Variable Air Volume (VAV) Systems Market Estimates and Forecasts, By Application (2020-2032) (USD Billion)
10.6 Latin America
10.6.1 Trends Analysis
10.6.2 Latin America Variable Air Volume (VAV) Systems Market Estimates and Forecasts, by Country (2020-2032) (USD Billion)
10.6.3 Latin America Variable Air Volume (VAV) Systems Market Estimates and Forecasts, By Type(2020-2032) (USD Billion)
10.6.4 Latin America Variable Air Volume (VAV) Systems Market Estimates and Forecasts, By End-use Vertical (2020-2032) (USD Billion)
10.6.5 Latin America Variable Air Volume (VAV) Systems Market Estimates and Forecasts, By Application (2020-2032) (USD Billion)
10.6.6 Brazil
10.6.6.1 Brazil Variable Air Volume (VAV) Systems Market Estimates and Forecasts, By Type(2020-2032) (USD Billion)
10.6.6.2 Brazil Variable Air Volume (VAV) Systems Market Estimates and Forecasts, By End-use Vertical (2020-2032) (USD Billion)
10.6.6.3 Brazil Variable Air Volume (VAV) Systems Market Estimates and Forecasts, By Application (2020-2032) (USD Billion)
10.6.7 Argentina
10.6.7.1 Argentina Variable Air Volume (VAV) Systems Market Estimates and Forecasts, By Type(2020-2032) (USD Billion)
10.6.7.2 Argentina Variable Air Volume (VAV) Systems Market Estimates and Forecasts, By End-use Vertical (2020-2032) (USD Billion)
10.6.7.3 Argentina Variable Air Volume (VAV) Systems Market Estimates and Forecasts, By Application (2020-2032) (USD Billion)
10.6.8 Colombia
10.6.8.1 Colombia Variable Air Volume (VAV) Systems Market Estimates and Forecasts, By Type(2020-2032) (USD Billion)
10.6.8.2 Colombia Variable Air Volume (VAV) Systems Market Estimates and Forecasts, By End-use Vertical (2020-2032) (USD Billion)
10.6.8.3 Colombia Variable Air Volume (VAV) Systems Market Estimates and Forecasts, By Application (2020-2032) (USD Billion)
10.6.9 Rest of Latin America
10.6.9.1 Rest of Latin America Variable Air Volume (VAV) Systems Market Estimates and Forecasts, By Type(2020-2032) (USD Billion)
10.6.9.2 Rest of Latin America Variable Air Volume (VAV) Systems Market Estimates and Forecasts, By End-use Vertical (2020-2032) (USD Billion)
10.6.9.3 Rest of Latin America Variable Air Volume (VAV) Systems Market Estimates and Forecasts, By Application (2020-2032) (USD Billion)
11. Company Profiles
11.1 Honeywell International Inc.
11.1.1 Company Overview
11.1.2 Financial
11.1.3 Products/ Services Offered
11.1.4 SWOT Analysis
11.2 Carrier Corporation
11.2.1 Company Overview
11.2.2 Financial
11.2.3 Products/ Services Offered
11.2.4 SWOT Analysis
11.3 Johnson Controls
11.3.1 Company Overview
11.3.2 Financial
11.3.3 Products/ Services Offered
11.3.4 SWOT Analysis
11.4 Warren Technologies
11.4.1 Company Overview
11.4.2 Financial
11.4.3 Products/ Services Offered
11.4.4 SWOT Analysis
11.5 Emerson Electric Co.
11.5.1 Company Overview
11.5.2 Financial
11.5.3 Products/ Services Offered
11.5.4 SWOT Analysis
11.6 Siemens
11.6.1 Company Overview
11.6.2 Financial
11.6.3 Products/ Services Offered
11.6.4 SWOT Analysis
11.7 TROX GmbH
11.7.1 Company Overview
11.7.2 Financial
11.7.3 Products/ Services Offered
11.7.4 SWOT Analysis
11.8 Swegon Group AB
11.8.1 Company Overview
11.8.2 Financial
11.8.3 Products/ Services Offered
11.8.4 SWOT Analysis
11.9 Triton Process Automation Pvt. Ltd.
11.9.1 Company Overview
11.9.2 Financial
11.9.3 Products/ Services Offered
11.9.4 SWOT Analysis
11.10 Trane
11.10.1 Company Overview
11.10.2 Financial
11.10.3 Products/ Services Offered
11.10.4 SWOT Analysis
12. Use Cases and Best Practices
13. Conclusion
An accurate research report requires proper strategizing as well as implementation. There are multiple factors involved in the completion of good and accurate research report and selecting the best methodology to compete the research is the toughest part. Since the research reports we provide play a crucial role in any company’s decision-making process, therefore we at SNS Insider always believe that we should choose the best method which gives us results closer to reality. This allows us to reach at a stage wherein we can provide our clients best and accurate investment to output ratio.
Each report that we prepare takes a timeframe of 350-400 business hours for production. Starting from the selection of titles through a couple of in-depth brain storming session to the final QC process before uploading our titles on our website we dedicate around 350 working hours. The titles are selected based on their current market cap and the foreseen CAGR and growth.
The 5 steps process:
Step 1: Secondary Research:
Secondary Research or Desk Research is as the name suggests is a research process wherein, we collect data through the readily available information. In this process we use various paid and unpaid databases which our team has access to and gather data through the same. This includes examining of listed companies’ annual reports, Journals, SEC filling etc. Apart from this our team has access to various associations across the globe across different industries. Lastly, we have exchange relationships with various university as well as individual libraries.
Step 2: Primary Research
When we talk about primary research, it is a type of study in which the researchers collect relevant data samples directly, rather than relying on previously collected data. This type of research is focused on gaining content specific facts that can be sued to solve specific problems. Since the collected data is fresh and first hand therefore it makes the study more accurate and genuine.
We at SNS Insider have divided Primary Research into 2 parts.
Part 1 wherein we interview the KOLs of major players as well as the upcoming ones across various geographic regions. This allows us to have their view over the market scenario and acts as an important tool to come closer to the accurate market numbers. As many as 45 paid and unpaid primary interviews are taken from both the demand and supply side of the industry to make sure we land at an accurate judgement and analysis of the market.
This step involves the triangulation of data wherein our team analyses the interview transcripts, online survey responses and observation of on filed participants. The below mentioned chart should give a better understanding of the part 1 of the primary interview.
Part 2: In this part of primary research the data collected via secondary research and the part 1 of the primary research is validated with the interviews from individual consultants and subject matter experts.
Consultants are those set of people who have at least 12 years of experience and expertise within the industry whereas Subject Matter Experts are those with at least 15 years of experience behind their back within the same space. The data with the help of two main processes i.e., FGDs (Focused Group Discussions) and IDs (Individual Discussions). This gives us a 3rd party nonbiased primary view of the market scenario making it a more dependable one while collation of the data pointers.
Step 3: Data Bank Validation
Once all the information is collected via primary and secondary sources, we run that information for data validation. At our intelligence centre our research heads track a lot of information related to the market which includes the quarterly reports, the daily stock prices, and other relevant information. Our data bank server gets updated every fortnight and that is how the information which we collected using our primary and secondary information is revalidated in real time.
Step 4: QA/QC Process
After all the data collection and validation our team does a final level of quality check and quality assurance to get rid of any unwanted or undesired mistakes. This might include but not limited to getting rid of the any typos, duplication of numbers or missing of any important information. The people involved in this process include technical content writers, research heads and graphics people. Once this process is completed the title gets uploader on our platform for our clients to read it.
Step 5: Final QC/QA Process:
This is the last process and comes when the client has ordered the study. In this process a final QA/QC is done before the study is emailed to the client. Since we believe in giving our clients a good experience of our research studies, therefore, to make sure that we do not lack at our end in any way humanly possible we do a final round of quality check and then dispatch the study to the client.
Key Segmentation
By Type
Single Duct VAV Systems
Dual Duct VAV Systems
Induction Powered VAV Systems
By End-use Vertical
Residential
Industrial
Commercial
Others
By Application
Air Filter
Heating & Cooling Coil
Fan (Inlet & Outlet)
Diffuser
Damper & Air Handler
Radiator
Thermostat
Others (Sensors & Inductors)
Request for Segment Customization as per your Business Requirement: Segment Customization Request
Regional Coverage:
North America
US
Canada
Mexico
Europe
Eastern Europe
Poland
Romania
Hungary
Turkey
Rest of Eastern Europe
Western Europe
Germany
France
UK
Italy
Spain
Netherlands
Switzerland
Austria
Rest of Western Europe
Asia Pacific
China
India
Japan
South Korea
Vietnam
Singapore
Australia
Rest of Asia Pacific
Middle East & Africa
Middle East
UAE
Egypt
Saudi Arabia
Qatar
Rest of Middle East
Africa
Nigeria
South Africa
Rest of Africa
Latin America
Brazil
Argentina
Colombia
Rest of Latin America
Request for Country Level Research Report: Country Level Customization Request
Available Customization
With the given market data, SNS Insider offers customization as per the company’s specific needs. The following customization options are available for the report:
Detailed Volume Analysis
Criss-Cross segment analysis (e.g. Product X Application)
Competitive Product Benchmarking
Geographic Analysis
Additional countries in any of the regions
Customized Data Representation
Detailed analysis and profiling of additional market players
The Wearable Robotic Exoskeleton Market Size was valued at $0.68 Billion in 2023 & will Reach $9.58 Bn by 2031, displaying a CAGR of 39.2% by 2024-2031.
The Construction and Demolition Waste Management Market size was estimated at USD 162.02 Billion in 2023 and is expected to reach USD 261.20 Billion by 2032 at a CAGR of 5.50% during the forecast period of 2024-2032.
The Drill Bit Market Size was USD 2.28 billion in 2023 and is supposed to arrive at USD 4.12 billion by 2032 and develop at a CAGR of 6.81% by 2024-2032.
The Ozone Generator Market size was valued at USD 1.26 Billion in 2023 and is expected to grow at USD 2.27 Billion By 2032 with a growing CAGR of 6.8% over the forecast period of 2024-2032.
The Hydraulic Equipment Market Size was valued at USD 49.34 Billion in 2023 and is now anticipated to grow to USD 114.4 Billion by 2032, displaying a compound annual growth rate (CAGR) of 9.8% during the forecast Period 2024-2032.
The Battery Recycling Market was valued at USD 25.51 billion in 2023 and is expected to reach USD 59.23 billion by 2032, at a CAGR of 9.81% from 2024-2032.
Hi! Click one of our member below to chat on Phone