image

Vapor Recovery Units Market Report Scope & Overview:

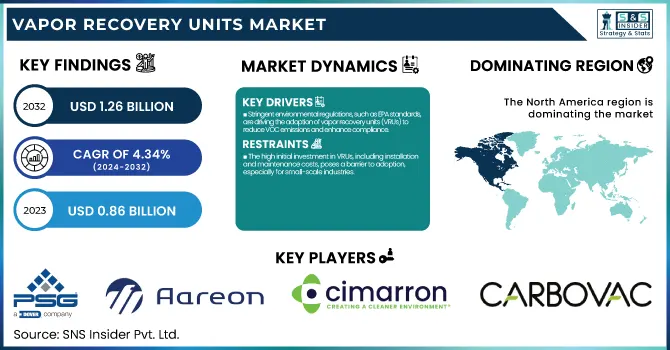
The Vapor Recovery Units Market Size was esteemed at USD 0.86 billion in 2023 and is supposed to arrive at USD 1.26 billion by 2032 with a growing CAGR of 4.34% over the forecast period 2024-2032. The report provides a unique perspective on the Vapor Recovery Units (VRU) market by analyzing production output trends and regional utilization rates, revealing operational efficiency insights. It examines maintenance and downtime metrics, highlighting system reliability and cost implications. Additionally, the report tracks technological adoption rates across regions, showcasing the shift toward advanced recovery solutions. Export/import data offers a trade flow assessment, while an emerging focus on carbon capture integration in VRUs and automation-driven optimization adds depth to industry advancements.

MARKET DYNAMICS

Drivers

  • Stringent environmental regulations, such as EPA standards, are driving the adoption of vapor recovery units (VRUs) to reduce VOC emissions and enhance compliance. 

Governments worldwide enforce stringent environmental regulations to curb air pollution and reduce volatile organic compound (VOC) emissions, significantly driving the demand for vapor recovery units (VRUs). Regulatory authorities like the U.S. Environmental Protection Agency (EPA) have defined specific guidelines for emissions, which force industries, particularly oil & gas, chemicals, and petrochemicals, to utilize VRUs for capturing vapors and recover before releasing them into the atmosphere. Other industrialized nations, in addition to the European Union, have similar regulations that burden companies to comply or be subject to fines, motivating investments in vapor recovery technologies. These rules not only reduce environmental pollution but also encourage sustainable industrial practices with increasing concerns about climate change and air quality, governments are likely to bring in stricter emission norms, which will further accelerate the adoption of VRUs across the industries. Adhering to these regulations streamlines operations and improves corporate sustainability efforts.

Restraint

  • The high initial investment in VRUs, including installation and maintenance costs, poses a barrier to adoption, especially for small-scale industries.

The adoption of Vapor Recovery Units (VRUs) is often hindered by high initial investment costs, which include expenses related to equipment, installation, and integration with existing infrastructure. These costs can represent a substantial barrier for small-scale industries and independent operators, though — and so, relatively lower-cost alternative solutions, such as flaring, find appeal despite their environmental impacts. These also lead to long-term operational costs, as VRUs need to be frequently maintained. Not only do companies have to invest in personnel and systems for improving the bottom line and meeting regulations, but they also require skilled personnel and advanced monitoring systems, which will further eat into their costs. With VRUs generating long-term savings through the reclamation of valuable hydrocarbons as well as minimized emissions penalties, the large capital outlay often poses a barrier to entry for cash-strapped companies. This is especially tough in emerging markets for sectors with scarce financial capacity and limited state support for emission mitigation technologies. Manufacturers and policymakers will need to identify affordable VRU systems, explore leasing options, and discuss financial incentives with SMEs to drive uptake.

Opportunities

  • Technological advancements in VRUs, including automation, IoT integration, and real-time monitoring, enhance efficiency, reduce emissions, and optimize operations.

Technological advancements in Vapor Recovery Units (VRUs) are significantly enhancing their efficiency and driving market adoption. Innovations such as enhanced automation, Internet of Things (IoT) integration, and real-time monitoring systems allow for precise control and optimization of vapor recovery processes.  Predictive Maintenance using advanced sensors and data analyticsImproved efficiency through predictive maintenance allows for substantially lower operational costs and downtime. Advances in vapor capture efficiency also reduce hydrocarbon losses and environmental footprint, improving both compression and absorption technologies. The smart nature of control systems allows these fleets to be monitored remotely to comply with stringent emission regulations while streamlining operations. Real-time parameter optimization using AI-powered analytics further enhances performance. All these developments make VRUs more efficient, cheaper, and simpler to work with, which results in oil & gas, petrochemicals, and storage terminal industries gradually switching to them. The role of VRUs in making the oceans cleaner as technology improves and continues to automate and make them more efficient will also help keep the environmental balance in check and at the same time reduce operational costs.

Challenges

  • Retrofitting VRUs into older industrial setups is costly and complex due to compatibility issues, space constraints, and operational disruptions.

Integrating vapor recovery units (VRUs) into existing industrial infrastructure presents significant challenges, particularly in older facilities that were not originally designed for such systems. If a retrofitted plant is to be considered, this can be technically complex and expensive, as it usually involves extensive modifications involving new piping, controls, and emissions monitor equipment. The difficulties of installation are compounded by compatibility issues with legacy equipment, space constraints, and a requirement for bespoke engineering solutions. Moreover, time spent during the retrofitting can break the operations causing potential revenue loss. System efficiency is not the only thing that companies must also consider as they adhere to the updated environmental regulations, too. The initial high capital required for the retrofitting and possible disruptions to normal operations often keep industries away from adopting the VRUs in cost-sensitive markets. Nevertheless, increasing modularization of the VRU designs and automation are alleviating the concerns for the retrofitting making it achievable, and promoting more adoption in the oil & gas, chemicals, and fuel storage terminals, among others.

SEGMENTATION ANALYSIS

By Application

The transportation segment dominated with a market share of over 42% in 2023, Substantial VOC emissions occur during fuel and petrochemical loading, unloading, and transit, leading to stricter environmental standards around the globe. The Environmental Protection Agency has identified global fuel transportation practices where VRUs have made strides in compliance with emission control regulations in places where energy demand and trade are at an all-time high. Furthermore, regulations such as those imposed by the U.S. Environmental Protection Agency (EPA) and the European Environment Agency (EEA) set strict limits, thus propelling market growth. The combination of the use of advanced VRU technologies facilitates the enhancement of efficiency, thus propelling their penetration in the field of pipelines, marine vessels, and tanker trucks for transportation the leading and fastest-expanding application in this market.

By End-use industry

The Oil & Gas segment dominated with a market share of over 62% in 2023, owing to strict environmental regulations regarding the emission of volatile organic compounds (VOC) and greenhouse gases (GHG). Regulatory authorities require emission control measures from sources, which can be established through the widespread use of vapor recovery systems. These units are widely used around upstream, midstream, and downstream to extract recoverable hydrocarbons, increase operational efficiency, and reduce the environmental impact. Furthermore, the oil & gas industry will continue its dominance as the major end-use industry for vapor recovery technologies, supported by the rising emphasis on sustainability, cost savings, as well as the growing need to comply with stringent emission standards.

REGIONAL ANALYSIS

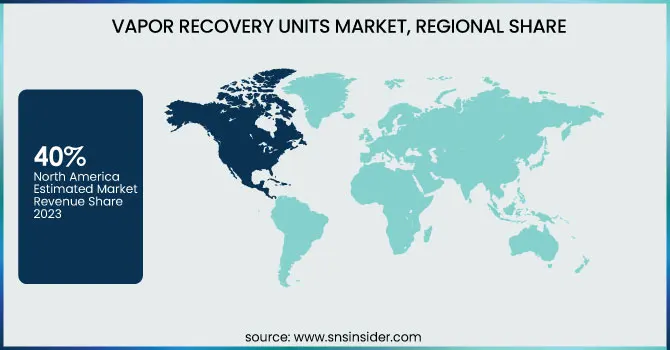
North America region dominated with a market share of over 40% in 2023, primarily due to stringent environmental regulations imposed by agencies like the Environmental Protection Agency (EPA), which mandate strict emission control measures. The region has a very strong oil & gas sector, especially Exploration and Production activities, mainly in the United States and Canada. Increasing concern regarding volatile organic compound (VOC) emissions and the need for adherence to air quality standards has led to faster adoption of vapor recovery units (VRU). Furthermore, improvements in technologies in emission abatement and the adoption of supportive government policies help the market grow. North America holds the leading position in this sector due to the presence of several leading VRU manufacturers and the growing investments in the energy industry.

Asia-Pacific is the fastest-growing region in the vapor recovery units market, due to high industrialization and urbanization rates. Countries such as China and India are ramping up energy consumption owing to growing manufacturing, transportation, and petrochemicals sectors. To limit emissions, the governments in the region have started implementing stricter environmental regulations, which is increasing the adoption of vapor recovery technologies. Furthermore, the increasing focus on sustainability along with corporate efforts to lower their carbon footprints are driving industries actively seeking solutions to control emissions. Demand for oil & gas infrastructure and vapor recovery technology is boosting the market and is likely to drive it even further due to rising investments in the sector. One way the region is expected to contribute to the vapor recovery unit expansion is due to the growing demand for energy-efficient and strict environmental enforcement in Asia-Pacific.

Key players

  • PSG Dover (Blackmer Vapor Recovery Systems)

  • Aareon (Vapor Recovery Solutions)

  • Cimarron Energy, Inc. (VRUs for Oil & Gas Applications)

  • John Zink Company (Flare Gas & Vapor Recovery Systems)

  • Carbovac (Oil & Gas Vapor Recovery Units)

  • SYMEX Technologies (Industrial Vapor Recovery Solutions)

  • VOCZero (Carbon-Based Vapor Recovery Systems)

  • Flogistix (FX Series Vapor Recovery Units)

  • Kappa Gi (Petroleum & Chemical Vapor Recovery)

  • Kilburn Engineering Ltd. (Customized Vapor Recovery Units)

  • BORSIG Membrane Technology GmbH (Membrane-Based VRUs)

  • Petrogas Systems (Compression-Based Vapor Recovery Systems)

  • Hy-Bon/EDI (A Cimarron Company) (Gas Compression & VRUs)

  • Parker Hannifin Corporation (Filtration-Based Vapor Recovery Solutions)

  • Cool Sorption A/S (Fuel & Petrochemical VRUs)

  • KVT Process Technology (Absorption & Adsorption VRUs)

  • Whirlwind Methane Recovery Systems (Low Emission VRUs)

  • Zeeco, Inc. (Fired & Non-Fired Vapor Recovery Units)

  • AEREON (A Cimarron Company) (Carbon Bed & Membrane VRUs)

  • Praxair Technology, Inc. (Cryogenic Vapor Recovery Systems)

Suppliers for (Advanced VRU systems for oil & gas, emissions control, and flare gas recovery) on Vapor Recovery Units Market

  • John Zink Hamworthy Combustion

  • Petrogas Systems

  • AEREON

  • PSG Dover

  • Whirlwind Methane Recovery Systems

  • VOCZero Ltd.

  • Flogistix LP

  • Cool Sorption A/S

  • Hy-Bon/EDI

  • Kappa Gi

RECENT DEVELOPMENT

In October 2023: Flogistix, a leading provider of vapor recovery and methane reduction solutions, announced its participation in the Abu Dhabi International Petroleum Exhibition and Conference (ADIPEC).

In March 2024: Audubon Engineering Company unveiled its patented Vapor Upcycle System (VUS), engineered to capture hazardous air pollutants and convert them into energy, aligning with the EPA’s updated National Emission Standards for Hazardous Air Pollutants (NESHAP).

Vapor Recovery Units Market Report Scope

Report Attributes Details
Market Size in 2023 USD 0.86 Billion
Market Size by 2032 USD 1.26 Billion
CAGR CAGR of 4.34%  From 2024 to 2032
Base Year 2023
Forecast Period 2024-2032
Historical Data 2020-2022
Report Scope & Coverage Market Size, Segments Analysis, Competitive  Landscape, Regional Analysis, DROC & SWOT Analysis, Forecast Outlook
Key Segments • By Application (Processing, Storage, Transportation)
• By End-use Industry (Oil & Gas, Others)
Regional Analysis/Coverage North America (US, Canada, Mexico), Europe (Eastern Europe [Poland, Romania, Hungary, Turkey, Rest of Eastern Europe] Western Europe] Germany, France, UK, Italy, Spain, Netherlands, Switzerland, Austria, Rest of Western Europe]), Asia Pacific (China, India, Japan, South Korea, Vietnam, Singapore, Australia, Rest of Asia Pacific), Middle East & Africa (Middle East [UAE, Egypt, Saudi Arabia, Qatar, Rest of Middle East], Africa [Nigeria, South Africa, Rest of Africa], Latin America (Brazil, Argentina, Colombia, Rest of Latin America)
Company Profiles PSG Dover, Aareon, Cimarron Energy, Inc., John Zink Company, Carbovac, SYMEX Technologies, VOCZero, Flogistix, Kappa Gi, Kilburn Engineering Ltd., BORSIG Membrane Technology GmbH, Petrogas Systems, Hy-Bon/EDI, Parker Hannifin Corporation, Cool Sorption A/S, KVT Process Technology, Whirlwind Methane Recovery Systems, Zeeco, Inc., AEREON, Praxair Technology, Inc.

Frequently Asked Questions

Ans:  The Vapor Recovery Units Market is expected to grow at a CAGR of 4.34% during 2024-2032.

Ans: The Vapor Recovery Units Market was USD 0.86 billion in 2023 and is expected to Reach USD 1.26 billion by 2032.

Ans: Stringent environmental regulations, such as EPA standards, are driving the adoption of vapor recovery units (VRUs) to reduce VOC emissions and enhance compliance.

Ans: The “transportation” segment dominated the Vapor Recovery Units Market.

Ans: North America dominated the Vapor Recovery Units Market in 2023

Table of Content

1. Introduction

1.1 Market Definition

1.2 Scope (Inclusion and Exclusions)

1.3 Research Assumptions

2. Executive Summary

2.1 Market Overview

2.2 Regional Synopsis

2.3 Competitive Summary

3. Research Methodology

3.1 Top-Down Approach

3.2 Bottom-up Approach

3.3. Data Validation

3.4 Primary Interviews

4. Market Dynamics Impact Analysis

4.1 Market Driving Factors Analysis

4.1.2 Drivers

4.1.2 Restraints

4.1.3 Opportunities

4.1.4 Challenges

4.2 PESTLE Analysis

4.3 Porter’s Five Forces Model

5. Statistical Insights and Trends Reporting

5.1 Market Production Output, by Region (2020-2023)

5.2 Utilization Rates of Vapor Recovery Units, by Region (2020-2023)

5.3 Maintenance and Downtime Metrics in Vapor Recovery Systems

5.4 Technological Adoption Rates of Vapor Recovery Units, by Region

5.5 Export/Import Data of Vapor Recovery Units, by Region (2023)

6. Competitive Landscape

6.1 List of Major Companies, By Region

6.2 Market Share Analysis, By Region

6.3 Product Benchmarking

6.3.1 Product specifications and features

6.3.2 Pricing

6.4 Strategic Initiatives

6.4.1 Marketing and promotional activities

6.4.2 Distribution and Supply Chain Strategies

6.4.3 Expansion plans and new product launches

6.4.4 Strategic partnerships and collaborations

6.5 Technological Advancements

6.6 Market Positioning and Branding

7. Vapor Recovery Units Market Segmentation, By Application

7.1 Chapter Overview

7.2 Processing

7.2.1 Processing Market Trends Analysis (2020-2032)

7.2.2 Processing Market Size Estimates and Forecasts to 2032 (USD Billion)

7.3 Storage

7.3.1 Storage Market Trends Analysis (2020-2032)

7.3.2 Storage Market Size Estimates and Forecasts to 2032 (USD Billion)

7.4 Transportation

7.3.1 Transportation Market Trends Analysis (2020-2032)

7.3.2 Transportation Market Size Estimates and Forecasts to 2032 (USD Billion)

8. Vapor Recovery Units Market Segmentation, By End-use Industry

8.1 Chapter Overview

8.2 Oil & gas

8.2.1 Power Generation Market Trends Analysis (2020-2032)

8.2.2 Power Generation Market Size Estimates and Forecasts to 2032 (USD Billion)

8.3 Others

8.3.1 Others Market Trends Analysis (2020-2032)

8.3.2 Others Market Size Estimates and Forecasts to 2032 (USD Billion)

9. Regional Analysis

9.1 Chapter Overview

9.2 North America

9.2.1 Trends Analysis

9.2.2 North America Vapor Recovery Units Market Estimates and Forecasts, by Country (2020-2032) (USD Billion)

9.2.3 North America Vapor Recovery Units Market Estimates and Forecasts, by Application (2020-2032) (USD Billion) 

9.2.4 North America Vapor Recovery Units Market Estimates and Forecasts, by End-use Industry (2020-2032) (USD Billion)

9.2.5 USA

9.2.5.1 USA Vapor Recovery Units Market Estimates and Forecasts, by Application (2020-2032) (USD Billion)

9.2.5.2 USA Vapor Recovery Units Market Estimates and Forecasts, by End-use Industry (2020-2032) (USD Billion)

9.2.6 Canada

9.2.6.1 Canada Vapor Recovery Units Market Estimates and Forecasts, by Application (2020-2032) (USD Billion)

9.2.6.2 Canada Vapor Recovery Units Market Estimates and Forecasts, by End-use Industry (2020-2032) (USD Billion)

9.2.7 Mexico

9.2.7.1 Mexico Vapor Recovery Units Market Estimates and Forecasts, by Application (2020-2032) (USD Billion)

9.2.7.2 Mexico Vapor Recovery Units Market Estimates and Forecasts, by End-use Industry (2020-2032) (USD Billion)

9.3 Europe

9.3.1 Eastern Europe

9.3.1.1 Trends Analysis

9.3.1.2 Eastern Europe Vapor Recovery Units Market Estimates and Forecasts, by Country (2020-2032) (USD Billion)

9.3.1.3 Eastern Europe Vapor Recovery Units Market Estimates and Forecasts, by Application (2020-2032) (USD Billion) 

9.3.1.4 Eastern Europe Vapor Recovery Units Market Estimates and Forecasts, by End-use Industry (2020-2032) (USD Billion)

9.3.1.5 Poland

9.3.1.5.1 Poland Vapor Recovery Units Market Estimates and Forecasts, by Application (2020-2032) (USD Billion)

9.3.1.5.2 Poland Vapor Recovery Units Market Estimates and Forecasts, by End-use Industry (2020-2032) (USD Billion)

9.3.1.6 Romania

9.3.1.6.1 Romania Vapor Recovery Units Market Estimates and Forecasts, by Application (2020-2032) (USD Billion)

9.3.1.6.2 Romania Vapor Recovery Units Market Estimates and Forecasts, by End-use Industry (2020-2032) (USD Billion)

9.3.1.7 Hungary

9.3.1.7.1 Hungary Vapor Recovery Units Market Estimates and Forecasts, by Application (2020-2032) (USD Billion)

9.3.1.7.2 Hungary Vapor Recovery Units Market Estimates and Forecasts, by End-use Industry (2020-2032) (USD Billion)

9.3.1.8 Turkey

9.3.1.8.1 Turkey Vapor Recovery Units Market Estimates and Forecasts, by Application (2020-2032) (USD Billion)

9.3.1.8.2 Turkey Vapor Recovery Units Market Estimates and Forecasts, by End-use Industry (2020-2032) (USD Billion)

9.3.1.9 Rest of Eastern Europe

9.3.1.9.1 Rest of Eastern Europe Vapor Recovery Units Market Estimates and Forecasts, by Application (2020-2032) (USD Billion)

9.3.1.9.2 Rest of Eastern Europe Vapor Recovery Units Market Estimates and Forecasts, by End-use Industry (2020-2032) (USD Billion)

9.3.2 Western Europe

9.3.2.1 Trends Analysis

9.3.2.2 Western Europe Vapor Recovery Units Market Estimates and Forecasts, by Country (2020-2032) (USD Billion)

9.3.2.3 Western Europe Vapor Recovery Units Market Estimates and Forecasts, by Application (2020-2032) (USD Billion) 

9.3.2.4 Western Europe Vapor Recovery Units Market Estimates and Forecasts, by End-use Industry (2020-2032) (USD Billion)

9.3.2.5 Germany

9.3.2.5.1 Germany Vapor Recovery Units Market Estimates and Forecasts, by Application (2020-2032) (USD Billion)

9.3.2.5.2 Germany Vapor Recovery Units Market Estimates and Forecasts, by End-use Industry (2020-2032) (USD Billion)

9.3.2.6 France

9.3.2.6.1 France Vapor Recovery Units Market Estimates and Forecasts, by Application (2020-2032) (USD Billion)

9.3.2.6.2 France Vapor Recovery Units Market Estimates and Forecasts, by End-use Industry (2020-2032) (USD Billion)

9.3.2.7 UK

9.3.2.7.1 UK Vapor Recovery Units Market Estimates and Forecasts, by Application (2020-2032) (USD Billion)

9.3.2.7.2 UK Vapor Recovery Units Market Estimates and Forecasts, by End-use Industry (2020-2032) (USD Billion)

9.3.2.8 Italy

9.3.2.8.1 Italy Vapor Recovery Units Market Estimates and Forecasts, by Application (2020-2032) (USD Billion)

9.3.2.8.2 Italy Vapor Recovery Units Market Estimates and Forecasts, by End-use Industry (2020-2032) (USD Billion)

9.3.2.9 Spain

9.3.2.9.1 Spain Vapor Recovery Units Market Estimates and Forecasts, by Application (2020-2032) (USD Billion)

9.3.2.9.2 Spain Vapor Recovery Units Market Estimates and Forecasts, by End-use Industry (2020-2032) (USD Billion)

9.3.2.10 Netherlands

9.3.2.10.1 Netherlands Vapor Recovery Units Market Estimates and Forecasts, by Application (2020-2032) (USD Billion)

9.3.2.10.2 Netherlands Vapor Recovery Units Market Estimates and Forecasts, by End-use Industry (2020-2032) (USD Billion)

9.3.2.11 Switzerland

9.3.2.11.1 Switzerland Vapor Recovery Units Market Estimates and Forecasts, by Application (2020-2032) (USD Billion)

9.3.2.11.2 Switzerland Vapor Recovery Units Market Estimates and Forecasts, by End-use Industry (2020-2032) (USD Billion)

9.3.2.12 Austria

9.3.2.12.1 Austria Vapor Recovery Units Market Estimates and Forecasts, by Application (2020-2032) (USD Billion)

9.3.2.12.2 Austria Vapor Recovery Units Market Estimates and Forecasts, by End-use Industry (2020-2032) (USD Billion)

9.3.2.13 Rest of Western Europe

9.3.2.13.1 Rest of Western Europe Vapor Recovery Units Market Estimates and Forecasts, by Application (2020-2032) (USD Billion)

9.3.2.13.2 Rest of Western Europe Vapor Recovery Units Market Estimates and Forecasts, by End-use Industry (2020-2032) (USD Billion)

9.4 Asia Pacific

9.4.1 Trends Analysis

9.4.2 Asia Pacific Vapor Recovery Units Market Estimates and Forecasts, by Country (2020-2032) (USD Billion)

9.4.3 Asia Pacific Vapor Recovery Units Market Estimates and Forecasts, by Application (2020-2032) (USD Billion) 

9.4.4 Asia Pacific Vapor Recovery Units Market Estimates and Forecasts, by End-use Industry (2020-2032) (USD Billion)

9.4.5 China

9.4.5.1 China Vapor Recovery Units Market Estimates and Forecasts, by Application (2020-2032) (USD Billion)

9.4.5.2 China Vapor Recovery Units Market Estimates and Forecasts, by End-use Industry (2020-2032) (USD Billion)

9.4.6 India

9.4.5.1 India Vapor Recovery Units Market Estimates and Forecasts, by Application (2020-2032) (USD Billion)

9.4.5.2 India Vapor Recovery Units Market Estimates and Forecasts, by End-use Industry (2020-2032) (USD Billion)

9.4.5 Japan

9.4.5.1 Japan Vapor Recovery Units Market Estimates and Forecasts, by Application (2020-2032) (USD Billion)

9.4.5.2 Japan Vapor Recovery Units Market Estimates and Forecasts, by End-use Industry (2020-2032) (USD Billion)

9.4.6 South Korea

9.4.6.1 South Korea Vapor Recovery Units Market Estimates and Forecasts, by Application (2020-2032) (USD Billion)

9.4.6.2 South Korea Vapor Recovery Units Market Estimates and Forecasts, by End-use Industry (2020-2032) (USD Billion)

9.4.7 Vietnam

9.4.7.1 Vietnam Vapor Recovery Units Market Estimates and Forecasts, by Application (2020-2032) (USD Billion)

9.2.7.2 Vietnam Vapor Recovery Units Market Estimates and Forecasts, by End-use Industry (2020-2032) (USD Billion)

9.4.8 Singapore

9.4.8.1 Singapore Vapor Recovery Units Market Estimates and Forecasts, by Application (2020-2032) (USD Billion)

9.4.8.2 Singapore Vapor Recovery Units Market Estimates and Forecasts, by End-use Industry (2020-2032) (USD Billion)

9.4.9 Australia

9.4.9.1 Australia Vapor Recovery Units Market Estimates and Forecasts, by Application (2020-2032) (USD Billion)

9.4.9.2 Australia Vapor Recovery Units Market Estimates and Forecasts, by End-use Industry (2020-2032) (USD Billion)

9.4.10 Rest of Asia Pacific

9.4.10.1 Rest of Asia Pacific Vapor Recovery Units Market Estimates and Forecasts, by Application (2020-2032) (USD Billion)

9.4.10.2 Rest of Asia Pacific Vapor Recovery Units Market Estimates and Forecasts, by End-use Industry (2020-2032) (USD Billion)

9.5 Middle East and Africa

9.5.1 Middle East

9.5.1.1 Trends Analysis

9.5.1.2 Middle East Vapor Recovery Units Market Estimates and Forecasts, by Country (2020-2032) (USD Billion)

9.5.1.3 Middle East Vapor Recovery Units Market Estimates and Forecasts, by Application (2020-2032) (USD Billion) 

9.5.1.4 Middle East Vapor Recovery Units Market Estimates and Forecasts, by End-use Industry (2020-2032) (USD Billion)

9.5.1.5 UAE

9.5.1.5.1 UAE Vapor Recovery Units Market Estimates and Forecasts, by Application (2020-2032) (USD Billion)

9.5.1.5.2 UAE Vapor Recovery Units Market Estimates and Forecasts, by End-use Industry (2020-2032) (USD Billion)

9.5.1.6 Egypt

9.5.1.6.1 Egypt Vapor Recovery Units Market Estimates and Forecasts, by Application (2020-2032) (USD Billion)

9.5.1.6.2 Egypt Vapor Recovery Units Market Estimates and Forecasts, by End-use Industry (2020-2032) (USD Billion)

9.5.1.7 Saudi Arabia

9.5.1.7.1 Saudi Arabia Vapor Recovery Units Market Estimates and Forecasts, by Application (2020-2032) (USD Billion)

9.5.1.7.2 Saudi Arabia Vapor Recovery Units Market Estimates and Forecasts, by End-use Industry (2020-2032) (USD Billion)

9.5.1.8 Qatar

9.5.1.8.1 Qatar Vapor Recovery Units Market Estimates and Forecasts, by Application (2020-2032) (USD Billion)

9.5.1.8.2 Qatar Vapor Recovery Units Market Estimates and Forecasts, by End-use Industry (2020-2032) (USD Billion)

9.5.1.9 Rest of Middle East

9.5.1.9.1 Rest of Middle East Vapor Recovery Units Market Estimates and Forecasts, by Application (2020-2032) (USD Billion)

9.5.1.9.2 Rest of Middle East Vapor Recovery Units Market Estimates and Forecasts, by End-use Industry (2020-2032) (USD Billion)

9.5.2 Africa

9.5.2.1 Trends Analysis

9.5.2.2 Africa Vapor Recovery Units Market Estimates and Forecasts, by Country (2020-2032) (USD Billion)

9.5.2.3 Africa Vapor Recovery Units Market Estimates and Forecasts, by Application (2020-2032) (USD Billion) 

9.5.2.4 Africa Vapor Recovery Units Market Estimates and Forecasts, by End-use Industry (2020-2032) (USD Billion)

9.5.2.5 South Africa

9.5.2.5.1 South Africa Vapor Recovery Units Market Estimates and Forecasts, by Application (2020-2032) (USD Billion)

9.5.2.5.2 South Africa Vapor Recovery Units Market Estimates and Forecasts, by End-use Industry (2020-2032) (USD Billion)

9.5.2.6 Nigeria

9.5.2.6.1 Nigeria Vapor Recovery Units Market Estimates and Forecasts, by Application (2020-2032) (USD Billion)

9.5.2.6.2 Nigeria Vapor Recovery Units Market Estimates and Forecasts, by End-use Industry (2020-2032) (USD Billion)

9.5.2.7 Rest of Africa

9.5.2.7.1 Rest of Africa Vapor Recovery Units Market Estimates and Forecasts, by Application (2020-2032) (USD Billion)

9.5.2.7.2 Rest of Africa Vapor Recovery Units Market Estimates and Forecasts, by End-use Industry (2020-2032) (USD Billion)

9.6 Latin America

9.6.1 Trends Analysis

9.6.2 Latin America Vapor Recovery Units Market Estimates and Forecasts, by Country (2020-2032) (USD Billion)

9.6.3 Latin America Vapor Recovery Units Market Estimates and Forecasts, by Application (2020-2032) (USD Billion) 

9.6.4 Latin America Vapor Recovery Units Market Estimates and Forecasts, by End-use Industry (2020-2032) (USD Billion)

9.6.5 Brazil

9.6.5.1 Brazil Vapor Recovery Units Market Estimates and Forecasts, by Application (2020-2032) (USD Billion)

9.6.5.2 Brazil Vapor Recovery Units Market Estimates and Forecasts, by End-use Industry (2020-2032) (USD Billion)

9.6.6 Argentina

9.6.6.1 Argentina Vapor Recovery Units Market Estimates and Forecasts, by Application (2020-2032) (USD Billion)

9.6.6.2 Argentina Vapor Recovery Units Market Estimates and Forecasts, by End-use Industry (2020-2032) (USD Billion)

9.6.7 Colombia

9.6.7.1 Colombia Vapor Recovery Units Market Estimates and Forecasts, by Application (2020-2032) (USD Billion)

9.6.7.2 Colombia Vapor Recovery Units Market Estimates and Forecasts, by End-use Industry (2020-2032) (USD Billion)

9.6.8 Rest of Latin America

9.6.8.1 Rest of Latin America Vapor Recovery Units Market Estimates and Forecasts, by Application (2020-2032) (USD Billion)

9.6.8.2 Rest of Latin America Vapor Recovery Units Market Estimates and Forecasts, by End-use Industry (2020-2032) (USD Billion)

10. Company Profiles

10.1 PSG Dover

              10.1.1 Company Overview

10.1.2 Financial

10.1.3 Products/ Services Offered

110.1.4 SWOT Analysis

10.2 Aareon

10.2.1 Company Overview

10.2.2 Financial

10.2.3 Products/ Services Offered

10.2.4 SWOT Analysis

10.3 Cimarron Energy, Inc.

              10.3.1 Company Overview

10.3.2 Financial

10.3.3 Products/ Services Offered

10.3.4 SWOT Analysis

10.4 John Zink Company

10.4.1 Company Overview

10.4.2 Financial

10.4.3 Products/ Services Offered

10.4.4 SWOT Analysis

10.5 Carbovac

              10.5.1 Company Overview

10.5.2 Financial

10.5.3 Products/ Services Offered

10.5.4 SWOT Analysis

10.6 SYMEX Technologies

10.6.1 Company Overview

10.6.2 Financial

10.6.3 Products/ Services Offered

10.6.4 SWOT Analysis

10.7 VOCZero

              10.7.1 Company Overview

10.7.2 Financial

10.7.3 Products/ Services Offered

10.7.4 SWOT Analysis

10.8 Flogistix

              10.8.1 Company Overview

10.8.2 Financial

10.8.3 Products/ Services Offered

10.8.4 SWOT Analysis

10.9 Kappa Gi

10.9.1 Company Overview

10.9.2 Financial

10.9.3 Products/ Services Offered

10.9.4 SWOT Analysis

10.10 Kilburn Engineering Ltd.

             10.9.1 Company Overview

10.9.2 Financial

10.9.3 Products/ Services Offered

10.9.4 SWOT Analysis

11. Use Cases and Best Practices

12. Conclusion

An accurate research report requires proper strategizing as well as implementation. There are multiple factors involved in the completion of good and accurate research report and selecting the best methodology to compete the research is the toughest part. Since the research reports we provide play a crucial role in any company’s decision-making process, therefore we at SNS Insider always believe that we should choose the best method which gives us results closer to reality. This allows us to reach at a stage wherein we can provide our clients best and accurate investment to output ratio.

Each report that we prepare takes a timeframe of 350-400 business hours for production. Starting from the selection of titles through a couple of in-depth brain storming session to the final QC process before uploading our titles on our website we dedicate around 350 working hours. The titles are selected based on their current market cap and the foreseen CAGR and growth.


The 5 steps process:

Step 1: Secondary Research:

Secondary Research or Desk Research is as the name suggests is a research process wherein, we collect data through the readily available information. In this process we use various paid and unpaid databases which our team has access to and gather data through the same. This includes examining of listed companies’ annual reports, Journals, SEC filling etc. Apart from this our team has access to various associations across the globe across different industries. Lastly, we have exchange relationships with various university as well as individual libraries.

Secondary Research

Step 2: Primary Research

When we talk about primary research, it is a type of study in which the researchers collect relevant data samples directly, rather than relying on previously collected data.  This type of research is focused on gaining content specific facts that can be sued to solve specific problems. Since the collected data is fresh and first hand therefore it makes the study more accurate and genuine.

We at SNS Insider have divided Primary Research into 2 parts.

Part 1 wherein we interview the KOLs of major players as well as the upcoming ones across various geographic regions. This allows us to have their view over the market scenario and acts as an important tool to come closer to the accurate market numbers. As many as 45 paid and unpaid primary interviews are taken from both the demand and supply side of the industry to make sure we land at an accurate judgement and analysis of the market.

This step involves the triangulation of data wherein our team analyses the interview transcripts, online survey responses and observation of on filed participants. The below mentioned chart should give a better understanding of the part 1 of the primary interview.

Primary Research

Part 2: In this part of primary research the data collected via secondary research and the part 1 of the primary research is validated with the interviews from individual consultants and subject matter experts.

Consultants are those set of people who have at least 12 years of experience and expertise within the industry whereas Subject Matter Experts are those with at least 15 years of experience behind their back within the same space. The data with the help of two main processes i.e., FGDs (Focused Group Discussions) and IDs (Individual Discussions). This gives us a 3rd party nonbiased primary view of the market scenario making it a more dependable one while collation of the data pointers.

Step 3: Data Bank Validation

Once all the information is collected via primary and secondary sources, we run that information for data validation. At our intelligence centre our research heads track a lot of information related to the market which includes the quarterly reports, the daily stock prices, and other relevant information. Our data bank server gets updated every fortnight and that is how the information which we collected using our primary and secondary information is revalidated in real time.

Data Bank Validation

Step 4: QA/QC Process

After all the data collection and validation our team does a final level of quality check and quality assurance to get rid of any unwanted or undesired mistakes. This might include but not limited to getting rid of the any typos, duplication of numbers or missing of any important information. The people involved in this process include technical content writers, research heads and graphics people. Once this process is completed the title gets uploader on our platform for our clients to read it.

Step 5: Final QC/QA Process:

This is the last process and comes when the client has ordered the study. In this process a final QA/QC is done before the study is emailed to the client. Since we believe in giving our clients a good experience of our research studies, therefore, to make sure that we do not lack at our end in any way humanly possible we do a final round of quality check and then dispatch the study to the client.

Key Segments

By Application

  • Processing

  • Storage

  • Transportation

By End-use industry

  • Oil & gas

  • Others

Request for Segment Customization as per your Business Requirement: Segment Customization Request

Regional Coverage: 

North America 

  • US 

  • Canada 

  • Mexico 

Europe 

  • Eastern Europe 

  • Poland 

  • Romania 

  • Hungary 

  • Turkey 

  • Rest of Eastern Europe 

  • Western Europe 

  • Germany 

  • France 

  • UK 

  • Italy 

  • Spain 

  • Netherlands 

  • Switzerland 

  • Austria 

  • Rest of Western Europe 

Asia Pacific 

  • China 

  • India 

  • Japan 

  • South Korea 

  • Vietnam 

  • Singapore 

  • Australia 

  • Rest of Asia Pacific 

Middle East & Africa 

  • Middle East 

  • UAE 

  • Egypt 

  • Saudi Arabia 

  • Qatar 

  • Rest of Middle East 

  • Africa 

  • Nigeria 

  • South Africa 

  • Rest of Africa 

Latin America 

  • Brazil 

  • Argentina 

  • Colombia 

  • Rest of Latin America 

Request for Country Level Research Report: Country Level Customization Request

Available Customization 

With the given market data, SNS Insider offers customization as per the company’s specific needs. The following customization options are available for the report: 

  • Detailed Volume Analysis 

  • Criss-Cross segment analysis (e.g. Product X Application) 

  • Competitive Product Benchmarking 

  • Geographic Analysis 

  • Additional countries in any of the regions 

  • Customized Data Representation 

  • Detailed analysis and profiling of additional market players


  •            5000 (33% Discount)


  •            8950 (40% Discount)


  •            3050 (23% Discount)

Start a Conversation

Hi! Click one of our member below to chat on Phone