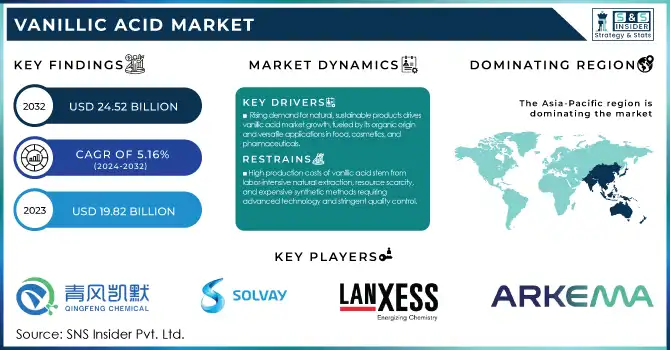
The Vanillic Acid Market size was valued at USD 19.82 billion in 2023 and is expected to grow to USD 24.52 billion by 2032 and grow at a CAGR of 2.39% over the forecast period of 2024-2032.
Get E-PDF Sample Report on Vanillic Acid Market - Request Sample Report
Vanillic acid, a naturally occurring compound found in vanilla beans and other plant sources, is gaining prominence across various industries due to its versatile properties. In the food and beverage sector, it serves as a flavoring agent, enhancing the taste of confectioneries, beverages, and baked goods. Its antioxidant, antimicrobial, and anti-inflammatory characteristics make it valuable in pharmaceutical applications, where it's utilized in formulations targeting cardiovascular, diabetic, and neurodegenerative conditions.
The market is witnessing a shift towards natural and organic products, driven by increasing health consciousness among consumers. This trend is propelling the demand for vanillic acid, especially in the flavor and fragrance industries, where it is favored for its natural origin and aromatic properties. Additionally, the cosmetic and personal care sectors are exploring vanillic acid for its potential benefits, aligning with the clean-label movement that emphasizes transparency and natural ingredients.
However, challenges such as limited natural sources and potential supply constraints may impact market dynamics. The extraction of vanillic acid from natural sources like vanilla beans yields relatively low quantities, which could lead to supply shortages and increased prices. Moreover, regulatory considerations regarding purity standards and usage in various applications necessitate compliance, influencing market operations. Despite these challenges, the vanillic acid market is poised for steady growth, supported by ongoing research and development efforts aimed at cost-effective production methods and expanding application scopes. The industry's focus on sustainability and natural product offerings is expected to further drive the adoption of vanillic acid across multiple sectors.
DRIVERS
The rising demand for natural ingredients is significantly influencing the vanillic acid market, as consumers increasingly prioritize health-conscious and sustainable choices. Vanillic acid, derived from natural sources like vanilla beans, aligns with this trend due to its organic origin and versatile properties. In the food and beverage industry, it is widely sought after as a natural flavor enhancer, replacing synthetic alternatives and catering to clean-label product demands. Similarly, its incorporation in cosmetics and personal care products highlights its role in meeting consumer expectations for transparency and eco-friendly formulations. In pharmaceuticals, vanillic acid's antioxidant and antimicrobial properties add further value, making it a preferred component in treatments targeting chronic conditions. As the global inclination toward organic and natural products intensifies, the market for vanillic acid is expected to expand, leveraging its multifaceted applications and ability to align with evolving consumer preferences.
RESTRAINT
High production costs of vanillic acid arise from the intricate processes involved in its extraction and synthesis. Naturally sourced vanillic acid, primarily derived from vanilla beans, requires labor-intensive harvesting and processing, yielding limited quantities. This scarcity elevates raw material expenses. Additionally, synthetic production methods, while offering a more scalable alternative, involve sophisticated chemical or biological processes that demand advanced technology and expertise. These methods often incur significant operational costs, including energy consumption, specialized equipment, and stringent quality control measures to meet industry standards.
The high costs impact the affordability of vanillic acid, limiting its application in price-sensitive industries such as mass-market food products. Companies may opt for cheaper synthetic substitutes, reducing the competitiveness of vanillic acid. Addressing these cost challenges requires innovation in production techniques, such as fermentation-based methods or engineered biosynthesis, to enhance yield efficiency and reduce expenses without compromising quality.
By Purity
The Purity 98% segment dominated with the market share over 55% in 2023. This dominance is due to the compound’s versatility and its extensive use across multiple industries, such as food and beverages, pharmaceuticals, and cosmetics. Its affordability and suitable quality make it an ideal choice for a wide range of applications, from flavoring agents to active ingredients in various products. The versatility of Purity 98% vanillic acid allows it to cater to the diverse needs of these industries, reinforcing its position as the market leader in the vanillic acid sector.
By Application
The flavors and fragrance segment dominated with the market share over 52% in 2023. This is largely due to the growing consumer preference for natural and eco-friendly products. Vanillic acid plays a crucial role as an aromatic ingredient in a wide range of fragrances and personal care items, including perfumes, essential oils, aromatic candles, and deodorants. Its pleasant, sweet scent makes it ideal for use in both organic and synthetic fragrance formulations. The increasing demand for skin-friendly, sustainable products further boosts vanillic acid's prominence in the flavors and fragrances sector.
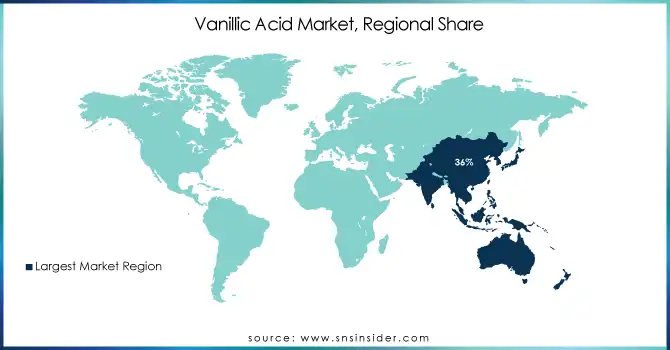
The Asia-Pacific region dominated with the market share over 36% in 2023. This dominance is primarily driven by the region's rapid industrialization and its growing demand across multiple sectors, including pharmaceuticals, food and beverages, and cosmetics. Major economies like China and India have experienced significant growth, leading to an increased demand for vanillic acid, a compound valued for its antioxidant properties and its use as a flavoring agent. The pharmaceutical industry relies on vanillic acid for its therapeutic benefits, while the food and beverage sector use it to enhance flavor. Additionally, the cosmetics industry has adopted vanillic acid for its sweet, vanilla-like fragrance and its skin-soothing properties.
Europe is emerging as the fastest-growing region in the vanillic acid market due to its diverse industrial applications. The pharmaceutical sector in Europe is expanding steadily, driving the demand for vanillic acid, which is utilized for its antioxidant and therapeutic properties. This growth is expected to continue over the forecast period, contributing to a higher market share for the region. Additionally, Europe is known for its flourishing fragrance and perfume industry, where vanillic acid plays a key role. Its sweet, vanilla-like scent makes it a valuable ingredient in perfume formulations, enhancing the appeal of fragrances.
Get Customized Report as Per Your Business Requirement - Request For Customized Report
Some of the major key players of the Vanillic Acid Market
Suppliers for (high-quality analytical and laboratory chemicals, with a focus on purity and reliable standards) on Vanillic Acid Market
In January 23, 2023: Solvay has launched the first ISCC PLUS certified mass balance vanillin. This innovation helps reduce carbon footprints and supports sustainability in the flavor and fragrance industries.
Report Attributes | Details |
Market Size in 2023 | USD 19.82 Billion |
Market Size by 2032 | USD 24.52 Billion |
CAGR | CAGR of 2.39% From 2024 to 2032 |
Base Year | 2023 |
Forecast Period | 2024-2032 |
Historical Data | 2020-2022 |
Report Scope & Coverage | Market Size, Segments Analysis, Competitive Landscape, Regional Analysis, DROC & SWOT Analysis, Forecast Outlook |
Key Segments | • By Purity (Purity 99%, Purity 98%, and Others) • By Application (Flavors and Fragrances, Pharmaceutical Intermediates, and Others) |
Regional Analysis/Coverage | North America (US, Canada, Mexico), Europe (Eastern Europe [Poland, Romania, Hungary, Turkey, Rest of Eastern Europe] Western Europe] Germany, France, UK, Italy, Spain, Netherlands, Switzerland, Austria, Rest of Western Europe]), Asia Pacific (China, India, Japan, South Korea, Vietnam, Singapore, Australia, Rest of Asia Pacific), Middle East & Africa (Middle East [UAE, Egypt, Saudi Arabia, Qatar, Rest of Middle East], Africa [Nigeria, South Africa, Rest of Africa], Latin America (Brazil, Argentina, Colombia, Rest of Latin America) |
Company Profiles | Quzhou Mingfeng Chemical, Solvay, Donglian Nankai FlavorDlflavor, The Good Scents Company, Parchem Fine & Specialty Chemicals, Otto Chemie Pvt. Ltd., Lanxess, Zhejiang NHU Co., Ltd., Guangzhou Shiny Co., Ltd., Henan Tianfu Chemical Co., Ltd., Sigma-Aldrich (Merck KGaA), TCI Chemicals, Alfa Aesar (Thermo Fisher Scientific), Beijing Lys Chemicals Co., Ltd., Arkema, Fujian Yuanli Active Carbon Co., Ltd., Jiangxi Global Natural Spice Co., Ltd., Haihang Industry Co., Ltd., Xiamen Hisunny Chemical Co., Ltd., Cayman Chemical. |
Key Drivers | • The rising demand for natural and sustainable products is driving the growth of the vanillic acid market, as its organic origin and versatile applications cater to evolving consumer preferences across food, cosmetics, and pharmaceuticals. |
RESTRAINTS | • High production costs of vanillic acid stem from labor-intensive natural extraction, resource scarcity, and expensive synthetic methods requiring advanced technology and stringent quality control. |
Ans: Asia-Pacific dominated the Vanillic Acid Market in 2023
Ans: The “Purity 98%” segment dominated the Vanillic Acid Market.
Ans: The rising demand for natural and sustainable products is driving the growth of the vanillic acid market, as its organic origin and versatile applications cater to evolving consumer preferences across food, cosmetics, and pharmaceuticals.
Ans: The Vanillic Acid Market was USD 19.82 billion in 2023 and is expected to Reach USD 24.52 billion by 2032.
Ans: The Vanillic Acid Market is expected to grow at a CAGR of 2.39% during 2024-2032.
Table of Content
1. Introduction
1.1 Market Definition
1.2 Scope (Inclusion and Exclusions)
1.3 Research Assumptions
2. Executive Summary
2.1 Market Overview
2.2 Regional Synopsis
2.3 Competitive Summary
3. Research Methodology
3.1 Top-Down Approach
3.2 Bottom-up Approach
3.3. Data Validation
3.4 Primary Interviews
4. Market Dynamics Impact Analysis
4.1 Market Driving Factors Analysis
4.1.2 Drivers
4.1.2 Restraints
4.1.3 Opportunities
4.1.4 Challenges
4.2 PESTLE Analysis
4.3 Porter’s Five Forces Model
5. Statistical Insights and Trends Reporting
5.1 Adoption Rate
5.2 Export/Import Data
5.3 Consumer Preferences
5.4 Environmental Impact Metrics
6. Competitive Landscape
6.1 List of Major Companies, By Region
6.2 Market Share Analysis, By Region
6.3 Product Benchmarking
6.3.1 Product specifications and features
6.3.2 Pricing
6.4 Strategic Initiatives
6.4.1 Marketing and promotional activities
6.4.2 Distribution and supply chain strategies
6.4.3 Expansion plans and new product launches
6.4.4 Strategic partnerships and collaborations
6.5 Technological Advancements
6.6 Market Positioning and Branding
7. Vanillic Acid Market Segmentation, By Purity
7.1 Chapter Overview
7.2 Purity 99%
7.2.1 Purity 99% Market Trends Analysis (2020-2032)
7.2.2 Purity 99% Market Size Estimates and Forecasts to 2032 (USD Billion)
7.3 Purity 98%
7.3.1 Purity 98% Market Trends Analysis (2020-2032)
7.3.2 Purity 98% Market Size Estimates and Forecasts to 2032 (USD Billion)
7.4 Others
7.4.1 Others Market Trends Analysis (2020-2032)
7.4.2 Others Market Size Estimates and Forecasts to 2032 (USD Billion)
8. Vanillic Acid Market Segmentation, By Application
8.1 Chapter Overview
8.2 Pharmaceutical Intermediates
8.2.1 Pharmaceutical Intermediates Market Trends Analysis (2020-2032)
8.2.2 Pharmaceutical Intermediates Market Size Estimates and Forecasts to 2032 (USD Billion)
8.3 Flavors and Fragrances
8.3.1 Flavors and Fragrances Market Trends Analysis (2020-2032)
8.3.2 Flavors and Fragrances Market Size Estimates and Forecasts to 2032 (USD Billion)
8.4 Other Applications
8.4.1 Other Applications Market Trends Analysis (2020-2032)
8.4.2 Other Applications Market Size Estimates and Forecasts to 2032 (USD Billion)
9. Regional Analysis
9.1 Chapter Overview
9.2 North America
9.2.1 Trends Analysis
9.2.2 North America Vanillic Acid Market Estimates and Forecasts, by Country (2020-2032) (USD Billion)
9.2.3 North America Vanillic Acid Market Estimates and Forecasts, By Purity (2020-2032) (USD Billion)
9.2.4 North America Vanillic Acid Market Estimates and Forecasts, By Application (2020-2032) (USD Billion)
9.2.5 USA
9.2.5.1 USA Vanillic Acid Market Estimates and Forecasts, By Purity (2020-2032) (USD Billion)
9.2.5.2 USA Vanillic Acid Market Estimates and Forecasts, By Application (2020-2032) (USD Billion)
9.2.6 Canada
9.2.6.1 Canada Vanillic Acid Market Estimates and Forecasts, By Purity (2020-2032) (USD Billion)
9.2.6.2 Canada Vanillic Acid Market Estimates and Forecasts, By Application (2020-2032) (USD Billion)
9.2.7 Mexico
9.2.7.1 Mexico Vanillic Acid Market Estimates and Forecasts, By Purity (2020-2032) (USD Billion)
9.2.7.2 Mexico Vanillic Acid Market Estimates and Forecasts, By Application (2020-2032) (USD Billion)
9.3 Europe
9.3.1 Eastern Europe
9.3.1.1 Trends Analysis
9.3.1.2 Eastern Europe Vanillic Acid Market Estimates and Forecasts, by Country (2020-2032) (USD Billion)
9.3.1.3 Eastern Europe Vanillic Acid Market Estimates and Forecasts, By Purity (2020-2032) (USD Billion)
9.3.1.4 Eastern Europe Vanillic Acid Market Estimates and Forecasts, By Application (2020-2032) (USD Billion)
9.3.1.5 Poland
9.3.1.5.1 Poland Vanillic Acid Market Estimates and Forecasts, By Purity (2020-2032) (USD Billion)
9.3.1.5.2 Poland Vanillic Acid Market Estimates and Forecasts, By Application (2020-2032) (USD Billion)
9.3.1.6 Romania
9.3.1.6.1 Romania Vanillic Acid Market Estimates and Forecasts, By Purity (2020-2032) (USD Billion)
9.3.1.6.2 Romania Vanillic Acid Market Estimates and Forecasts, By Application (2020-2032) (USD Billion)
9.3.1.7 Hungary
9.3.1.7.1 Hungary Vanillic Acid Market Estimates and Forecasts, By Purity (2020-2032) (USD Billion)
9.3.1.7.2 Hungary Vanillic Acid Market Estimates and Forecasts, By Application (2020-2032) (USD Billion)
9.3.1.8 Turkey
9.3.1.8.1 Turkey Vanillic Acid Market Estimates and Forecasts, By Purity (2020-2032) (USD Billion)
9.3.1.8.2 Turkey Vanillic Acid Market Estimates and Forecasts, By Application (2020-2032) (USD Billion)
9.3.1.9 Rest of Eastern Europe
9.3.1.9.1 Rest of Eastern Europe Vanillic Acid Market Estimates and Forecasts, By Purity (2020-2032) (USD Billion)
9.3.1.9.2 Rest of Eastern Europe Vanillic Acid Market Estimates and Forecasts, By Application (2020-2032) (USD Billion)
9.3.2 Western Europe
9.3.2.1 Trends Analysis
9.3.2.2 Western Europe Vanillic Acid Market Estimates and Forecasts, by Country (2020-2032) (USD Billion)
9.3.2.3 Western Europe Vanillic Acid Market Estimates and Forecasts, By Purity (2020-2032) (USD Billion)
9.3.2.4 Western Europe Vanillic Acid Market Estimates and Forecasts, By Application (2020-2032) (USD Billion)
9.3.2.5 Germany
9.3.2.5.1 Germany Vanillic Acid Market Estimates and Forecasts, By Purity (2020-2032) (USD Billion)
9.3.2.5.2 Germany Vanillic Acid Market Estimates and Forecasts, By Application (2020-2032) (USD Billion)
9.3.2.6 France
9.3.2.6.1 France Vanillic Acid Market Estimates and Forecasts, By Purity (2020-2032) (USD Billion)
9.3.2.6.2 France Vanillic Acid Market Estimates and Forecasts, By Application (2020-2032) (USD Billion)
9.3.2.7 UK
9.3.2.7.1 UK Vanillic Acid Market Estimates and Forecasts, By Purity (2020-2032) (USD Billion)
9.3.2.7.2 UK Vanillic Acid Market Estimates and Forecasts, By Application (2020-2032) (USD Billion)
9.3.2.8 Italy
9.3.2.8.1 Italy Vanillic Acid Market Estimates and Forecasts, By Purity (2020-2032) (USD Billion)
9.3.2.8.2 Italy Vanillic Acid Market Estimates and Forecasts, By Application (2020-2032) (USD Billion)
9.3.2.9 Spain
9.3.2.9.1 Spain Vanillic Acid Market Estimates and Forecasts, By Purity (2020-2032) (USD Billion)
9.3.2.9.2 Spain Vanillic Acid Market Estimates and Forecasts, By Application (2020-2032) (USD Billion)
9.3.2.10 Netherlands
9.3.2.10.1 Netherlands Vanillic Acid Market Estimates and Forecasts, By Purity (2020-2032) (USD Billion)
9.3.2.10.2 Netherlands Vanillic Acid Market Estimates and Forecasts, By Application (2020-2032) (USD Billion)
9.3.2.11 Switzerland
9.3.2.11.1 Switzerland Vanillic Acid Market Estimates and Forecasts, By Purity (2020-2032) (USD Billion)
9.3.2.11.2 Switzerland Vanillic Acid Market Estimates and Forecasts, By Application (2020-2032) (USD Billion)
9.3.2.12 Austria
9.3.2.12.1 Austria Vanillic Acid Market Estimates and Forecasts, By Purity (2020-2032) (USD Billion)
9.3.2.12.2 Austria Vanillic Acid Market Estimates and Forecasts, By Application (2020-2032) (USD Billion)
9.3.2.13 Rest of Western Europe
9.3.2.13.1 Rest of Western Europe Vanillic Acid Market Estimates and Forecasts, By Purity (2020-2032) (USD Billion)
9.3.2.13.2 Rest of Western Europe Vanillic Acid Market Estimates and Forecasts, By Application (2020-2032) (USD Billion)
9.4 Asia-Pacific
9.4.1 Trends Analysis
9.4.2 Asia-Pacific Vanillic Acid Market Estimates and Forecasts, by Country (2020-2032) (USD Billion)
9.4.3 Asia-Pacific Vanillic Acid Market Estimates and Forecasts, By Purity (2020-2032) (USD Billion)
9.4.4 Asia-Pacific Vanillic Acid Market Estimates and Forecasts, By Application (2020-2032) (USD Billion)
9.4.5 China
9.4.5.1 China Vanillic Acid Market Estimates and Forecasts, By Purity (2020-2032) (USD Billion)
9.4.5.2 China Vanillic Acid Market Estimates and Forecasts, By Application (2020-2032) (USD Billion)
9.4.6 India
9.4.5.1 India Vanillic Acid Market Estimates and Forecasts, By Purity (2020-2032) (USD Billion)
9.4.5.2 India Vanillic Acid Market Estimates and Forecasts, By Application (2020-2032) (USD Billion)
9.4.5 Japan
9.4.5.1 Japan Vanillic Acid Market Estimates and Forecasts, By Purity (2020-2032) (USD Billion)
9.4.5.2 Japan Vanillic Acid Market Estimates and Forecasts, By Application (2020-2032) (USD Billion)
9.4.6 South Korea
9.4.6.1 South Korea Vanillic Acid Market Estimates and Forecasts, By Purity (2020-2032) (USD Billion)
9.4.6.2 South Korea Vanillic Acid Market Estimates and Forecasts, By Application (2020-2032) (USD Billion)
9.4.7 Vietnam
9.4.7.1 Vietnam Vanillic Acid Market Estimates and Forecasts, By Purity (2020-2032) (USD Billion)
9.2.7.2 Vietnam Vanillic Acid Market Estimates and Forecasts, By Application (2020-2032) (USD Billion)
9.4.8 Singapore
9.4.8.1 Singapore Vanillic Acid Market Estimates and Forecasts, By Purity (2020-2032) (USD Billion)
9.4.8.2 Singapore Vanillic Acid Market Estimates and Forecasts, By Application (2020-2032) (USD Billion)
9.4.9 Australia
9.4.9.1 Australia Vanillic Acid Market Estimates and Forecasts, By Purity (2020-2032) (USD Billion)
9.4.9.2 Australia Vanillic Acid Market Estimates and Forecasts, By Application (2020-2032) (USD Billion)
9.4.10 Rest of Asia-Pacific
9.4.10.1 Rest of Asia-Pacific Vanillic Acid Market Estimates and Forecasts, By Purity (2020-2032) (USD Billion)
9.4.10.2 Rest of Asia-Pacific Vanillic Acid Market Estimates and Forecasts, By Application (2020-2032) (USD Billion)
9.5 Middle East and Africa
9.5.1 Middle East
9.5.1.1 Trends Analysis
9.5.1.2 Middle East Vanillic Acid Market Estimates and Forecasts, by Country (2020-2032) (USD Billion)
9.5.1.3 Middle East Vanillic Acid Market Estimates and Forecasts, By Purity (2020-2032) (USD Billion)
9.5.1.4 Middle East Vanillic Acid Market Estimates and Forecasts, By Application (2020-2032) (USD Billion)
9.5.1.5 UAE
9.5.1.5.1 UAE Vanillic Acid Market Estimates and Forecasts, By Purity (2020-2032) (USD Billion)
9.5.1.5.2 UAE Vanillic Acid Market Estimates and Forecasts, By Application (2020-2032) (USD Billion)
9.5.1.6 Egypt
9.5.1.6.1 Egypt Vanillic Acid Market Estimates and Forecasts, By Purity (2020-2032) (USD Billion)
9.5.1.6.2 Egypt Vanillic Acid Market Estimates and Forecasts, By Application (2020-2032) (USD Billion)
9.5.1.7 Saudi Arabia
9.5.1.7.1 Saudi Arabia Vanillic Acid Market Estimates and Forecasts, By Purity (2020-2032) (USD Billion)
9.5.1.7.2 Saudi Arabia Vanillic Acid Market Estimates and Forecasts, By Application (2020-2032) (USD Billion)
9.5.1.8 Qatar
9.5.1.8.1 Qatar Vanillic Acid Market Estimates and Forecasts, By Purity (2020-2032) (USD Billion)
9.5.1.8.2 Qatar Vanillic Acid Market Estimates and Forecasts, By Application (2020-2032) (USD Billion)
9.5.1.9 Rest of Middle East
9.5.1.9.1 Rest of Middle East Vanillic Acid Market Estimates and Forecasts, By Purity (2020-2032) (USD Billion)
9.5.1.9.2 Rest of Middle East Vanillic Acid Market Estimates and Forecasts, By Application (2020-2032) (USD Billion)
9.5.2 Africa
9.5.2.1 Trends Analysis
9.5.2.2 Africa Vanillic Acid Market Estimates and Forecasts, by Country (2020-2032) (USD Billion)
9.5.2.3 Africa Vanillic Acid Market Estimates and Forecasts, By Purity (2020-2032) (USD Billion)
9.5.2.4 Africa Vanillic Acid Market Estimates and Forecasts, By Application (2020-2032) (USD Billion)
9.5.2.5 South Africa
9.5.2.5.1 South Africa Vanillic Acid Market Estimates and Forecasts, By Purity (2020-2032) (USD Billion)
9.5.2.5.2 South Africa Vanillic Acid Market Estimates and Forecasts, By Application (2020-2032) (USD Billion)
9.5.2.6 Nigeria
9.5.2.6.1 Nigeria Vanillic Acid Market Estimates and Forecasts, By Purity (2020-2032) (USD Billion)
9.5.2.6.2 Nigeria Vanillic Acid Market Estimates and Forecasts, By Application (2020-2032) (USD Billion)
9.6 Latin America
9.6.1 Trends Analysis
9.6.2 Latin America Vanillic Acid Market Estimates and Forecasts, by Country (2020-2032) (USD Billion)
9.6.3 Latin America Vanillic Acid Market Estimates and Forecasts, By Purity (2020-2032) (USD Billion)
9.6.4 Latin America Vanillic Acid Market Estimates and Forecasts, By Application (2020-2032) (USD Billion)
9.6.5 Brazil
9.6.5.1 Brazil Vanillic Acid Market Estimates and Forecasts, By Purity (2020-2032) (USD Billion)
9.6.5.2 Brazil Vanillic Acid Market Estimates and Forecasts, By Application (2020-2032) (USD Billion)
9.6.6 Argentina
9.6.6.1 Argentina Vanillic Acid Market Estimates and Forecasts, By Purity (2020-2032) (USD Billion)
9.6.6.2 Argentina Vanillic Acid Market Estimates and Forecasts, By Application (2020-2032) (USD Billion)
9.6.7 Colombia
9.6.7.1 Colombia Vanillic Acid Market Estimates and Forecasts, By Purity (2020-2032) (USD Billion)
9.6.7.2 Colombia Vanillic Acid Market Estimates and Forecasts, By Application (2020-2032) (USD Billion)
9.6.8 Rest of Latin America
9.6.8.1 Rest of Latin America Vanillic Acid Market Estimates and Forecasts, By Purity (2020-2032) (USD Billion)
9.6.8.2 Rest of Latin America Vanillic Acid Market Estimates and Forecasts, By Application (2020-2032) (USD Billion)
11. Company Profiles
11.1 Quzhou Mingfeng Chemical
11.1.1 Company Overview
11.1.2 Financial
11.1.3 Products/ Services Offered
11.1.4 SWOT Analysis
11.2 Solvay
11.2.1 Company Overview
11.2.2 Financial
11.2.3 Products/ Services Offered
11.2.4 SWOT Analysis
11.3 Donglian Nankai FlavorDlflavor
11.3.1 Company Overview
11.3.2 Financial
11.3.3 Products/ Services Offered
11.3.4 SWOT Analysis
11.4 The Good Scents Company
11.4.1 Company Overview
11.4.2 Financial
11.4.3 Products/ Services Offered
11.4.4 SWOT Analysis
11.5 Parchem Fine & Specialty Chemicals
11.5.1 Company Overview
11.5.2 Financial
11.5.3 Products/ Services Offered
11.5.4 SWOT Analysis
11.6 Otto Chemie Pvt. Ltd.
11.6.1 Company Overview
11.6.2 Financial
11.6.3 Products/ Services Offered
11.6.4 SWOT Analysis
11.7 Zhejiang NHU Co., Ltd.
11.7.1 Company Overview
11.7.2 Financial
11.7.3 Products/ Services Offered
11.7.4 SWOT Analysis
11.8 Guangzhou Shiny Co., Ltd.
11.8.1 Company Overview
11.8.2 Financial
11.8.3 Products/ Services Offered
11.8.4 SWOT Analysis
11.9 Henan Tianfu Chemical Co., Ltd
11.9.1 Company Overview
11.9.2 Financial
11.9.3 Products/ Services Offered
11.9.4 SWOT Analysis
11.10 Sigma-Aldrich
11.10.1 Company Overview
11.10.2 Financial
11.10.3 Products/ Services Offered
11.10.4 SWOT Analysis
12. Use Cases and Best Practices
13. Conclusion
An accurate research report requires proper strategizing as well as implementation. There are multiple factors involved in the completion of good and accurate research report and selecting the best methodology to compete the research is the toughest part. Since the research reports we provide play a crucial role in any company’s decision-making process, therefore we at SNS Insider always believe that we should choose the best method which gives us results closer to reality. This allows us to reach at a stage wherein we can provide our clients best and accurate investment to output ratio.
Each report that we prepare takes a timeframe of 350-400 business hours for production. Starting from the selection of titles through a couple of in-depth brain storming session to the final QC process before uploading our titles on our website we dedicate around 350 working hours. The titles are selected based on their current market cap and the foreseen CAGR and growth.
The 5 steps process:
Step 1: Secondary Research:
Secondary Research or Desk Research is as the name suggests is a research process wherein, we collect data through the readily available information. In this process we use various paid and unpaid databases which our team has access to and gather data through the same. This includes examining of listed companies’ annual reports, Journals, SEC filling etc. Apart from this our team has access to various associations across the globe across different industries. Lastly, we have exchange relationships with various university as well as individual libraries.
Step 2: Primary Research
When we talk about primary research, it is a type of study in which the researchers collect relevant data samples directly, rather than relying on previously collected data. This type of research is focused on gaining content specific facts that can be sued to solve specific problems. Since the collected data is fresh and first hand therefore it makes the study more accurate and genuine.
We at SNS Insider have divided Primary Research into 2 parts.
Part 1 wherein we interview the KOLs of major players as well as the upcoming ones across various geographic regions. This allows us to have their view over the market scenario and acts as an important tool to come closer to the accurate market numbers. As many as 45 paid and unpaid primary interviews are taken from both the demand and supply side of the industry to make sure we land at an accurate judgement and analysis of the market.
This step involves the triangulation of data wherein our team analyses the interview transcripts, online survey responses and observation of on filed participants. The below mentioned chart should give a better understanding of the part 1 of the primary interview.
Part 2: In this part of primary research the data collected via secondary research and the part 1 of the primary research is validated with the interviews from individual consultants and subject matter experts.
Consultants are those set of people who have at least 12 years of experience and expertise within the industry whereas Subject Matter Experts are those with at least 15 years of experience behind their back within the same space. The data with the help of two main processes i.e., FGDs (Focused Group Discussions) and IDs (Individual Discussions). This gives us a 3rd party nonbiased primary view of the market scenario making it a more dependable one while collation of the data pointers.
Step 3: Data Bank Validation
Once all the information is collected via primary and secondary sources, we run that information for data validation. At our intelligence centre our research heads track a lot of information related to the market which includes the quarterly reports, the daily stock prices, and other relevant information. Our data bank server gets updated every fortnight and that is how the information which we collected using our primary and secondary information is revalidated in real time.
Step 4: QA/QC Process
After all the data collection and validation our team does a final level of quality check and quality assurance to get rid of any unwanted or undesired mistakes. This might include but not limited to getting rid of the any typos, duplication of numbers or missing of any important information. The people involved in this process include technical content writers, research heads and graphics people. Once this process is completed the title gets uploader on our platform for our clients to read it.
Step 5: Final QC/QA Process:
This is the last process and comes when the client has ordered the study. In this process a final QA/QC is done before the study is emailed to the client. Since we believe in giving our clients a good experience of our research studies, therefore, to make sure that we do not lack at our end in any way humanly possible we do a final round of quality check and then dispatch the study to the client.
By Purity
Purity 99%
Purity 98%
Others
By Application
Pharmaceutical Intermediates
Flavors and Fragrances
Other Applications
Request for Segment Customization as per your Business Requirement: Segment Customization Request
Regional Coverage
North America
US
Canada
Mexico
Europe
Eastern Europe
Poland
Romania
Hungary
Turkey
Rest of Eastern Europe
Western Europe
Germany
France
UK
Italy
Spain
Netherlands
Switzerland
Austria
Rest of Western Europe
Asia Pacific
China
India
Japan
South Korea
Vietnam
Singapore
Australia
Rest of Asia Pacific
Middle East & Africa
Middle East
UAE
Egypt
Saudi Arabia
Qatar
Rest of the Middle East
Africa
Nigeria
South Africa
Rest of Africa
Latin America
Brazil
Argentina
Colombia
Rest of Latin America
Request for Country Level Research Report: Country Level Customization Request
Available Customization
With the given market data, SNS Insider offers customization as per the company’s specific needs. The following customization options are available for the report:
Product Analysis
Criss-Cross segment analysis (e.g. Product X Application)
Product Matrix which gives a detailed comparison of product portfolio of each company
Geographic Analysis
Additional countries in any of the regions
Company Information
Detailed analysis and profiling of additional market players (Up to five)
The Textile Chemicals Market Size was valued at USD 27.7 billion in 2023 and is expected to reach USD 41.9 billion by 2032 and grow at a CAGR of 4.7% over the forecast period 2024-2032.
The Chemicals Digitalization Market Size was valued at USD 14.50 billion in 2023 and is expected to reach USD 89.16 billion by 2032 and grow at a CAGR of 22.36% over the forecast period 2024-2032.
The Needle Coke Market Size was valued at USD 4.8 Billion in 2023. It is expected to grow to $9.7 Bn by 2032 and grow at a CAGR of 8.2% by 2024-2032.
The Sustainable Apparel Market Size was valued at USD 11.20 billion in 2023 and will reach USD 24.53 billion by 2032, & grow at a CAGR of 9.1% by 2024-2032.
Plain Bearing Market size was estimated at USD 12.88 billion in 2023 and is expected to reach USD 20.33 billion by 2032 at a CAGR of 5.20% from 2024 to 2032.
The Ionic Liquids Market size was valued at USD 50.8 Million in 2023. It is expected to grow to USD 110.5 Million by 2032 and grow at a CAGR of 9.00% over the forecast period of 2024-2032.
Hi! Click one of our member below to chat on Phone