Utility Locator Market Report Scope & Overview:
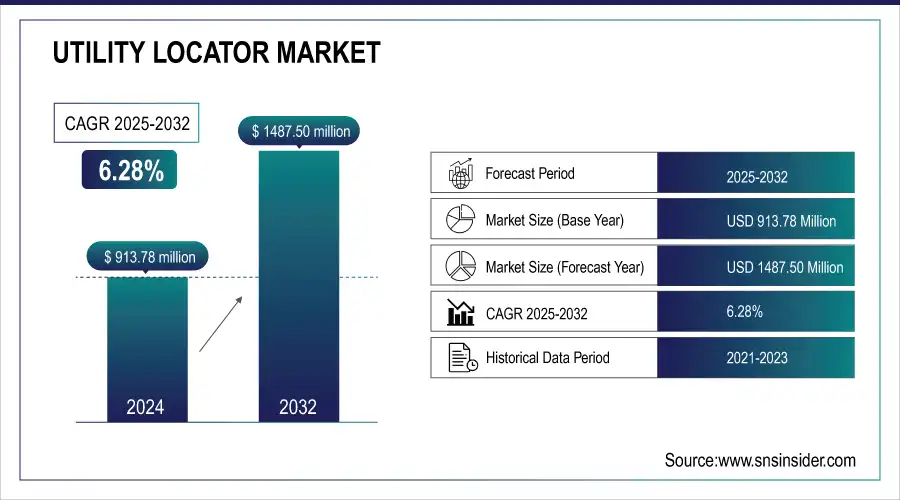
The Utility Locator Market was valued at USD 913.78 Million in 2024 and is expected to reach USD 1487.50 Million by 2032, growing at a CAGR of 6.28% from 2025-2032.
To Get more information on Utility Locator Market - Request Free Sample Report
This report includes an in-depth analysis of key factors influencing market growth, such as customer satisfaction and adoption rates, trends in investment, deployment and sales numbers, regulatory impact, and a cost vs. benefit analysis. It highlights how telecommunication plays a pivotal role in the advancement of utility locating technologies, driving demand across various sectors. The report also explores the evolving landscape of the market, including challenges and opportunities for stakeholders, while emphasizing the increasing adoption of innovative solutions for improved accuracy and efficiency in utility detection.
Market Size and Forecast
-
Utility Locator Market Size in 2024: USD 913.78 Million
-
Utility Locator Market Size by 2032: USD 1487.50 Million
-
CAGR: 6.28% from 2025 to 2032
-
Base Year: 2024
-
Forecast Period: 2025–2032
-
Historical Data: 2021–2023
Utility Locator Market Trends
-
Rising demand for safe and efficient underground utility detection is driving utility locator adoption.
-
Increasing urban infrastructure development and maintenance projects are boosting market growth.
-
Integration with GPS, GIS, and IoT technologies is enhancing accuracy, mapping, and data management.
-
Adoption across telecom, water, gas, and energy sectors is expanding market applications.
-
Growing focus on reducing excavation risks and project delays is encouraging usage.
-
Advancements in multi-frequency, electromagnetic, and ground-penetrating radar (GPR) technologies are improving detection capabilities.
-
Collaborations between equipment manufacturers, construction firms, and municipal authorities are accelerating innovation and deployment.
Utility Locator Market Growth Drivers:
-
Urbanization and Infrastructure Development Drive Growing Demand for Accurate Utility Locating Solutions
The growth rate of urbanization and the ongoing construction of infrastructure projects globally cause a greater need for accurate utility location services. As new buildings, roads, and utilities are built, accurate detection of buried utilities is necessary in order to prevent expensive interruptions and maintain safety while building. Such a demand is complemented by the intricacy of contemporary infrastructure, which is usually comprised of compact networks of utilities that need to be well-mapped and administered. The increasing number of public and private sector construction projects ensures that utility locator technologies play a crucial role in averting accidents, reducing service disruptions, and guaranteeing adherence to safety standards, all of which support market development.
Utility Locator Market Restraints:
-
High Costs, Skilled Labor Shortage, and Regional Challenges Hinder Growth in the Utility Locator Market
The high initial expenses of purchasing sophisticated utility locator equipment and technologies are a major hindrance, particularly for small and medium-sized businesses with tight budgets. Furthermore, the lack of skilled personnel to handle these technologies also slows down market growth, as demand outstrips supply. In some areas, particularly in developing economies, weak infrastructure, poor awareness, and tight budgets hamper the take-up of utility locator solutions. Additionally, in spite of advancements in technologies such as ground-penetrating radar, there are still constraints in locating utilities in some soil types or at deeper levels. Differences in local regulations and standards may also delay standardization and widespread adoption of these technologies, precluding smoother market growth in different regions.
Utility Locator Market Opportunities:
-
Technological Innovations and Growing Infrastructure Demand Drive New Growth Opportunities in the Utility Locator Market
Advances in technologies like 3D mapping, AI incorporation, and drone surveys can substantially enhance the precision and efficiency of utility locating to facilitate more accurate identification of buried utilities. Furthermore, the growth of smart cities creates a greater need for sophisticated utility management systems, opening up new opportunities for utility locator technologies in city planning. Government spending on infrastructure and safety legislation will also propel the market, as demand for accurate utility location solutions rises. The widening emphasis on utility asset management also drives increased demand further, with developing regions offering up untapped opportunities as their awareness and adoption rates rise.
Utility Locator Market Challenges
-
Data Management, Integration Issues, and High Costs Present Key Challenges for the Utility Locator Market
Handling vast amounts of data produced by utility locator technology poses serious challenges with the need for advanced software and analysis for proper interpretation and use. The sophistication is compounded when working with information from various sources or different technologies, making decision-making more complicated. Moreover, accuracy and depth constraints still pose an issue since some utility location systems are not able to find utilities at deeper depths or in adverse conditions. High maintenance costs of operating sophisticated systems also pose a challenge, especially to smaller businesses. In addition, implementing new utility locator technologies into current infrastructure and legacy systems may be challenging, slowing down mass adoption. Adhering to constantly shifting regulations in varying regions makes it even harder to have utility locator solutions deployed seamlessly.
Utility Locator Market Segment Analysis
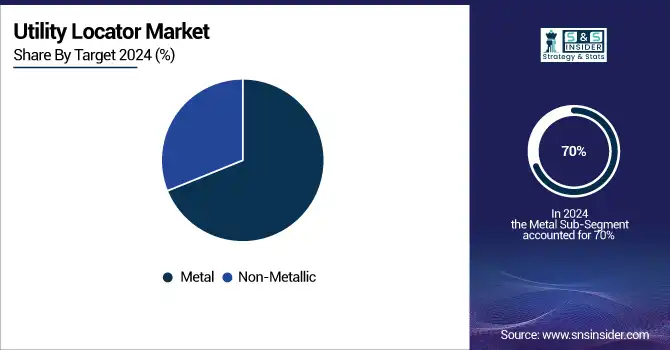
By Target, Metal dominates the utility locator market. Non-metallic utilities are expected to grow fastest
The metal segment led the Utility Locator Market with the largest revenue share of approximately 70% in 2024. The reason for this leadership is the extensive use of metal utilities, including pipes and cables, which are generally present in city and industrial facilities. Metal utilities are simpler to identify with conventional utility locator techniques like electromagnetic and ground-penetrating radar, thus proving to be an ideal target for utility locators, leading to the increased revenue share.
The non-metallic part will witness the fastest CAGR of around 7.78% during 2025-2032. This is led by the enhanced usage of non-metallic materials like plastic and composite pipes due to the growing demand for their corrosion resistance, durability, and cost-effectiveness. As more utility infrastructure starts incorporating these products on a large scale, there will be a significant rise in demand for the latest locator technology for detecting non-metallic utilities and thus, the market will expand.
By Offering, Equipment dominates the utility locator market. Services are expected to grow fastest
The equipment segment led the Utility Locator Market in the largest revenue share of approximately 64% in 2024. This is because the key function of sophisticated utility locator technology, including electromagnetic locators, ground-penetrating radar, and acoustic sensors, in precisely locating and mapping buried utilities contributes to their demand. These products are essential for construction, maintenance, and safety activities, which results in steady demand for high-quality, reliable equipment across industries, thus making it the leading market revenue segment.
The services segment will expand at the fastest CAGR of around 7.23% during 2025-2032. The reason for growth is rising demand for professional utility location services, particularly in safety, compliance, and infrastructure management industries. As urbanization increases and more intricate infrastructure develops, companies seek expert services to provide precise utility detection and prevent expensive interruptions, hence propelling the high growth of the services segment.
By Technique, Electromagnetic field dominates the utility locator market. Ground Penetrating Radar (GPR) is expected to grow fastest
The Electromagnetic Field segment led the Utility Locator Market with the largest revenue share of approximately 49% in 2024. This is attributed to the prevalence of electromagnetic locators, which are very efficient in locating metallic utilities such as cables, pipes, and wiring. The locators are well embraced for their precision, simplicity, and suitability for operation in different conditions. Their proven market presence coupled with their consistent performance makes them the top technology for utility detection.
The Ground Penetrating Radar (GPR) segment is expected to grow at the fastest CAGR of 7.81% from 2025-2032. This growth is driven by the increasing demand for non-invasive, highly accurate utility locating technologies. GPR is particularly valuable for detecting both metallic and non-metallic utilities, offering superior depth penetration and greater versatility compared to traditional methods. As infrastructure complexity rises, the need for GPR’s advanced capabilities will continue to fuel its market expansion.
By Vertical, Telecommunication dominates the utility locator market. Water and sewage is expected to grow fastest.
The Telecommunication segment led the Utility Locator Market with the largest revenue share of approximately 30% in 2024. This is attributed to the widespread utilization of telecommunication networks, such as cables, fiber optics, and underground cabling, which are a component of urban and industrial infrastructure. The high need for utility locating technologies to facilitate proper installation, maintenance, and safety of these telecommunication networks drives the segment's market leadership and revenue share.
The Water and Sewage segment is expected to grow at the fastest CAGR of 9.07% from 2025-2032. This growth is a result of rising emphasis on water conservation, green infrastructure development, and old sewage pipes. While urban centers and industries upgrade water and sewage infrastructure, precise detection of underground utilities and pipes is becoming essential. The increasing need for effective management and maintenance of water and sewage infrastructure drives the growth of this segment.
Utility Locator Market Regional Analysis
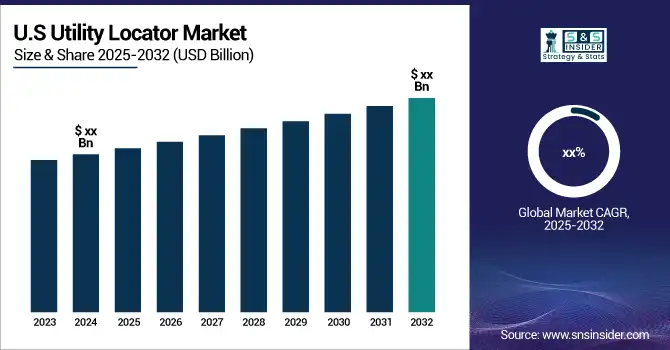
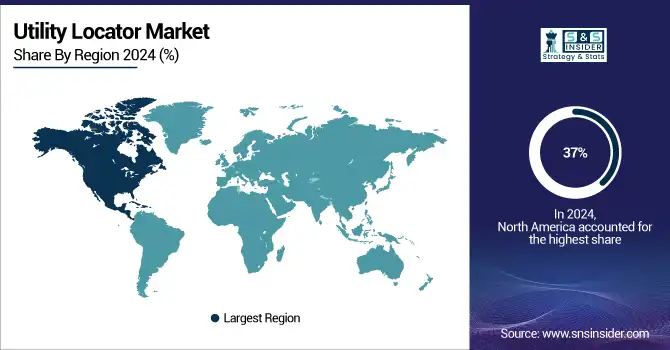
North America Utility Locator Market Insights
North America led the Utility Locator Market with the largest revenue share of approximately 37% in 2024. This is because the region has a vast infrastructure development and the strong demand for sophisticated utility locating technologies in industries like construction, telecommunications, and energy. Strict safety codes and the demand for precise underground utility mapping in developed regions play their part in establishing the high market share. The fact that North America embraces the latest technologies and has mature industry participants secures its leadership role.
Get Customized Report as per Your Business Requirement - Enquiry Now
Asia Pacific Utility Locator Market Insights
Asia Pacific is expected to grow at the fastest CAGR of 8.03% during 2025-2032. This development is supported by speedy urbanization, infrastructure expansion, and higher investment in utility management in emerging economies. The increasing interest in modernization and security, especially in cities with aged infrastructure, increases the demand for utility locator technologies. As awareness and penetration grow, Asia Pacific's market is also expected to grow at a fast rate.
Europe Utility Locator Market Insights
Europe holds a significant position in the Utility Locator Market, driven by advanced infrastructure development, stringent safety regulations, and increasing investments in smart city projects. Growing demand for accurate underground mapping, adoption of advanced GPR and electromagnetic technologies, and focus on reducing utility damages during construction fuel market growth. Countries like Germany, the UK, and France lead in technological adoption, making Europe a key hub for utility locator solutions.
Middle East & Africa and Latin America Utility Locator Market Insights
The Middle East & Africa and Latin America are emerging markets for the Utility Locator Market, supported by expanding urban infrastructure, construction, and energy projects. Rising investments in smart city initiatives, growing adoption of advanced GPR and electromagnetic technologies, and increasing awareness of safe excavation practices are driving demand. Countries such as Brazil, Mexico, UAE, and Saudi Arabia are witnessing growing utilization of utility locator solutions across industrial and municipal applications.
Utility Locator Market Competitive Landscape:
3M
3M is a diversified technology company providing innovative solutions across multiple industries, including healthcare, automotive, electronics, and industrial sectors. The company focuses on advanced materials, safety products, and infrastructure solutions, including utility locator technologies and components that enhance operational efficiency and safety in construction, maintenance, and engineering projects. Its broad portfolio enables adoption across various applications globally.
-
September 2024: 3M announced that it had made and sold over 300 million friction shims worldwide, highlighting its significant production milestone. These shims play a crucial role in various industries, including automotive and aerospace.
Emerson Electric Co.
Emerson Electric Co. is a global technology and engineering company specializing in automation solutions, measurement instruments, and industrial software. It provides cutting-edge platforms for power, water, and manufacturing sectors, integrating advanced analytics, IoT, and AI capabilities. Emerson’s solutions enhance operational efficiency, safety, and precision in industrial and infrastructure applications, including utility detection and monitoring.
-
July 2024: Emerson launched its Ovation 4.0 Automation Platform, which integrates generative artificial intelligence (GenAI) to improve data analysis and decision-making in power and water operations, enhancing utility locator functionalities.
Maverick Inspection
Maverick Inspection is a specialized services provider offering comprehensive subsurface investigation and utility mapping solutions. The company leverages technologies such as Ground Penetrating Radar (GPR), electromagnetic locating, and magnetometry to accurately detect and map underground utilities, pipelines, and structures. Maverick supports construction, municipal, and industrial clients, ensuring safe excavation, regulatory compliance, and infrastructure development across diverse geographies.
-
2024: Maverick Inspection continues to offer comprehensive subsurface investigation services, utilizing technologies like Ground Penetrating Radar (GPR), electromagnetic locating, and magnetometry to accurately detect and map underground utilities and objects.
Key Players
-
3M (Scotchlok Connectors, 3M Dynatel Locator)
-
Emerson Electric Co. (Rosemount Tank Gauging, Micro Motion Coriolis Flow Meters)
-
Geophysical Survey Systems, Inc. (Radar System, GPR Utility Locator)
-
Geotech (GPR System, Utility Locator)
-
Guideline Geo (Seismo, Geode GPR)
-
Leica Geosystems AG (Leica DSX, Leica DD250 Locator)
-
MultiVIEW (Advanced GPR, Utility Survey Solutions)
-
Radiodetection Ltd. (RD7100 Locator, RD8100 Locator)
-
The Charles Machine Works, Inc. (Ditch Witch JT5, Ditch Witch 2720)
-
USIC, LLC (Locator Equipment, Utility Mapping Solutions)
-
Detection Services (GPR Utility Locator, Utility Mapping Services)
-
Ground Penetrating Radar Systems (Utility Locator, Ground Radar)
-
Maverick Inspection (Pipeline Inspection, Utility Mapping Services)
-
McLaughlin (Utility Locators, Ground Penetrating Radar Systems)
-
On Target Utility Services (Utility Locators, Utility Mapping)
-
Pipehorn (Locator Systems, GPR Systems)
-
Ridge Tool Company (Ridgid SeekTech, Ridgid Locator)
-
Vivax-Metrotech (VLoc3-Pro Locator, VLoc3-CAM Locator)
-
RHD Services (Utility Locators, Inspection Systems)
-
One Vision Utility Services (Utility Location, Mapping Solutions)
-
Utilities Plus (Utility Detection Services, Utility Locating Solutions)
| Report Attributes | Details |
|---|---|
| Market Size in 2024 | USD 913.78 Million |
| Market Size by 2032 | USD 1487.50 Billion |
| CAGR | CAGR of 6.28% From 2025 to 2032 |
| Base Year | 2024 |
| Forecast Period | 2025-2032 |
| Historical Data | 2021-2023 |
| Report Scope & Coverage | Market Size, Segments Analysis, Competitive Landscape, Regional Analysis, DROC & SWOT Analysis, Forecast Outlook |
| Key Segments | • By Technique (Electromagnetic Field, Ground Penetrating Radar, Others) • By Offering (Equipment, Services) • By Target (Metallic, Non-metallic) • By Vertical (Oil & Gas, Electricity, Transportation, Water and Sewage, Telecommunication, Others) |
| Regional Analysis/Coverage | North America (US, Canada, Mexico), Europe (Eastern Europe [Poland, Romania, Hungary, Turkey, Rest of Eastern Europe] Western Europe] Germany, France, UK, Italy, Spain, Netherlands, Switzerland, Austria, Rest of Western Europe]), Asia Pacific (China, India, Japan, South Korea, Vietnam, Singapore, Australia, Rest of Asia Pacific), Middle East & Africa (Middle East [UAE, Egypt, Saudi Arabia, Qatar, Rest of Middle East], Africa [Nigeria, South Africa, Rest of Africa], Latin America (Brazil, Argentina, Colombia, Rest of Latin America) |
| Company Profiles | 3M, Emerson Electric Co., Geophysical Survey Systems, Inc., Geotech, Guideline Geo, Leica Geosystems AG, MultiVIEW, Radiodetection Ltd., The Charles Machine Works, Inc., USIC, LLC, Detection Services, Ground Penetrating Radar Systems, Maverick Inspection, McLaughlin, On Target Utility Services, Pipehorn, Ridge Tool Company, Vivax-Metrotech, RHD Services, One Vision Utility Services, Utilities Plus. |
Get in Touch
