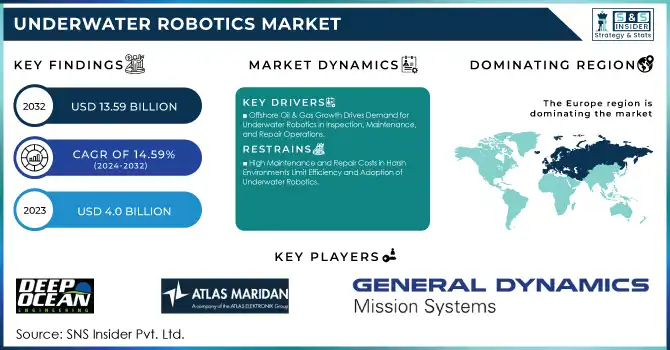
The Underwater Robotics Market Size was valued at USD 4 billion in 2023 and is expected to reach USD 13.59 billion by 2032, growing at a CAGR of 14.59% from 2024-2032.
The underwater robotics market is witnessing significant expansion, fueled by technological advancements and the increasing demands of industries such as oil and gas, marine research, defense, and offshore infrastructure. These technological advancements have resulted in the creation of more advanced robotic systems capable of executing intricate tasks at deeper levels and with improved accuracy.
To get more information on Underwater Robotics Market - Request Free Sample Report
As these technologies advance, the need for underwater robotics keeps increasing, especially for their capacity to gather essential data, observe underwater ecosystems, and investigate areas that were previously unreachable. For instance, in January 2025, scientists in China created an underwater robot that can get close to the seabed without creating disturbances. This advancement tackles difficulties in traversing rough landscapes, including barriers and inclines, thereby broadening the possible uses of underwater robots in sensitive and intricate settings.
The increasing demand is primarily because underwater robots can improve operational efficiency and reduce human risk in hazardous underwater settings. For instance, in the oil and gas sector, these robots are crucial for tasks such as inspecting and repairing pipelines, while in the defense field, they are being utilized more for surveillance and detecting mines. In June 2024, researchers funded by NSF created AI-driven autonomous underwater vehicles to improve marine conservation initiatives by effectively gathering data on species distribution and ecosystem dynamics. With the expansion of these applications, sectors are progressively depending on these systems for a wider array of tasks, driving the swift growth of the market and emphasizing the necessity for even more sophisticated solutions to address these varied and changing challenges.
Looking to the future, the market presents immense possibilities as the fusion of artificial intelligence, autonomous features, and real-time data analysis revolutionizes underwater robotics. These advancements will allow robots to function more independently and adjust to changing environments, leading to reduced costs and increased overall market demand. In September 2024, Beam introduced the first AI-powered autonomous underwater vehicle, improving efficiency and lowering expenses in inspections of offshore wind farms. Additionally, as sectors aim to harness sustainable resource management and underwater extraction, the demand for specialized underwater robotics will keep increasing, creating fresh opportunities for technological advancement and market growth.
Drivers
Offshore Oil & Gas Growth Drives Demand for Underwater Robotics in Inspection, Maintenance, and Repair Operations
With the increase in offshore oil and gas exploration, the need for sophisticated underwater robotics is rising. Remotely operated vehicles and autonomous underwater vehicles have become crucial for examining, maintaining, and fixing offshore infrastructure in difficult and extreme underwater conditions. These vehicles offer notable benefits, like minimizing reliance on human divers in hazardous environments, boosting operational efficiency, and increasing safety during underwater operations. As deepwater drilling initiatives grow increasingly intricate, the capacity of ROVs and AUVs to carry out vital tasks like pipeline assessments, equipment maintenance, and underwater construction has rendered them indispensable in the sector. As exploration efforts reach further into distant regions, underwater robotics advance, addressing the growing demand for accurate and dependable operations in extreme ocean depths.
Technological Advancements Enhance Efficiency, Durability, and Capabilities of Underwater Robotics for Expanded Market Applications
The ongoing development of underwater robotics technology is greatly improving their effectiveness and adaptability in multiple sectors. Advancements in robotics have resulted in the development of stronger, smarter systems featuring enhanced navigation, data gathering, and instant communication abilities. These improvements allow robots to function more independently in intricate settings, execute tasks with increased accuracy, and endure severe underwater circumstances. The incorporation of artificial intelligence and machine learning enhances decision-making capabilities and boosts operational efficiency. These advancements in technology are creating new opportunities for underwater robotics, allowing for their application in a broader array of fields, including scientific exploration, environmental surveillance, and industrial activities. As these technologies progress, the capacity for underwater robotics to address difficult tasks and generate operational savings grows even larger, enhancing their market attractiveness and application.
Restraints
High Maintenance and Repair Costs in Harsh Environments Limit Efficiency and Adoption of Underwater Robotics
The upkeep and fixing of underwater robots in extreme underwater conditions pose considerable difficulties for the sector. These robots are frequently utilized in hard-to-reach or deep-ocean sites, where repair access is restricted, resulting in prolonged inactivity. The need for specialized tools and knowledge for repairs can drive up maintenance expenses, thereby raising operational costs for businesses. Furthermore, the intricate nature of underwater robotics implies that even small malfunctions or deterioration can result in expensive repairs, adversely affecting operational efficiency. Consequently, companies in industries like oil and gas, marine research, and environmental monitoring need to consider elevated maintenance expenses and potential operational setbacks. These challenges may lower the overall efficiency and dependability of underwater robots, hindering their broad acceptance and sustained usage in the market.
Environmental Concerns Over Marine Life Disturbance and Ecosystem Impact May Slow Underwater Robotics Market Growth
The possible environmental effects of underwater robotics are an increasing worry, especially in relation to their influence on marine organisms and ecosystems. While underwater robots are utilized for diverse tasks like exploration, inspection, and research, they may unintentionally disrupt fragile marine ecosystems, including coral reefs and habitats of marine species. The sounds produced by certain robots and their actions can interfere with wildlife behavior, impacting migration routes, reproduction, and foraging. Moreover, worries regarding the possibility of pollution or habitat damage from the mechanical activities of these robots may result in tighter environmental regulations. These issues could hinder the uptake of underwater robotics in areas where environmental conservation is crucial or where regulations are tightening. The growing focus on ecological sustainability poses a challenge for businesses aiming to implement these technologies more widely.
By Type
In 2023, the Remotely Operated Vehicle (ROV) segment dominated the Underwater Robotics Market, capturing approximately 79% of the revenue share. This dominance can be attributed to the widespread use of ROVs in offshore oil and gas operations, where their ability to conduct inspections, repairs, and maintenance at significant depths is crucial. Additionally, their versatility and reliability in complex underwater environments make ROVs the preferred choice for various industries, including marine research and military applications, contributing to their substantial market share.
The Autonomous Underwater Vehicle (AUV) segment is expected to grow at the fastest compound annual growth rate of about 17.82% from 2024 to 2032. The increasing demand for AUVs is driven by their ability to operate autonomously without human intervention, enabling longer missions and more efficient data collection for scientific research, environmental monitoring, and military defense. As technology advances, AUVs are becoming more cost-effective and versatile, further accelerating their adoption across a wide range of industries, positioning them for rapid market growth.
By Application
In 2023, the Commercial Exploration segment led the Underwater Robotics Market, capturing the highest revenue share of approximately 42%. This dominance is primarily driven by the growing demand for underwater robots in offshore oil and gas exploration, mining, and renewable energy projects, where their ability to perform inspections, maintenance, and data collection at extreme depths is critical. The high operational efficiency and the cost-effective nature of underwater robotics in commercial applications contribute significantly to the strong market share in this segment.
The Scientific Research segment is poised for the fastest growth, with a projected compound annual growth rate of about 16.07% from 2024 to 2032. The increasing use of underwater robotics in environmental monitoring, oceanographic research, and marine biology is fueling this growth. As the need for precise data collection in remote underwater ecosystems intensifies, scientific institutions are increasingly adopting autonomous underwater vehicles for long-duration exploration and real-time data analysis, driving rapid expansion in this sector.
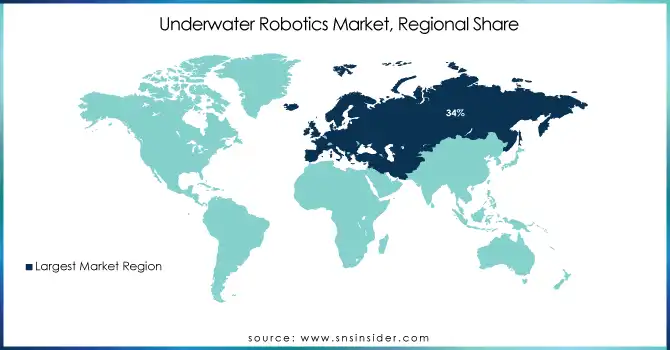
In 2023, Europe led the Underwater Robotics Market, accounting for approximately 34% of the revenue share. This dominance can be attributed to the region’s strong presence in industries such as offshore oil and gas, maritime defense, and renewable energy, where underwater robotics play a critical role in operations. Europe’s well-established infrastructure, technological advancements, and the presence of key industry players contribute to the region’s continued leadership in the market.
The Asia Pacific region is expected to grow at the fastest compound annual growth rate of about 17.03% from 2024 to 2032. This growth is driven by rapid industrialization, increasing investments in offshore oil and gas exploration, and the expanding focus on environmental sustainability in countries like China, Japan, and India. As these economies continue to invest in cutting-edge technology and research, the demand for underwater robotics in commercial and scientific applications is anticipated to surge, positioning Asia Pacific as the fastest-growing region in the market.
Get Customized Report as per Your Business Requirement - Enquiry Now
ATLAS MARIDAN Aps (ATLAS Scan, ATLAS DP)
Deep Ocean Engineering, Inc. (Remote Operated Vehicle (ROV) Systems, Docking Systems)
General Dynamics Mission Systems, Inc. (Bluefin-21 ROV, Bluefin-12)
ECA GROUP (AUVs, ROVs)
International Submarine Engineering Limited (AUVs, ROVs)
Eddyfi Technologies (ECT-Scanner, ROV-Optics)
Oceaneering International, Inc. (ROV Systems, Smart ROV)
Saab AB (Seaeye Falcon, Seaeye Leopard)
TechnipFMC plc (Schilling Robotics ROV, ROV Tools)
Soil Machine Dynamics Ltd. (Work-Class ROVs, Survey ROVs)
Fugro N.V. (ROVs, AUVs)
Teledyne Marine (Teledyne Gavia AUV, Teledyne SeaBotix ROVs)
Atlas Elektronik GmbH (Seafox, SeaPilot)
Kongsberg Maritime (Hydroid AUVs, Kongsberg ROVs)
Schilling Robotics LLC (a TechnipFMC company) (DeepWater ROV, ROV Tools)
Forum Energy Technologies, Inc. (Triton ROV, Forum ROV Systems)
Hydroid, Inc. (a Kongsberg company) (Hydroid Remus AUVs, Hydroid Remus 6000)
BIRNS, Inc. (BIRNS Apollo, BIRNS Nautilus)
Perry Slingsby Systems (a Triton Group company) (ROVs, Tooling Systems)
Seabotix, Inc. (a Saab company) (LBV150 ROV, LBV300 ROV)
Subsea 7 S.A. (ROV Services, AUV Services)
VideoRay LLC (Pro4 ROV, Mission Specialist ROV)
DOF Subsea AS (ROV Services, AUV Services)
Komatsu (Lunar Excavator, Autonomous Underwater Robot)
At CES 2025, Komatsu unveiled two innovative technologies: a lunar excavator designed for low-gravity environments and an autonomous underwater robot for construction tasks. These advancements highlight Komatsu’s focus on pioneering machinery for extreme applications, positioning the company as a leader in future industrial solutions.
In September 2024, SLB, Subsea7, and C-Power formed a partnership to explore the use of ocean energy for subsea operations. They will test C-Power’s SeaRAY autonomous offshore power system in challenging ocean conditions at the PacWave South site off Oregon, focusing on cost-effective, low-carbon energy solutions.
Report Attributes | Details |
---|---|
Market Size in 2023 | USD 4 Billion |
Market Size by 2032 | USD 13.59 Billion |
CAGR | CAGR of 14.59% From 2024 to 2032 |
Base Year | 2023 |
Forecast Period | 2024-2032 |
Historical Data | 2020-2022 |
Report Scope & Coverage | Market Size, Segments Analysis, Competitive Landscape, Regional Analysis, DROC & SWOT Analysis, Forecast Outlook |
Key Segments | • By Type (Remotely Operated Vehicle (ROV), Autonomous Underwater Vehicles (AUV)) • By Application (Defense & Security, Commercial Exploration, Scientific Research, Others) |
Regional Analysis/Coverage | North America (US, Canada, Mexico), Europe (Eastern Europe [Poland, Romania, Hungary, Turkey, Rest of Eastern Europe] Western Europe] Germany, France, UK, Italy, Spain, Netherlands, Switzerland, Austria, Rest of Western Europe]), Asia Pacific (China, India, Japan, South Korea, Vietnam, Singapore, Australia, Rest of Asia Pacific), Middle East & Africa (Middle East [UAE, Egypt, Saudi Arabia, Qatar, Rest of Middle East], Africa [Nigeria, South Africa, Rest of Africa], Latin America (Brazil, Argentina, Colombia, Rest of Latin America) |
Company Profiles | ATLAS MARIDAN Aps, Deep Ocean Engineering, Inc., General Dynamics Mission Systems, Inc., ECA GROUP, International Submarine Engineering Limited, Eddyfi Technologies, Oceaneering International, Inc., Saab AB, TechnipFMC plc, Soil Machine Dynamics Ltd., Fugro N.V., Teledyne Marine, Atlas Elektronik GmbH, Kongsberg Maritime, Schilling Robotics LLC, Forum Energy Technologies, Inc., Hydroid, Inc., BIRNS, Inc., Perry Slingsby Systems, Seabotix, Inc., Subsea 7 S.A., VideoRay LLC, DOF Subsea AS, Komatsu. |
Key Drivers | • Offshore Oil & Gas Growth Drives Demand for Underwater Robotics in Inspection, Maintenance, and Repair Operations. • Technological Advancements Enhance Efficiency, Durability, and Capabilities of Underwater Robotics for Expanded Market Applications. |
RESTRAINTS | • High Maintenance and Repair Costs in Harsh Environments Limit Efficiency and Adoption of Underwater Robotics. • Environmental Concerns Over Marine Life Disturbance and Ecosystem Impact May Slow Underwater Robotics Market Growth. |
Ans: Underwater Robotics Market was valued at USD 4 billion in 2023 and is expected to reach USD 13.59 billion by 2032, growing at a CAGR of 14.59% from 2024-2032.
Ans: The Scientific Research segment, with a projected CAGR of about 16.07%.
Ans: The Asia Pacific region, with a CAGR of about 17.03% from 2024 to 2032.
Ans: High maintenance costs and environmental concerns impacting marine ecosystems
Ans: Technological advancements and rising demand in industries like oil and gas, defense, and marine research.
Table of Content
1. Introduction
1.1 Market Definition
1.2 Scope (Inclusion and Exclusions)
1.3 Research Assumptions
2. Executive Summary
2.1 Market Overview
2.2 Regional Synopsis
2.3 Competitive Summary
3. Research Methodology
3.1 Top-Down Approach
3.2 Bottom-up Approach
3.3. Data Validation
3.4 Primary Interviews
4. Market Dynamics Impact Analysis
4.1 Market Driving Factors Analysis
4.1.2 Drivers
4.1.2 Restraints
4.1.3 Opportunities
4.1.4 Challenges
4.2 PESTLE Analysis
4.3 Porter’s Five Forces Model
5. Statistical Insights and Trends Reporting
5.1 Adoption Rates of Emerging Technologies
5.2 Environmental Impact Metrics
5.3 Volume Insights for the Underwater Robotics
5.4 Cost Analysis
6. Competitive Landscape
6.1 List of Major Companies, By Region
6.2 Market Share Analysis, By Region
6.3 Product Benchmarking
6.3.1 Product specifications and features
6.3.2 Pricing
6.4 Strategic Initiatives
6.4.1 Marketing and promotional activities
6.4.2 Distribution and supply chain strategies
6.4.3 Expansion plans and new product launches
6.4.4 Strategic partnerships and collaborations
6.5 Technological Advancements
6.6 Market Positioning and Branding
7. Underwater Robotics Market Segmentation, By Application
7.1 Chapter Overview
7.2 Defense & Security
7.2.1 Defense & Security Market Trends Analysis (2020-2032)
7.2.2 Defense & Security Market Size Estimates and Forecasts to 2032 (USD Billion)
7.3 Commercial Exploration
7.3.1 Commercial Exploration Market Trends Analysis (2020-2032)
7.3.2 Commercial Exploration Market Size Estimates and Forecasts to 2032 (USD Billion)
7.4 Scientific Research
7.4.1 Scientific Research Market Trends Analysis (2020-2032)
7.4.2 Scientific Research Market Size Estimates and Forecasts to 2032 (USD Billion)
7.5 Others
7.5.1 Others Market Trends Analysis (2020-2032)
7.5.2 Others Market Size Estimates and Forecasts to 2032 (USD Billion)
8. Underwater Robotics Market Segmentation, By Type
8.1 Chapter Overview
8.2 Remotely Operated Vehicle (ROV)
8.2.1 Remotely Operated Vehicle (ROV) Market Trends Analysis (2020-2032)
8.2.2 Remotely Operated Vehicle (ROV) Market Size Estimates and Forecasts to 2032 (USD Billion)
8.3 Autonomous Underwater Vehicles (AUV)
8.3.1 Autonomous Underwater Vehicles (AUV)Market Trends Analysis (2020-2032)
8.3.2 Autonomous Underwater Vehicles (AUV)Market Size Estimates and Forecasts to 2032 (USD Billion)
9. Regional Analysis
9.1 Chapter Overview
9.2 North America
9.2.1 Trends Analysis
9.2.2 North America Underwater Robotics Market Estimates and Forecasts, by Country (2020-2032) (USD Billion)
9.2.3 North America Underwater Robotics Market Estimates and Forecasts, By Application (2020-2032) (USD Billion)
9.2.4 North America Underwater Robotics Market Estimates and Forecasts, By Type (2020-2032) (USD Billion)
9.2.5 USA
9.2.5.1 USA Underwater Robotics Market Estimates and Forecasts, By Application (2020-2032) (USD Billion)
9.2.5.2 USA Underwater Robotics Market Estimates and Forecasts, By Type (2020-2032) (USD Billion)
9.2.6 Canada
9.2.6.1 Canada Underwater Robotics Market Estimates and Forecasts, By Application (2020-2032) (USD Billion)
9.2.6.2 Canada Underwater Robotics Market Estimates and Forecasts, By Type (2020-2032) (USD Billion)
9.2.7 Mexico
9.2.7.1 Mexico Underwater Robotics Market Estimates and Forecasts, By Application (2020-2032) (USD Billion)
9.2.7.2 Mexico Underwater Robotics Market Estimates and Forecasts, By Type (2020-2032) (USD Billion)
9.3 Europe
9.3.1 Eastern Europe
9.3.1.1 Trends Analysis
9.3.1.2 Eastern Europe Underwater Robotics Market Estimates and Forecasts, by Country (2020-2032) (USD Billion)
9.3.1.3 Eastern Europe Underwater Robotics Market Estimates and Forecasts, By Application (2020-2032) (USD Billion)
9.3.1.4 Eastern Europe Underwater Robotics Market Estimates and Forecasts, By Type (2020-2032) (USD Billion)
9.3.1.5 Poland
9.3.1.5.1 Poland Underwater Robotics Market Estimates and Forecasts, By Application (2020-2032) (USD Billion)
9.3.1.5.2 Poland Underwater Robotics Market Estimates and Forecasts, By Type (2020-2032) (USD Billion)
9.3.1.6 Romania
9.3.1.6.1 Romania Underwater Robotics Market Estimates and Forecasts, By Application (2020-2032) (USD Billion)
9.3.1.6.2 Romania Underwater Robotics Market Estimates and Forecasts, By Type (2020-2032) (USD Billion)
9.3.1.7 Hungary
9.3.1.7.1 Hungary Underwater Robotics Market Estimates and Forecasts, By Application (2020-2032) (USD Billion)
9.3.1.7.2 Hungary Underwater Robotics Market Estimates and Forecasts, By Type (2020-2032) (USD Billion)
9.3.1.8 Turkey
9.3.1.8.1 Turkey Underwater Robotics Market Estimates and Forecasts, By Application (2020-2032) (USD Billion)
9.3.1.8.2 Turkey Underwater Robotics Market Estimates and Forecasts, By Type (2020-2032) (USD Billion)
9.3.1.9 Rest of Eastern Europe
9.3.1.9.1 Rest of Eastern Europe Underwater Robotics Market Estimates and Forecasts, By Application (2020-2032) (USD Billion)
9.3.1.9.2 Rest of Eastern Europe Underwater Robotics Market Estimates and Forecasts, By Type (2020-2032) (USD Billion)
9.3.2 Western Europe
9.3.2.1 Trends Analysis
9.3.2.2 Western Europe Underwater Robotics Market Estimates and Forecasts, by Country (2020-2032) (USD Billion)
9.3.2.3 Western Europe Underwater Robotics Market Estimates and Forecasts, By Application (2020-2032) (USD Billion)
9.3.2.4 Western Europe Underwater Robotics Market Estimates and Forecasts, By Type (2020-2032) (USD Billion)
9.3.2.5 Germany
9.3.2.5.1 Germany Underwater Robotics Market Estimates and Forecasts, By Application (2020-2032) (USD Billion)
9.3.2.5.2 Germany Underwater Robotics Market Estimates and Forecasts, By Type (2020-2032) (USD Billion)
9.3.2.6 France
9.3.2.6.1 France Underwater Robotics Market Estimates and Forecasts, By Application (2020-2032) (USD Billion)
9.3.2.6.2 France Underwater Robotics Market Estimates and Forecasts, By Type (2020-2032) (USD Billion)
9.3.2.7 UK
9.3.2.7.1 UK Underwater Robotics Market Estimates and Forecasts, By Application (2020-2032) (USD Billion)
9.3.2.7.2 UK Underwater Robotics Market Estimates and Forecasts, By Type (2020-2032) (USD Billion)
9.3.2.8 Italy
9.3.2.8.1 Italy Underwater Robotics Market Estimates and Forecasts, By Application (2020-2032) (USD Billion)
9.3.2.8.2 Italy Underwater Robotics Market Estimates and Forecasts, By Type (2020-2032) (USD Billion)
9.3.2.9 Spain
9.3.2.9.1 Spain Underwater Robotics Market Estimates and Forecasts, By Application (2020-2032) (USD Billion)
9.3.2.9.2 Spain Underwater Robotics Market Estimates and Forecasts, By Type (2020-2032) (USD Billion)
9.3.2.10 Netherlands
9.3.2.10.1 Netherlands Underwater Robotics Market Estimates and Forecasts, By Application (2020-2032) (USD Billion)
9.3.2.10.2 Netherlands Underwater Robotics Market Estimates and Forecasts, By Type (2020-2032) (USD Billion)
9.3.2.11 Switzerland
9.3.2.11.1 Switzerland Underwater Robotics Market Estimates and Forecasts, By Application (2020-2032) (USD Billion)
9.3.2.11.2 Switzerland Underwater Robotics Market Estimates and Forecasts, By Type (2020-2032) (USD Billion)
9.3.2.12 Austria
9.3.2.12.1 Austria Underwater Robotics Market Estimates and Forecasts, By Application (2020-2032) (USD Billion)
9.3.2.12.2 Austria Underwater Robotics Market Estimates and Forecasts, By Type (2020-2032) (USD Billion)
9.3.2.13 Rest of Western Europe
9.3.2.13.1 Rest of Western Europe Underwater Robotics Market Estimates and Forecasts, By Application (2020-2032) (USD Billion)
9.3.2.13.2 Rest of Western Europe Underwater Robotics Market Estimates and Forecasts, By Type (2020-2032) (USD Billion)
9.4 Asia Pacific
9.4.1 Trends Analysis
9.4.2 Asia Pacific Underwater Robotics Market Estimates and Forecasts, by Country (2020-2032) (USD Billion)
9.4.3 Asia Pacific Underwater Robotics Market Estimates and Forecasts, By Application (2020-2032) (USD Billion)
9.4.4 Asia Pacific Underwater Robotics Market Estimates and Forecasts, By Type (2020-2032) (USD Billion)
9.4.5 China
9.4.5.1 China Underwater Robotics Market Estimates and Forecasts, By Application (2020-2032) (USD Billion)
9.4.5.2 China Underwater Robotics Market Estimates and Forecasts, By Type (2020-2032) (USD Billion)
9.4.6 India
9.4.5.1 India Underwater Robotics Market Estimates and Forecasts, By Application (2020-2032) (USD Billion)
9.4.5.2 India Underwater Robotics Market Estimates and Forecasts, By Type (2020-2032) (USD Billion)
9.4.5 Japan
9.4.5.1 Japan Underwater Robotics Market Estimates and Forecasts, By Application (2020-2032) (USD Billion)
9.4.5.2 Japan Underwater Robotics Market Estimates and Forecasts, By Type (2020-2032) (USD Billion)
9.4.6 South Korea
9.4.6.1 South Korea Underwater Robotics Market Estimates and Forecasts, By Application (2020-2032) (USD Billion)
9.4.6.2 South Korea Underwater Robotics Market Estimates and Forecasts, By Type (2020-2032) (USD Billion)
9.4.7 Vietnam
9.4.7.1 Vietnam Underwater Robotics Market Estimates and Forecasts, By Application (2020-2032) (USD Billion)
9.2.7.2 Vietnam Underwater Robotics Market Estimates and Forecasts, By Type (2020-2032) (USD Billion)
9.4.8 Singapore
9.4.8.1 Singapore Underwater Robotics Market Estimates and Forecasts, By Application (2020-2032) (USD Billion)
9.4.8.2 Singapore Underwater Robotics Market Estimates and Forecasts, By Type (2020-2032) (USD Billion)
9.4.9 Australia
9.4.9.1 Australia Underwater Robotics Market Estimates and Forecasts, By Application (2020-2032) (USD Billion)
9.4.9.2 Australia Underwater Robotics Market Estimates and Forecasts, By Type (2020-2032) (USD Billion)
9.4.10 Rest of Asia Pacific
9.4.10.1 Rest of Asia Pacific Underwater Robotics Market Estimates and Forecasts, By Application (2020-2032) (USD Billion)
9.4.10.2 Rest of Asia Pacific Underwater Robotics Market Estimates and Forecasts, By Type (2020-2032) (USD Billion)
9.5 Middle East and Africa
9.5.1 Middle East
9.5.1.1 Trends Analysis
9.5.1.2 Middle East Underwater Robotics Market Estimates and Forecasts, by Country (2020-2032) (USD Billion)
9.5.1.3 Middle East Underwater Robotics Market Estimates and Forecasts, By Application (2020-2032) (USD Billion)
9.5.1.4 Middle East Underwater Robotics Market Estimates and Forecasts, By Type (2020-2032) (USD Billion)
9.5.1.5 UAE
9.5.1.5.1 UAE Underwater Robotics Market Estimates and Forecasts, By Application (2020-2032) (USD Billion)
9.5.1.5.2 UAE Underwater Robotics Market Estimates and Forecasts, By Type (2020-2032) (USD Billion)
9.5.1.6 Egypt
9.5.1.6.1 Egypt Underwater Robotics Market Estimates and Forecasts, By Application (2020-2032) (USD Billion)
9.5.1.6.2 Egypt Underwater Robotics Market Estimates and Forecasts, By Type (2020-2032) (USD Billion)
9.5.1.7 Saudi Arabia
9.5.1.7.1 Saudi Arabia Underwater Robotics Market Estimates and Forecasts, By Application (2020-2032) (USD Billion)
9.5.1.7.2 Saudi Arabia Underwater Robotics Market Estimates and Forecasts, By Type (2020-2032) (USD Billion)
9.5.1.8 Qatar
9.5.1.8.1 Qatar Underwater Robotics Market Estimates and Forecasts, By Application (2020-2032) (USD Billion)
9.5.1.8.2 Qatar Underwater Robotics Market Estimates and Forecasts, By Type (2020-2032) (USD Billion)
9.5.1.9 Rest of Middle East
9.5.1.9.1 Rest of Middle East Underwater Robotics Market Estimates and Forecasts, By Application (2020-2032) (USD Billion)
9.5.1.9.2 Rest of Middle East Underwater Robotics Market Estimates and Forecasts, By Type (2020-2032) (USD Billion)
9.5.2 Africa
9.5.2.1 Trends Analysis
9.5.2.2 Africa Underwater Robotics Market Estimates and Forecasts, by Country (2020-2032) (USD Billion)
9.5.2.3 Africa Underwater Robotics Market Estimates and Forecasts, By Application (2020-2032) (USD Billion)
9.5.2.4 Africa Underwater Robotics Market Estimates and Forecasts, By Type (2020-2032) (USD Billion)
9.5.2.5 South Africa
9.5.2.5.1 South Africa Underwater Robotics Market Estimates and Forecasts, By Application (2020-2032) (USD Billion)
9.5.2.5.2 South Africa Underwater Robotics Market Estimates and Forecasts, By Type (2020-2032) (USD Billion)
9.5.2.6 Nigeria
9.5.2.6.1 Nigeria Underwater Robotics Market Estimates and Forecasts, By Application (2020-2032) (USD Billion)
9.5.2.6.2 Nigeria Underwater Robotics Market Estimates and Forecasts, By Type (2020-2032) (USD Billion)
9.5.2.7 Rest of Africa
9.5.2.7.1 Rest of Africa Underwater Robotics Market Estimates and Forecasts, By Application (2020-2032) (USD Billion)
9.5.2.7.2 Rest of Africa Underwater Robotics Market Estimates and Forecasts, By Type (2020-2032) (USD Billion)
9.6 Latin America
9.6.1 Trends Analysis
9.6.2 Latin America Underwater Robotics Market Estimates and Forecasts, by Country (2020-2032) (USD Billion)
9.6.3 Latin America Underwater Robotics Market Estimates and Forecasts, By Application (2020-2032) (USD Billion)
9.6.4 Latin America Underwater Robotics Market Estimates and Forecasts, By Type (2020-2032) (USD Billion)
9.6.5 Brazil
9.6.5.1 Brazil Underwater Robotics Market Estimates and Forecasts, By Application (2020-2032) (USD Billion)
9.6.5.2 Brazil Underwater Robotics Market Estimates and Forecasts, By Type (2020-2032) (USD Billion)
9.6.6 Argentina
9.6.6.1 Argentina Underwater Robotics Market Estimates and Forecasts, By Application (2020-2032) (USD Billion)
9.6.6.2 Argentina Underwater Robotics Market Estimates and Forecasts, By Type (2020-2032) (USD Billion)
9.6.7 Colombia
9.6.7.1 Colombia Underwater Robotics Market Estimates and Forecasts, By Application (2020-2032) (USD Billion)
9.6.7.2 Colombia Underwater Robotics Market Estimates and Forecasts, By Type (2020-2032) (USD Billion)
9.6.8 Rest of Latin America
9.6.8.1 Rest of Latin America Underwater Robotics Market Estimates and Forecasts, By Application (2020-2032) (USD Billion)
9.6.8.2 Rest of Latin America Underwater Robotics Market Estimates and Forecasts, By Type (2020-2032) (USD Billion)
10. Company Profiles
10.1 ATLAS MARIDAN Aps
10.1.1 Company Overview
10.1.2 Financial
10.1.3 Products/ Services Offered
10.1.4 SWOT Analysis
10.2 Deep Ocean Engineering, Inc.
10.2.1 Company Overview
10.2.2 Financial
10.2.3 Products/ Services Offered
10.2.4 SWOT Analysis
10.3 General Dynamics Mission Systems, Inc.
10.3.1 Company Overview
10.3.2 Financial
10.3.3 Products/ Services Offered
10.3.4 SWOT Analysis
10.4 ECA GROUP
10.4.1 Company Overview
10.4.2 Financial
10.4.3 Products/ Services Offered
10.4.4 SWOT Analysis
10.5 International Submarine Engineering Limited
10.5.1 Company Overview
10.5.2 Financial
10.5.3 Products/ Services Offered
10.5.4 SWOT Analysis
10.6 Eddyfi Technologies
10.6.1 Company Overview
10.6.2 Financial
10.6.3 Products/ Services Offered
10.6.4 SWOT Analysis
10.7 Oceaneering International, Inc.
10.7.1 Company Overview
10.7.2 Financial
10.7.3 Products/ Services Offered
10.7.4 SWOT Analysis
10.8 Saab AB
10.8.1 Company Overview
10.8.2 Financial
10.8.3 Products/ Services Offered
10.8.4 SWOT Analysis
10.9 TechnipFMC plc
10.9.1 Company Overview
10.9.2 Financial
10.9.3 Products/ Services Offered
10.9.4 SWOT Analysis
10.10 Soil Machine Dynamics Ltd.
10.10.1 Company Overview
10.10.2 Financial
10.10.3 Products/ Services Offered
10.10.4 SWOT Analysis
11. Use Cases and Best Practices
12. Conclusion
An accurate research report requires proper strategizing as well as implementation. There are multiple factors involved in the completion of good and accurate research report and selecting the best methodology to compete the research is the toughest part. Since the research reports we provide play a crucial role in any company’s decision-making process, therefore we at SNS Insider always believe that we should choose the best method which gives us results closer to reality. This allows us to reach at a stage wherein we can provide our clients best and accurate investment to output ratio.
Each report that we prepare takes a timeframe of 350-400 business hours for production. Starting from the selection of titles through a couple of in-depth brain storming session to the final QC process before uploading our titles on our website we dedicate around 350 working hours. The titles are selected based on their current market cap and the foreseen CAGR and growth.
The 5 steps process:
Step 1: Secondary Research:
Secondary Research or Desk Research is as the name suggests is a research process wherein, we collect data through the readily available information. In this process we use various paid and unpaid databases which our team has access to and gather data through the same. This includes examining of listed companies’ annual reports, Journals, SEC filling etc. Apart from this our team has access to various associations across the globe across different industries. Lastly, we have exchange relationships with various university as well as individual libraries.
Step 2: Primary Research
When we talk about primary research, it is a type of study in which the researchers collect relevant data samples directly, rather than relying on previously collected data. This type of research is focused on gaining content specific facts that can be sued to solve specific problems. Since the collected data is fresh and first hand therefore it makes the study more accurate and genuine.
We at SNS Insider have divided Primary Research into 2 parts.
Part 1 wherein we interview the KOLs of major players as well as the upcoming ones across various geographic regions. This allows us to have their view over the market scenario and acts as an important tool to come closer to the accurate market numbers. As many as 45 paid and unpaid primary interviews are taken from both the demand and supply side of the industry to make sure we land at an accurate judgement and analysis of the market.
This step involves the triangulation of data wherein our team analyses the interview transcripts, online survey responses and observation of on filed participants. The below mentioned chart should give a better understanding of the part 1 of the primary interview.
Part 2: In this part of primary research the data collected via secondary research and the part 1 of the primary research is validated with the interviews from individual consultants and subject matter experts.
Consultants are those set of people who have at least 12 years of experience and expertise within the industry whereas Subject Matter Experts are those with at least 15 years of experience behind their back within the same space. The data with the help of two main processes i.e., FGDs (Focused Group Discussions) and IDs (Individual Discussions). This gives us a 3rd party nonbiased primary view of the market scenario making it a more dependable one while collation of the data pointers.
Step 3: Data Bank Validation
Once all the information is collected via primary and secondary sources, we run that information for data validation. At our intelligence centre our research heads track a lot of information related to the market which includes the quarterly reports, the daily stock prices, and other relevant information. Our data bank server gets updated every fortnight and that is how the information which we collected using our primary and secondary information is revalidated in real time.
Step 4: QA/QC Process
After all the data collection and validation our team does a final level of quality check and quality assurance to get rid of any unwanted or undesired mistakes. This might include but not limited to getting rid of the any typos, duplication of numbers or missing of any important information. The people involved in this process include technical content writers, research heads and graphics people. Once this process is completed the title gets uploader on our platform for our clients to read it.
Step 5: Final QC/QA Process:
This is the last process and comes when the client has ordered the study. In this process a final QA/QC is done before the study is emailed to the client. Since we believe in giving our clients a good experience of our research studies, therefore, to make sure that we do not lack at our end in any way humanly possible we do a final round of quality check and then dispatch the study to the client.
Key Market Segments:
By Type
Remotely Operated Vehicle (ROV)
Autonomous Underwater Vehicles (AUV)
By Application
Defense & Security
Commercial Exploration
Scientific Research
Others
Request for Segment Customization as per your Business Requirement: Segment Customization Request
Regional Coverage:
North America
US
Canada
Mexico
Europe
Eastern Europe
Poland
Romania
Hungary
Turkey
Rest of Eastern Europe
Western Europe
Germany
France
UK
Italy
Spain
Netherlands
Switzerland
Austria
Rest of Western Europe
Asia Pacific
China
India
Japan
South Korea
Vietnam
Singapore
Australia
Rest of Asia Pacific
Middle East & Africa
Middle East
UAE
Egypt
Saudi Arabia
Qatar
Rest of the Middle East
Africa
Nigeria
South Africa
Rest of Africa
Latin America
Brazil
Argentina
Colombia
Rest of Latin America
Request for Country Level Research Report: Country Level Customization Request
Available Customization
With the given market data, SNS Insider offers customization as per the company’s specific needs. The following customization options are available for the report:
Product Analysis
Criss-Cross segment analysis (e.g. Product X Application)
Product Matrix which gives a detailed comparison of the product portfolio of each company
Geographic Analysis
Additional countries in any of the regions
Company Information
Detailed analysis and profiling of additional market players (Up to five)
The RFID Tags Market Size was valued at USD 12.42 Billion in 2023 and is expected to grow at a CAGR of 9.91% to reach USD 29.05 Billion by 2032.
The Camera Modules Market Size was valued at USD 43.1 billion in 2023 and is expected to reach USD 99.16 billion by 2032 and grow at a CAGR of 9.7% over the forecast period 2024-2032.
The Arc-based Plasma Lighting Market was valued at USD 0.61 billion in 2023 and is projected to reach USD 0.75 billion by 2032, growing at a CAGR of 2.38% from 2024 to 2032
The Precision Farming Market Size was valued at USD 10.35 billion in 2023 and is expected to grow at a CAGR of 12.24% to grow to USD 29.25 billion by 2032.
The SiC Power Device Market was valued at USD 2.5 Billion in 2023 and is expected to reach USD 12.9 Billion by 2032, growing at a CAGR of 19.74% from 2024-2032.
RFID Readers Market was valued at USD 14.06 billion in 2023 and is expected to reach USD 36.89 billion by 2032, growing at a CAGR of 11.37% from 2024-2032.
Hi! Click one of our member below to chat on Phone