Tumor Profiling Market Size & Overview:
The Tumor Profiling Market was valued at USD 11.55 billion in 2024 and is expected to reach USD 24.84 billion by 2032, growing at a CAGR of 10.04% from 2025-2032.
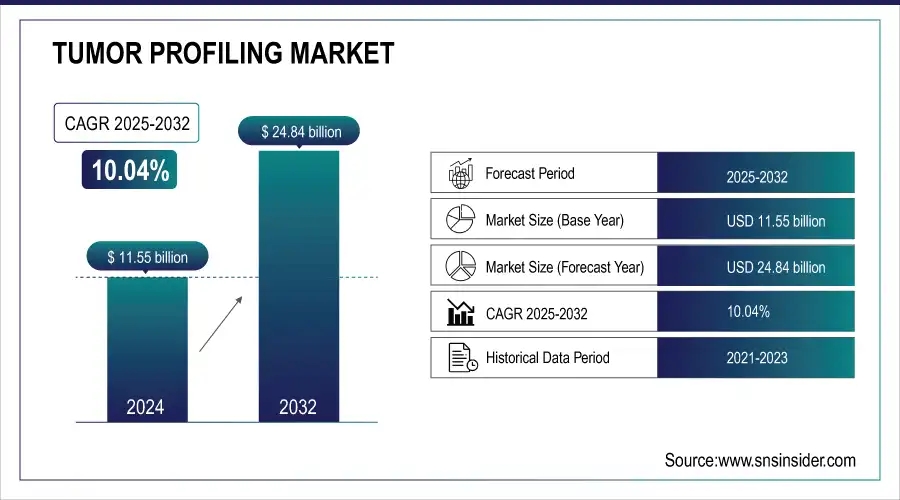
To get more information on Tumor Profiling Market - Request Free Sample Report
The Tumor Profiling Market report anticipates cancer incidence and prevalence and the adoption of tumor profiling technologies in clinical and research settings conveniently. It analyzes trends in drug volume and biomarker utilization, and describes patterns in pharmaceutical production and biomarker-driven diagnostics. The report also covers healthcare spending on tumor profiling, government, private, and out-of-pocket expenditures. It examines drug volume and biomarker usage trends, highlighting pharmaceutical production and biomarker-driven diagnostics. It also discusses regulatory approvals and compliance trends along with technological advancements related to AI-based diagnostics, NGS as well as multi-omics profiling. As such, these insights present a holistic picture of the market growth, investment opportunities, user growth, or other developments that will take place in the future. Accurate tumor profiling is of great importance to allow personalized treatment as a result of the global increase in the incidence of cancer. In fiscal year 2023, the U.S. National Institutes of Health (NIH) disbursed USD 6.9 billion in cancer research funding roughly a USD 800 million increase over the previous year. Growing emphasis on precision oncology and targeted therapies is driving the Increased demand for advanced technologies and services for tumor profiling.
Tumor Profiling Market Trends
-
Rising prevalence of cancer is driving demand for tumor profiling solutions.
-
Advances in genomics, next-generation sequencing (NGS), and molecular diagnostics are enhancing accuracy and personalization.
-
Integration with AI and bioinformatics is improving data analysis and treatment recommendations.
-
Growing focus on precision oncology and targeted therapies is boosting market adoption.
-
Expansion of clinical trials and research initiatives is accelerating innovation in tumor profiling.
-
Collaborations between biotech firms, diagnostic companies, and healthcare providers are fostering new solutions.
-
Supportive regulatory frameworks and increasing awareness among oncologists and patients are promoting wider adoption.
Tumor Profiling Market Growth Drivers:
-
Technological advancements in diagnostics, such as next-generation sequencing (NGS) and liquid biopsies, have enhanced the accuracy and efficiency of tumor profiling.
Recent innovations in diagnostics, especially NGS and liquid biopsy technologies, are greatly improving the efficiency and accuracy of tumor profiling. A 2024 publication in the Journal of Clinical Oncology showed that 75.6% of U.S. oncologists use NGS for patients with advanced cancers, demonstrating its incorporation as standard oncologic practice. Since NGS presents the foundation of the molecular characterization of malignant tumors based on tissue or blood samples, it also allows for the identification of actionable biomarkers. A follow-up study of NGS testing showed that 67.7% of patients had identifiable biomarkers, of which 47.2% had an FDA-targeted therapy, and 77.3% were eligible for clinical trials. This underlines the decisive role of NGS in the personalization of treatment strategies and the extension of therapeutic options. Methods of liquid biopsies have also accelerated, providing a non-invasive approach compared to tissue biopsies. For instance, Novigenix unveiled a multimodal liquid biopsy approach that combines mRNA immune profiling with cell-free DNA analysis. The technique offers a broad perspective of tumor and immune signals, which can enhance predictive capabilities and patient outcome estimates.
Tumor Profiling Market Restraints:
-
High costs associated with advanced tumor profiling tests can limit accessibility, especially in low- and middle-income countries.
The high costs of advanced tumor profiling tests remain a major barrier the lack of awareness and skills, as well as the costs of advanced tumor profiling tests and low and moderate-income countries. For example, the MammaPrint assay, which estimates breast cancer recurrence risk, costs around USD 4,200 in the US and EUR 2,675 in Europe. Likewise, precision cancer diagnostic tests such as FoundationOne CDx and Guardant360 cost $5,000 to $6,500 per biopsy. As a result, these costs can be a barrier for patients and healthcare systems, restricting access to personalized cancer diagnostics. More affordable alternatives are also on the horizon, such as the Mionco blood test which is thought to be priced between £120 and £300, although it is currently still under development but few are widely available. Continued high prices of tumor profiling highlight the potential benefit of more affordable alternatives to ensure access to personalized cancer medicine to a cardinal population.
Tumor Profiling Market Opportunities:
-
Integration of artificial intelligence (AI) and big data analytics in profiling enhances data analysis, leading to more precise diagnostics and personalized treatment plans.
The integration of artificial intelligence (AI) and big data analytics into tumor profiling presents a significant opportunity to enhance cancer diagnostics and treatment personalization. Recent advancements have demonstrated AI's potential to improve diagnostic accuracy and efficiency across various cancer types. For example, at EDX Medical, scientists there have created a "super test" for prostate cancer that uses AI to interpret more than 100 markers from blood and urine samples. Because of this, this method has reached up to a 96% accurate rate for diagnosis compared to the traditional PSA test of only around 50%. The AI-driven analysis considers multiple factors, including PSA levels, proteins, and DNA mutations, providing a comprehensive assessment of prostate cancer risk. These developments highlight the game-changing nature of AI and big data analytics in the tumor profiling landscape. The integration of AI in oncology not only addresses this pressing need but also holds potential for improving patient outcomes through its capacity to refine diagnostic precision and facilitate individualized treatment approaches, thus streamlining healthcare provision.
Tumor Profiling Market Challenge:
-
Lack of standardization in tumor profiling methodologies leads to variability in results, affecting the reliability and comparability of data.
The lack of standardization in tumor profiling methodologies presents a significant challenge in oncology. Differences in techniques, interpretation of data, and reporting protocols can result in inconsistent outcomes, increasing difficulty in making clinical decisions. One of the major reasons for this variability is tissue heterogeneity tumors often consist of several different subclones and different types of cells, including immune cells, having an impact on gene expression data. Studies have estimated that 1–40% of publicly available gene-expression datasets are affected by tissue heterogeneity, specific to the tissue of origin. Other data including genomics, proteomics, and metabolomics will be necessary for an in-depth understanding of tumor biology. The absence of standardized methods by which data will be integrated and interpreted presents a challenge, raising the possibility that the potential of clinical applications may differ.
Tumor Profiling Market Segment Analysis
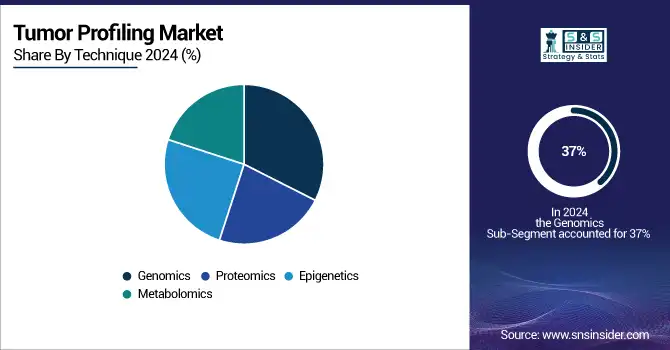
By Technique, Genomics application segment led in 2024 with 37% revenue share.
The genomics application segment accounted for 37% of the total revenue share, leading the tumor profiling market in 2024. The primary factors contributing to this sizeable market share are the rising technological advancements in genomic sequencing and its growing adoption in clinical oncology. According to the U.S. National Human Genome Research Institute, the cost of sequencing a human genome went from USD 100 million in 2001 to under USD 1,000 in 2023, opening the door for genomic profiling for cancer patients. Moreover, governmental efforts in realizing precision medicine further endorse genomics as a dominant factor in tumor profiling.
As one example, the Genomic Data Commons at the U.S. National Cancer Institute has gathered genomic data from over 65,000 cancer patients through the year 2023, enabling research and clinical-based applications. Moreover, the impetus for genomic profiling in oncology has been strengthened by the European Union's "1+ Million Genomes" initiative to provide access to at least 1 million sequenced genomes for research by 2025.
As of 2023, the FDA has approved over 90 companion diagnostic devices, many of which rely on genomic profiling techniques. This trend proves the next-gen sequencing is critical in directing personalized care and very rapidly became the most preferred technology in the tumor profiling industry.
By Technology, Sequencing segment dominated in 2024 with 30% revenue share.
In 2024, sequencing was the leading segment in terms of revenue share of the tumor profiling market, accounting for 30.0%. This leadership position is largely a result of rapid advances in next-generation sequencing (NGS) technologies and their wide implementation in cancer diagnostics and research. The U.S. National Cancer Institute's Cancer Genome Atlas (TCGA) program has sequenced and analyzed over 20,000 primary cancer and matched normal samples across 33 cancer types, showcasing the power and scalability of sequencing technologies to perform tumor profiling. Advocacy from the government has been important in fostering the adoption of sequencing technology in both cancer research and clinical contexts.
For example, the United Kingdom’s 100,000 Genomes Project, which was completed in 2018, resulted in the incorporation of whole genome sequencing into the National Health Service (NHS) for cancer patients. In 2023, the NHS has committed to sequencing 500,000 as whole genomes by 2025, accelerating the implementation of sequencing technologies in oncological practice.
The dominance of sequencing techniques is also reflected in the increasing number of FDA-approved NGS-based companion diagnostic tests. As of 2023, the FDA has approved multiple NGS panels for comprehensive genomic profiling in cancer, enabling the simultaneous detection of multiple biomarkers to guide treatment decisions. The ongoing transition toward the use of multi-gene panel testing as well as comprehensive genomic profiling has established sequencing methods as the dominant technology in the area of tumor profiling.
By Application, Personalized cancer medicine segment led in 2024 with 41% revenue share.
In 2024, personalized cancer medicine had the largest share of the tumor profiling market at 41% of total revenues. This substantial market share is attributed to the rising focus on precision oncology and the growing implementation of targeted therapies specific to the tumor profile. Over 75 targeted cancer therapies have won FDA approval in the US alone as of 2023, showing how personalized approaches are changing cancer treatment.
Government efforts to drive personalized cancer medicine Genomics and personalized treatment approaches have also received large amounts of funding for example, the U. S. National Cancer Institute established the Precision Medicine Initiative, which devoted significant resources to genomic research and personalized treatment strategies. As of 2023, this project has funded more than 1,000 clinical trials examining targeted therapies and immunotherapies.
Tumor Profiling Market Regional Analysis
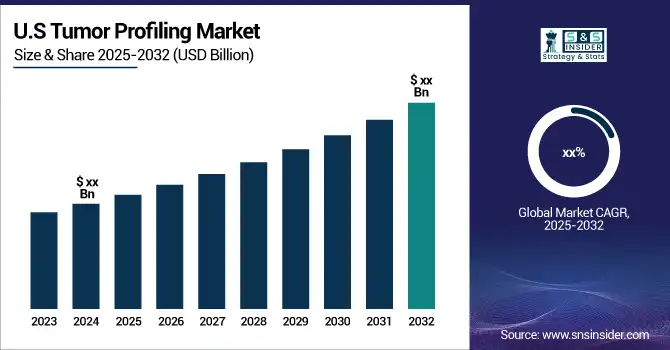
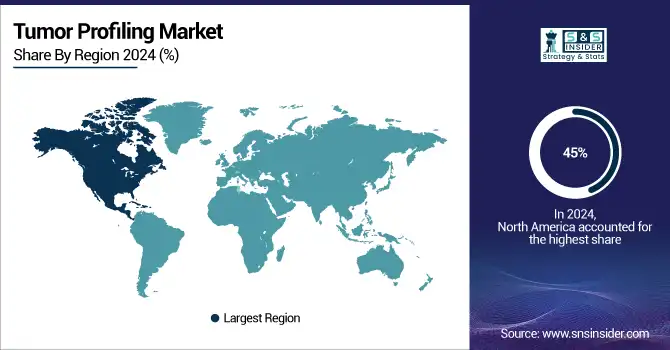
North America Tumor Profiling Market Insights
North America dominated the tumor profiling market in 2024, accounting for approximately 45% of the global market share. The region has a strong and sophisticated healthcare infrastructure, a high adoption rate of precision medicine techniques, and a concerted effort and investment into cancer research, which can be credited with its leadership position. The USA National Cancer Institute, which for fiscal year 2023 had an annual budget of USD 7.1 billion.
Get Customized Report as per Your Business Requirement - Enquiry Now
Asia Pacific Tumor Profiling Market Insights
Asia-Pacific is poised for productive growth in terms of CAGR as per the forecast period owing to factors like rising health care expenditure, increasing prevalence of cancer and growing awareness regarding personalized medicine. The Asia-Pacific region represented 48.4% of new cancer cases globally in 2020, according to the World Health Organization. The high cancer burden has led the governments in the region to put large investments in cancer research and precision medicine efforts. For instance, China's Precision Medicine Initiative, launched in 2016, aims to invest $9.2 billion in genomics research and personalized medicine by 2030.
Europe Tumor Profiling Market Insights
Europe holds a prominent position in the tumor profiling market, driven by advanced healthcare infrastructure, rising cancer prevalence, and increasing adoption of precision medicine. The region benefits from strong research and development activities, government initiatives supporting genomic testing, and well-established diagnostic laboratories. Growing awareness among healthcare professionals and patients, coupled with technological advancements in next-generation sequencing and biomarker analysis, is further accelerating the demand for tumor profiling solutions across Europe.
Middle East & Africa and Latin America Tumor Profiling Market Insights
The Middle East & Africa and Latin America tumor profiling markets are experiencing steady growth, fueled by rising cancer incidence, expanding healthcare infrastructure, and increasing awareness of precision medicine. Adoption of advanced diagnostic technologies, government initiatives for cancer management, and growing investments in molecular diagnostics are driving market expansion. Limited access to advanced testing and ongoing education for healthcare providers present opportunities for further development in these regions.
Tumor Profiling Market Competitive Landscape:
Illumina
Illumina, founded in 1998, is a global leader in genomic sequencing and tumor profiling, offering advanced solutions for cancer diagnostics and precision medicine. Its technologies, including next-generation sequencing and comprehensive genomic profiling tests, enable clinicians to identify actionable mutations, guide targeted therapies, and monitor disease progression. Illumina’s innovative platforms support research, clinical applications, and noninvasive liquid biopsies, driving growth and adoption in the tumor profiling market worldwide.
-
2025: Illumina partnered with Tempus to integrate genomic AI into cancer profiling workflows, enhancing precision treatment selection with advanced molecular insights.
-
2025: Illumina expanded its clinical oncology portfolio in Japan with approval of the Comprehensive Genomic Profiling Test for Cancer, advancing precision care access.
-
2024: Illumina and Janssen began developing a novel whole-genome minimal residual disease (MRD) assay using circulating tumor DNA for sensitive detection of cancer recurrence.
-
2023: Illumina released TSO 500 ctDNA v2, a pan-cancer liquid biopsy assay profiling 523 tumor biomarkers, broadening noninvasive cancer diagnostics.
Guardant Health
Guardant Health, founded in 2012, is a leading precision oncology company specializing in liquid biopsy and tumor profiling solutions. Its platforms, including Guardant360, enable noninvasive genomic testing to guide targeted therapies, monitor treatment response, and detect minimal residual disease. Guardant Health focuses on integrating multiomic analysis, AI-driven insights, and rapid turnaround times to enhance personalized cancer care and improve outcomes for patients worldwide.
-
2025; Guardant Health launched Guardant360® Tissue, the first multiomic tissue test combining DNA, RNA, methylation, and AI-powered PD-L1 analysis, requiring 40% fewer slides for broader patient access.
-
2024: Guardant Health introduced Guardant360 TissueNext, profiling nearly 500 actionable tumor biomarkers to support treatment strategies for advanced cancer patients in under two weeks.
Key Players:
Some of the Tumor Profiling Market Companies
-
Illumina, Inc. – [NovaSeq 6000, TruSight Oncology 500]
-
QIAGEN N.V. – [QIAseq Targeted DNA Panels, QIAamp DNA FFPE Tissue Kit]
-
NeoGenomics Laboratories, Inc. – [NeoTYPE Cancer Profiles, InVisionFirst-Lung]
-
Sysmex Corporation – [OncoBEAM RAS CRC Kit, Plasma-Safe-SeqS]
-
HTG Molecular Diagnostics, Inc. – [HTG EdgeSeq Oncology Biomarker Panel, HTG EdgeSeq Precision Immuno-Oncology Panel]
-
Predictive Oncology – [PeDAL (Patient-derived Ex Vivo Drug Testing), TumorGenesis Media]
-
Caris Life Sciences – [MI Profile, MI Exome]
-
NanoString Technologies, Inc. – [nCounter Analysis System, GeoMx Digital Spatial Profiler]
-
Guardant Health, Inc. – [Guardant360, Guardant Reveal]
-
Foundation Medicine – [FoundationOne CDx, FoundationOne Liquid CDx]
-
F. Hoffmann-La Roche Ltd. – [AVENIO ctDNA Analysis Kits, Cobas EGFR Mutation Test]
-
Thermo Fisher Scientific Inc. – [Oncomine Comprehensive Assay, Ion AmpliSeq Cancer Hotspot Panel]
-
GenScript Biotech Corporation – [GenScript ProBio Cell Line Development, GenScript Gene Synthesis Services]
-
Tempus Labs – [Tempus xT, Tempus xF]
-
Hologic, Inc. – [Aptima HPV Assay, Cervista HPV HR Test]
-
Exact Sciences – [Oncotype DX, Cologuard]
-
Personalis, Inc. – [NeXT Platform, ACE ImmunoID]
-
Boreal Genomics, Inc. – [OnTarget, Aurora]
-
Strand Life Sciences – [StrandAdvantage, StrandOmics]
-
Lucence Health, Inc. – [LiquidHALLMARK, AmpliMARK]
| Report Attributes | Details |
|---|---|
|
Market Size in 2024 |
USD 10.5 Billion |
|
Market Size by 2032 |
USD 24.8 Billion |
|
CAGR |
CAGR of 10.04% From 2025 to 2032 |
|
Base Year |
2024 |
|
Forecast Period |
2025-2032 |
|
Historical Data |
2021-2023 |
|
Report Scope & Coverage |
Market Size, Segments Analysis, Competitive Landscape, Regional Analysis, DROC & SWOT Analysis, Forecast Outlook |
|
Key Segments |
• By Technique (Genomics, Proteomics, Epigenetics, Metabolomics) |
|
Regional Analysis/Coverage |
North America (US, Canada, Mexico), Europe (Eastern Europe [Poland, Romania, Hungary, Turkey, Rest of Eastern Europe] Western Europe] Germany, France, UK, Italy, Spain, Netherlands, Switzerland, Austria, Rest of Western Europe]), Asia Pacific (China, India, Japan, South Korea, Vietnam, Singapore, Australia, Rest of Asia Pacific), Middle East & Africa (Middle East [UAE, Egypt, Saudi Arabia, Qatar, Rest of Middle East], Africa [Nigeria, South Africa, Rest of Africa], Latin America (Brazil, Argentina, Colombia, Rest of Latin America) |
|
Company Profiles |
Illumina, QIAGEN, NeoGenomics Laboratories, Sysmex Corporation, HTG Molecular Diagnostics, Predictive Oncology, Caris Life Sciences, NanoString Technologies, Guardant Health, Foundation Medicine, F. Hoffmann-La Roche, Thermo Fisher Scientific, GenScript Biotech, Tempus Labs, Hologic, Exact Sciences, Personalis, Boreal Genomics, Strand Life Sciences, Lucence Health |
