image

Trocars Market Size & Overview:

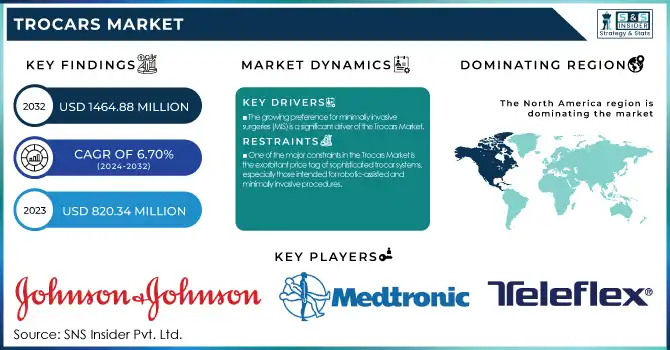
The Trocars Market was valued at USD 820.34 million in 2023 and is expected to reach USD 1464.88 million by 2032, growing at a CAGR of 6.70% from 2024 to 2032.

Trocars Market Revenue Analysis

To Get more information on Trocars Market - Request Free Sample Report

The Trocars Market Report provides unique insights into volumes of surgical procedures, with regional differences in laparoscopic uptake in general, gynecological, and bariatric surgery. It presents trocar usage rates by application and region, with differences in device preference and penetration. The report also includes a detailed analysis of trocar sales volume trends, with a focus on changes fueled by technology and surgical innovation. It also provides a meticulous segmentation of the expenditure of healthcare on laparoscopic devices by payers—government, commercial, private, and out-of-pocket—providing an unparalleled view of budgetary expenditure and procurement practices in different healthcare systems.

Trocars Market Dynamics

Drivers

  • The growing preference for minimally invasive surgeries (MIS) is a significant driver of the Trocars Market.

The increasing demand for minimally invasive surgeries (MIS) is a key growth driver for the Trocars Market. With patients and medical professionals looking for less recovery time, less postoperative pain, and less scarring, the need for laparoscopic and robotic-assisted surgeries is on the rise. As per the American Society of Anesthesiologists, more than 13 million laparoscopic procedures are carried out every year globally, with an increasing trend seen in gastrointestinal, gynecological, and urological procedures. Furthermore, technological innovation in trocar design, e.g., bladeless and optical trocars, has enhanced safety and efficiency, continuing to drive adoption. Recent advancements, including artificial intelligence-powered surgical robots and disposable trocars with reduced infection risks, have also driven market growth. Post-pandemic increases in elective surgeries, along with growing healthcare access in developing countries, continue to propel trocar demand worldwide.

  • Increasing prevalence of chronic diseases requiring surgical intervention, accelerating the market to grow.

The increasing incidence of chronic diseases, including obesity, cancer, and gastrointestinal diseases, is largely increasing the demand for trocars. The World Health Organization (WHO) estimates that cancer cases are likely to increase by 47% worldwide by 2040, which in turn will raise diagnostic and therapeutic laparoscopic procedures. Correspondingly, an increased rate of gallbladder ailments and hernias has propelled a demand for minimally invasive procedures involving the use of trocars for careful instrument entry. For bariatric procedures that have witnessed an increase in demand by 20% over the last five years, trocars specifically designed to serve to ensure procedure efficacy and safety. New technologies, including antimicrobial-coated trocars to reduce infection rates and integration into robotic surgery systems, add to their embrace in contemporary surgical techniques.                                                                 

Restraint

  • One of the major constraints in the Trocars Market is the exorbitant price tag of sophisticated trocar systems, especially those intended for robotic-assisted and minimally invasive procedures.

Disposable trocars, though minimizing infection rates, add to procedural costs, restricting their use in cost-conscious markets. Reusable trocars, however, need rigorous sterilization procedures to avoid cross-contamination, adding to operational costs for healthcare institutions. The estimates in the industry show that the costs of laparoscopic procedures may be 50% above that of traditional open procedures, due in part to the pricey disposable equipment necessary. Moreover, rigid regulatory expectations of surgical tool sterilization and patient protection only serve to increase the difficulty in deploying high-level trocars to large numbers. Developing countries mostly show this barrier through budget restrictions and limited accessibility of advanced laparoscopic instruments, thus suppressing growth in the market.

Opportunities

  • The growing uptake of robot-assisted surgeries is a great opportunity for the trocars market.

With advances in minimally invasive surgical methods, robot-assisted procedures are gaining popularity because of their precision, minimal recovery time, and better patient results. Robot-assisted surgeries represented more than 15% of all minimally invasive surgeries in 2023, with consistent year-to-year growth, as per industry reports. There is increased demand for dedicated trocars compatible with robotic platforms, like bladeless and optical trocars, as surgical centers and hospitals acquire robotic platforms. There is increased concentration by firms in the design of trocars that have high maneuverability and minimal tissue damage to keep pace with robotic surgery demands. With the increasing use of robotic surgeries in general, gynecologic, and urologic surgeries, the use of technologically sophisticated trocars is likely to grow, stimulating market growth.

Challenges

  • Navigating strict regulatory approval and compliance processes is one of the key issues in the trocars market.

Medical devices like trocars are required to conform to stringent safety and efficacy norms laid down by regulatory agencies like the U.S. FDA, the European Medicines Agency (EMA), and other global authorities. Such regulations involve lengthy clinical trials, quality control tests, and post-marketing surveillance, resulting in long approval periods and high compliance costs for manufacturers. For instance, in the U.S., FDA approvals for medical devices through the FDA's 510(k) clearance or Premarket Approval (PMA) process can last months to years, delaying product launches. Moreover, any non-compliance or recall issues can lead to financial penalties and reputational loss for manufacturers. Such regulatory barriers create a challenge for new players and small-scale firms, minimizing opportunities for innovation and market growth.

Trocars Market Segmentation Insights
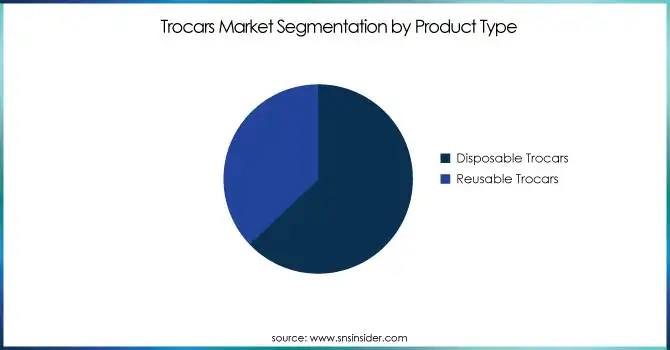
By Product Type

The disposable trocars segment dominated the trocars market with a 62.86% market share in 2023 because of the increasing focus on infection control, regulatory requirements, and user-friendliness in surgical procedures. Healthcare centers, especially in developed parts of the world such as North America and Europe, value single-use surgical devices to reduce the risk of cross-contamination and adhere to strict sterilization protocols. Disposable trocars obviate the process of reprocessing and sterilization, minimizing hospital-associated infections (HAIs) and guaranteeing patient safety. Moreover, technological advancements in material technology have resulted in the creation of affordable, high-performance disposable trocars, which are now a favorite among ambulatory surgical centers and hospitals. The increasing number of laparoscopic procedures globally, coupled with positive reimbursement policies favoring minimally invasive procedures, further strengthened the market leadership of the segment in 2023.

The reusable trocars segment is witness to registering the fastest growth over the forecast years, driven by mounting cost-effectiveness measures and ecological concerns. As healthcare practitioners attempt to cut down on medical waste and long-term costs, reusable trocars adoption is increasing, especially in the developing world of Asia Pacific and Latin America. Advances in the technology of sterilization have enhanced the longevity and safety of reusable trocars, and thus, they are a true alternative to disposable trocars. Also, the increasing number of laparoscopic surgeries combined with the increased demand for environmentally friendly surgical solutions is compelling healthcare centers to invest in quality reusable trocars. With continued advancements in design and material toughness, reusable trocars should become a standard part of cost-cutting and eco-oriented surgical practice.

Trocars-Market-Segmentation-by-Product-Type

By Trocars Tip

The Bladeless Trocars segment dominated the market with around 45.32% market share in 2023 because of its better safety record, less tissue damage, and lower chance of vascular or organ injury while conducting laparoscopic surgeries. Unlike bladed trocars, the bladeless variants employ a blunt-tip mechanism to separate tissues rather than cut them, thereby avoiding postoperative complications and enhancing patient outcomes. The rising use of minimally invasive procedures (MIS) in general, gynecological, and bariatric surgeries has further driven the need for bladeless trocars due to their added precision with atraumatic access to the abdominal cavity. Furthermore, the improvements in trocar design, such as ergonomic elements and built-in sealing mechanisms, have further supported the use of bladeless over traditional options by surgeons, further driving their market leadership in 2023.

The Optical Trocars segment is expected to register the fastest growth over the forecast period based on the growing need for advanced visualization methods in laparoscopic procedures. The trocars are provided with a clear tip to hold an endoscope, through which real-time visualization of layers of tissue is possible, and exact entry into the abdominal cavity can be achieved. This aspect greatly diminishes the risks of complications such as accidental perforation of an organ, so optical trocars are a widely accepted option, particularly in demanding and risky surgeries. The increasing emphasis on safety for patients, advances in the technology of laparoscopic instruments, and more frequent robotic surgery are propelling the widespread usage of optical trocars. In addition, the increasing usage of these trocars in general, gynecological, and urology surgeries is predicted to drive the growth of the market for such trocars during the forecast years.

By Application

The General Surgery segment dominated the trocars market in 2023 and is expected to maintain its dominance with the fastest CAGR throughout the forecast period, on account of huge volumes of laparoscopic procedures being done for a multitude of conditions like hernia, cholecystectomy, appendectomy, and colorectal operations. The rapid incorporation of minimally invasive surgical (MIS) methods into general surgery has been a leading cause of escalating the demand for trocars because they are pivotal access ports for instruments used for laparoscopic purposes. In addition, the increase in gastrointestinal diseases, gallbladder illness, and obesity ailments has fueled the demand for laparoscopic procedures, promoting the market's growth further. Trocars with enhanced sealing and stability capabilities have become more favored by hospitals and surgical institutes for their enhanced procedural efficiency and patient benefits, which has also helped the segment hold the leading position in 2023.

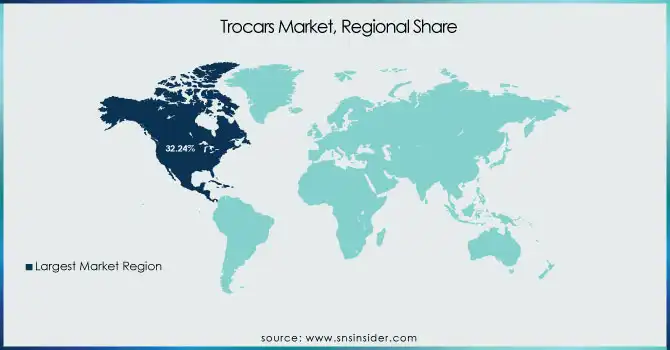
Trocars Market Regional Analysis

North America dominated the trocars market with a 32.24% market share in 2023 because of the strong acceptance of minimally invasive procedures, sophisticated healthcare facilities, and the presence of major market players. The region has a well-developed regulatory environment, which makes high-quality surgical tools, including trocars, easily available. Furthermore, the growing incidence of conditions that necessitate laparoscopic surgeries, including gallbladder disorders, hernias, and gynecological conditions, has fueled the demand for trocars. The US, most notably, dominates the market owing to its high concentration of ambulatory surgery centers and hospitals that are equipped with sophisticated laparoscopic and robotic-assisted surgery technologies. Additionally, the availability of prominent market players such as Johnson & Johnson (Ethicon), Medtronic, and B. Braun has allowed for ongoing product innovations and new product launches, thus cementing North America's supremacy in the market.

Asia Pacific is the fastest-growing region for trocars with 7.79% CAGR, spurred by increasing healthcare expenditure, enhancing surgical infrastructure, and a growing patient pool needing minimally invasive procedures. China, India, and Japan are among the countries experiencing fast growth due to the increasing incidence of chronic diseases and government efforts in favor of advanced surgical procedures. The growing medical tourism industry in Thailand, South Korea, and India is also driving market growth as global patients are opting for low-cost but quality surgical procedures. Moreover, regional Asian Pacific manufacturers are also making affordable trocars, thus enabling laparoscopic surgeries to be more accessible. The increasing adoption of robotic surgeries, driven by rising hospital expenditure and foreign investments in healthcare technology, is further propelling the market's growth in this region.

Trocars-Market-Regional-Share

Get Customized Report as per Your Business Requirement - Enquiry Now

Key Market Players

  • Johnson & Johnson (Ethicon) (ENDOPATH XCEL Bladeless Trocar, ENDOPATH XCEL Optical Trocar)

  • Medtronic (VersaOne Bladeless Trocar, Visiport Plus Optical Trocar)

  • B. Braun (BLAKE Silicone Drains, Aesculap Access Ports)

  • Applied Medical (Kii Fios First Entry Trocar, Kii Balloon Blunt Tip System)

  • Conmed Corporation (AirSeal Access Port, DetachaTip Reusable Trocar System)

  • Teleflex Incorporated (Weck EFx Endo Fascial Closure System, MiniLap Percutaneous Surgical System)

  • CooperSurgical (SeeClear Smoke Evacuation System, RUMI II Uterine Manipulator)

  • Geyi Medical Instrument (Disposable Bladeless Trocar, Disposable Bladed Trocar)

  • Hangzhou Kangji Medical Instruments (Disposable Laparoscopic Trocar, Disposable Optical Trocar)

  • Purple Surgical (Universal Seal Laparoscopic Trocar, Optical Tip Trocar)

  • Genicon (Single Use Bladeless Trocar, Single Use Optical Trocar)

  • Laparosurge (LS Optical Trocar, LS Bladeless Trocar)

  • Seemann Technologies (Disposable Laparoscopic Trocar, Reusable Laparoscopic Trocar)

  • Victor Medical Instruments (Disposable Bladeless Trocar, Disposable Optical Trocar)

  • Bluesail Surgical (Disposable Laparoscopic Trocar, Disposable Optical Trocar)

  • SurgiCore (Disposable Bladeless Trocar, Disposable Optical Trocar)

  • Surgsci Medical (Disposable Laparoscopic Trocar, Disposable Optical Trocar)

  • Unimax Medical Systems (Disposable Bladeless Trocar, Disposable Optical Trocar)

  • VECTEC (Disposable Laparoscopic Trocar, Disposable Optical Trocar)

  • Zhejiang Geyi Medical Instrument (Disposable Bladeless Trocar, Disposable Bladed Trocar)

Suppliers (These key suppliers provide essential components, raw materials, and precision-engineered parts used in the manufacturing of trocars, including medical-grade plastics, stainless steel, seals, and tubing. They also offer contract manufacturing, OEM solutions, and customization services to support trocar design, assembly, and performance enhancement.) in Trocars Market

  • Nordson Medical

  • Bal Seal Engineering, Inc.

  • Freudenberg Medical

  • Spectrum Plastics Group

  • Teleflex Medical OEM

  • Qosina Corporation

  • Merit Medical Systems

  • Minnetronix Medical

  • Cadence Inc.

  • Medbio LLC

Recent Development:

  • November 2024: Johnson & Johnson MedTech achieved Investigational Device Exemption (IDE) from the U.S. FDA for its OTTAVA robot-assisted surgical system, making it possible to start clinical trials in the United States. The OTTAVA system has a novel architecture that includes four low-profile robotic arms mounted on the operating table to provide greater flexibility in multiple surgeries.

  • January 2025: Medtronic named Thierry Pieton, previously Renault's finance director, as its new Chief Financial Officer, starting March 3. Pieton's tenure at Renault saw impressive sales growth, setting him up to make contributions to Medtronic's financial operations and strategies.

  • July 2024: B. Braun introduced the Aesculap EinsteinVision 3.0, a sophisticated 3D laparoscopy imaging system intended to increase surgical accuracy and ergonomics. The system provides enhanced depth perception and image quality that aids minimally invasive surgical treatments.

Trocars Market Report Scope:

Report Attributes Details
Market Size in 2023 US$ 820.34 million
Market Size by 2032 US$ 1464.99 million
CAGR CAGR of 7.26% From 2024 to 2032
Base Year 2023
Forecast Period 2024-2032
Historical Data 2020-2022
Report Scope & Coverage Market Size, Segments Analysis, Competitive  Landscape, Regional Analysis, DROC & SWOT Analysis, Forecast Outlook
Key Segments • By Product Type (Disposable Trocars, Reusable Trocars)
• By Trocars Tip (Bladeless Trocars, Optical Trocars, Blunt Trocars, Bladed Trocars)
• By Application (General Surgery, Gynecological Surgery, Urological Surgery, Pediatric Surgery, Other Surgeries)
Regional Analysis/Coverage North America (US, Canada, Mexico), Europe (Eastern Europe [Poland, Romania, Hungary, Turkey, Rest of Eastern Europe] Western Europe] Germany, France, UK, Italy, Spain, Netherlands, Switzerland, Austria, Rest of Western Europe]), Asia Pacific (China, India, Japan, South Korea, Vietnam, Singapore, Australia, Rest of Asia Pacific), Middle East & Africa (Middle East [UAE, Egypt, Saudi Arabia, Qatar, Rest of Middle East], Africa [Nigeria, South Africa, Rest of Africa], Latin America (Brazil, Argentina, Colombia, Rest of Latin America)
Company Profiles Johnson & Johnson (Ethicon), Medtronic, B. Braun, Applied Medical, Conmed Corporation, Teleflex Incorporated, CooperSurgical, Geyi Medical Instrument, Hangzhou Kangji Medical Instruments, Purple Surgical, Genicon, Laparosurge, Seemann Technologies, Victor Medical Instruments, Bluesail Surgical, SurgiCore, Surgsci Medical, Unimax Medical Systems, VECTEC, Zhejiang Geyi Medical Instrument, and other players.

Frequently Asked Questions

Ans:  The Trocars Market is expected to grow at a CAGR of 6.70% during 2024-2032.

Ans: The Trocars Market was USD 820.34 million in 2023 and is expected to reach USD 1464.99 million by 2032.

Ans: The growing preference for minimally invasive surgeries (MIS) is a significant driver of the Trocars Market.

Ans: The “Disposable Trocars” segment dominated the Trocars Market.

Ans: North America dominated the Trocars Market in 2023.

Table of Contents:

1. Introduction

1.1 Market Definition

1.2 Scope (Inclusion and Exclusions)

1.3 Research Assumptions

2. Executive Summary

2.1 Market Overview

2.2 Regional Synopsis

2.3 Competitive Summary

3. Research Methodology

3.1 Top-Down Approach

3.2 Bottom-up Approach

3.3. Data Validation

3.4 Primary Interviews

4. Market Dynamics Impact Analysis

4.1 Market Driving Factors Analysis

4.1.1 Drivers

4.1.2 Restraints

4.1.3 Opportunities

4.1.4 Challenges

4.2 PESTLE Analysis

4.3 Porter’s Five Forces Model

5. Statistical Insights and Trends Reporting

5.1 Surgical Procedure Volume (2023, by Type and Region)

5.2 Trocar Utilization Rate (2023, by Region and Application)

5.3 Device Volume, by Region (2020-2032)

5.4 Healthcare Spending on Laparoscopic Instruments, by Region (Government, Commercial, Private, Out-of-Pocket), 2023

6. Competitive Landscape

6.1 List of Major Companies, By Region

6.2 Market Share Analysis, By Region

6.3 Product Benchmarking

6.3.1 Product specifications and features

6.3.2 Pricing

6.4 Strategic Initiatives

6.4.1 Marketing and promotional activities

6.4.2 Distribution and supply chain strategies

6.4.3 Expansion plans and new product launches

6.4.4 Strategic partnerships and collaborations

6.5 Technological Advancements

6.6 Market Positioning and Branding

7. Trocars Market Segmentation, by Product Type

7.1 Chapter Overview

7.2 Disposable Trocars

7.2.1 Disposable Trocars Market Trends Analysis (2020-2032)

7.2.2 Disposable Trocars Market Size Estimates and Forecasts to 2032 (USD Million)

7.3 Reusable Trocars

7.3.1 Reusable Trocars Market Trends Analysis (2020-2032)

7.3.2 Reusable Trocars Market Size Estimates and Forecasts to 2032 (USD Million)

8. Trocars Market Segmentation, by Trocars Tip

8.1 Chapter Overview

8.2 Bladeless Trocars

8.2.1 Bladeless Trocars Market Trends Analysis (2020-2032)

8.2.2 Bladeless Trocars Market Size Estimates and Forecasts to 2032 (USD Million)

8.3 Optical Trocars

8.3.1 Optical Trocars Market Trends Analysis (2020-2032)

8.3.2 Optical Trocars Market Size Estimates and Forecasts to 2032 (USD Million)

8.4 Blunt Trocars

8.4.1 Blunt Trocars Market Trends Analysis (2020-2032)

8.4.2 Blunt Trocars Market Size Estimates and Forecasts to 2032 (USD Million)

8.5 Bladed Trocars

8.5.1 Bladed Trocars Market Trends Analysis (2020-2032)

8.5.2 Bladed Trocars Market Size Estimates and Forecasts to 2032 (USD Million)

9. Trocars Market Segmentation, by Application

9.1 Chapter Overview

9.2 General Surgery

9.2.1 General Surgery Market Trends Analysis (2020-2032)

9.2.2 General Surgery Market Size Estimates and Forecasts to 2032 (USD Million)

9.3 Gynecological Surgery

9.3.1 Gynecological Surgery Market Trends Analysis (2020-2032)

9.3.2 Gynecological Surgery Market Size Estimates and Forecasts to 2032 (USD Million)

9.4 Urological Surgery

               9.4.1 Urological Surgery Market Trends Analysis (2020-2032)

9.4.2 Urological Surgery Market Size Estimates and Forecasts to 2032 (USD Million)

9.5 Pediatric Surgery

9.5.1 Pediatric Surgery Market Trends Analysis (2020-2032)

9.5.2 Pediatric Surgery Market Size Estimates and Forecasts to 2032 (USD Million)

9.6 Other Surgeries

9.6.1 Other Surgeries Market Trends Analysis (2020-2032)

9.6.2 Other Surgeries Market Size Estimates and Forecasts to 2032 (USD Million)

10. Regional Analysis

10.1 Chapter Overview

10.2 North America

10.2.1 Trends Analysis

10.2.2 North America Trocars Market Estimates and Forecasts, by Country (2020-2032) (USD Million)

10.2.3 North America Trocars Market Estimates and Forecasts, by Product Type (2020-2032) (USD Million) 

10.2.4 North America Trocars Market Estimates and Forecasts, by Trocars Tip (2020-2032) (USD Million)

10.2.5 North America Trocars Market Estimates and Forecasts, by Application (2020-2032) (USD Million)

10.2.6 USA

10.2.6.1 USA Trocars Market Estimates and Forecasts, by Product Type (2020-2032) (USD Million)

10.2.6.2 USA Trocars Market Estimates and Forecasts, by Trocars Tip (2020-2032) (USD Million)

10.2.6.3 USA Trocars Market Estimates and Forecasts, by Application (2020-2032) (USD Million)

10.2.7 Canada

10.2.7.1 Canada Trocars Market Estimates and Forecasts, by Product Type (2020-2032) (USD Million)

10.2.7.2 Canada Trocars Market Estimates and Forecasts, by Trocars Tip (2020-2032) (USD Million)

10.2.7.3 Canada Trocars Market Estimates and Forecasts, by Application (2020-2032) (USD Million)

10.2.8 Mexico

10.2.8.1 Mexico Trocars Market Estimates and Forecasts, by Product Type (2020-2032) (USD Million)

10.2.8.2 Mexico Trocars Market Estimates and Forecasts, by Trocars Tip (2020-2032) (USD Million)

10.2.8.3 Mexico Trocars Market Estimates and Forecasts, by Application (2020-2032) (USD Million)

10.3 Europe

10.3.1 Eastern Europe

10.3.1.1 Trends Analysis

10.3.1.2 Eastern Europe Trocars Market Estimates and Forecasts, by Country (2020-2032) (USD Million)

10.3.1.3 Eastern Europe Trocars Market Estimates and Forecasts, by Product Type (2020-2032) (USD Million) 

10.3.1.4 Eastern Europe Trocars Market Estimates and Forecasts, by Trocars Tip (2020-2032) (USD Million)

10.3.1.5 Eastern Europe Trocars Market Estimates and Forecasts, by Application (2020-2032) (USD Million)

10.3.1.6 Poland

10.3.1.6.1 Poland Trocars Market Estimates and Forecasts, by Product Type (2020-2032) (USD Million)

10.3.1.6.2 Poland Trocars Market Estimates and Forecasts, by Trocars Tip (2020-2032) (USD Million)

10.3.1.6.3 Poland Trocars Market Estimates and Forecasts, by Application (2020-2032) (USD Million)

10.3.1.7 Romania

10.3.1.7.1 Romania Trocars Market Estimates and Forecasts, by Product Type (2020-2032) (USD Million)

10.3.1.7.2 Romania Trocars Market Estimates and Forecasts, by Trocars Tip (2020-2032) (USD Million)

10.3.1.7.3 Romania Trocars Market Estimates and Forecasts, by Application (2020-2032) (USD Million)

10.3.1.8 Hungary

10.3.1.8.1 Hungary Trocars Market Estimates and Forecasts, by Product Type (2020-2032) (USD Million)

10.3.1.8.2 Hungary Trocars Market Estimates and Forecasts, by Trocars Tip (2020-2032) (USD Million)

10.3.1.8.3 Hungary Trocars Market Estimates and Forecasts, by Application (2020-2032) (USD Million)

10.3.1.9 Turkey

10.3.1.9.1 Turkey Trocars Market Estimates and Forecasts, by Product Type (2020-2032) (USD Million)

10.3.1.9.2 Turkey Trocars Market Estimates and Forecasts, by Trocars Tip (2020-2032) (USD Million)

10.3.1.9.3 Turkey Trocars Market Estimates and Forecasts, by Application (2020-2032) (USD Million)

10.3.1.10 Rest of Eastern Europe

10.3.1.10.1 Rest of Eastern Europe Trocars Market Estimates and Forecasts, by Product Type (2020-2032) (USD Million)

10.3.1.10.2 Rest of Eastern Europe Trocars Market Estimates and Forecasts, by Trocars Tip (2020-2032) (USD Million)

10.3.1.10.3 Rest of Eastern Europe Trocars Market Estimates and Forecasts, by Application (2020-2032) (USD Million)

10.3.2 Western Europe

10.3.2.1 Trends Analysis

10.3.2.2 Western Europe Trocars Market Estimates and Forecasts, by Country (2020-2032) (USD Million)

10.3.2.3 Western Europe Trocars Market Estimates and Forecasts, by Product Type (2020-2032) (USD Million) 

10.3.2.4 Western Europe Trocars Market Estimates and Forecasts, by Trocars Tip (2020-2032) (USD Million)

10.3.2.5 Western Europe Trocars Market Estimates and Forecasts, by Application (2020-2032) (USD Million)

10.3.2.6 Germany

10.3.2.6.1 Germany Trocars Market Estimates and Forecasts, by Product Type (2020-2032) (USD Million)

10.3.2.6.2 Germany Trocars Market Estimates and Forecasts, by Trocars Tip (2020-2032) (USD Million)

10.3.2.6.3 Germany Trocars Market Estimates and Forecasts, by Application (2020-2032) (USD Million)

10.3.2.7 France

10.3.2.7.1 France Trocars Market Estimates and Forecasts, by Product Type (2020-2032) (USD Million)

10.3.2.7.2 France Trocars Market Estimates and Forecasts, by Trocars Tip (2020-2032) (USD Million)

10.3.2.7.3 France Trocars Market Estimates and Forecasts, by Application (2020-2032) (USD Million)

10.3.2.8 UK

10.3.2.8.1 UK Trocars Market Estimates and Forecasts, by Product Type (2020-2032) (USD Million)

10.3.2.8.2 UK Trocars Market Estimates and Forecasts, by Trocars Tip (2020-2032) (USD Million)

10.3.2.8.3 UK Trocars Market Estimates and Forecasts, by Application (2020-2032) (USD Million)

10.3.2.9 Italy

10.3.2.9.1 Italy Trocars Market Estimates and Forecasts, by Product Type (2020-2032) (USD Million)

10.3.2.9.2 Italy Trocars Market Estimates and Forecasts, by Trocars Tip (2020-2032) (USD Million)

10.3.2.9.3 Italy Trocars Market Estimates and Forecasts, by Application (2020-2032) (USD Million)

10.3.2.10 Spain

10.3.2.10.1 Spain Trocars Market Estimates and Forecasts, by Product Type (2020-2032) (USD Million)

10.3.2.10.2 Spain Trocars Market Estimates and Forecasts, by Trocars Tip (2020-2032) (USD Million)

10.3.2.10.3 Spain Trocars Market Estimates and Forecasts, by Application (2020-2032) (USD Million)

10.3.2.11 Netherlands

10.3.2.11.1 Netherlands Trocars Market Estimates and Forecasts, by Product Type (2020-2032) (USD Million)

10.3.2.11.2 Netherlands Trocars Market Estimates and Forecasts, by Trocars Tip (2020-2032) (USD Million)

10.3.2.11.3 Netherlands Trocars Market Estimates and Forecasts, by Application (2020-2032) (USD Million)

10.3.2.12 Switzerland

10.3.2.12.1 Switzerland Trocars Market Estimates and Forecasts, by Product Type (2020-2032) (USD Million)

10.3.2.12.2 Switzerland Trocars Market Estimates and Forecasts, by Trocars Tip (2020-2032) (USD Million)

10.3.2.12.3 Switzerland Trocars Market Estimates and Forecasts, by Application (2020-2032) (USD Million)

10.3.2.13 Austria

10.3.2.13.1 Austria Trocars Market Estimates and Forecasts, by Product Type (2020-2032) (USD Million)

10.3.2.13.2 Austria Trocars Market Estimates and Forecasts, by Trocars Tip (2020-2032) (USD Million)

10.3.2.13.3 Austria Trocars Market Estimates and Forecasts, by Application (2020-2032) (USD Million)

10.3.2.14 Rest of Western Europe

10.3.2.14.1 Rest of Western Europe Trocars Market Estimates and Forecasts, by Product Type (2020-2032) (USD Million)

10.3.2.14.2 Rest of Western Europe Trocars Market Estimates and Forecasts, by Trocars Tip (2020-2032) (USD Million)

10.3.2.14.3 Rest of Western Europe Trocars Market Estimates and Forecasts, by Application (2020-2032) (USD Million)

10.4 Asia Pacific

10.4.1 Trends Analysis

10.4.2 Asia Pacific Trocars Market Estimates and Forecasts, by Country (2020-2032) (USD Million)

10.4.3 Asia Pacific Trocars Market Estimates and Forecasts, by Product Type (2020-2032) (USD Million) 

10.4.4 Asia Pacific Trocars Market Estimates and Forecasts, by Trocars Tip (2020-2032) (USD Million)

10.4.5 Asia Pacific Trocars Market Estimates and Forecasts, by Application (2020-2032) (USD Million)

10.4.6 China

10.4.6.1 China Trocars Market Estimates and Forecasts, by Product Type (2020-2032) (USD Million)

10.4.6.2 China Trocars Market Estimates and Forecasts, by Trocars Tip (2020-2032) (USD Million)

10.4.6.3 China Trocars Market Estimates and Forecasts, by Application (2020-2032) (USD Million)

10.4.7 India

10.4.7.1 India Trocars Market Estimates and Forecasts, by Product Type (2020-2032) (USD Million)

10.4.7.2 India Trocars Market Estimates and Forecasts, by Trocars Tip (2020-2032) (USD Million)

10.4.7.3 India Trocars Market Estimates and Forecasts, by Application (2020-2032) (USD Million)

10.4.8 Japan

10.4.8.1 Japan Trocars Market Estimates and Forecasts, by Product Type (2020-2032) (USD Million)

10.4.8.2 Japan Trocars Market Estimates and Forecasts, by Trocars Tip (2020-2032) (USD Million)

10.4.8.3 Japan Trocars Market Estimates and Forecasts, by Application (2020-2032) (USD Million)

10.4.9 South Korea

10.4.9.1 South Korea Trocars Market Estimates and Forecasts, by Product Type (2020-2032) (USD Million)

10.4.9.2 South Korea Trocars Market Estimates and Forecasts, by Trocars Tip (2020-2032) (USD Million)

10.4.9.3 South Korea Trocars Market Estimates and Forecasts, by Application (2020-2032) (USD Million)

10.4.10 Vietnam

10.4.10.1 Vietnam Trocars Market Estimates and Forecasts, by Product Type (2020-2032) (USD Million)

10.4.10.2 Vietnam Trocars Market Estimates and Forecasts, by Trocars Tip (2020-2032) (USD Million)

10.4.10.3 Vietnam Trocars Market Estimates and Forecasts, by Application (2020-2032) (USD Million)

10.4.11 Singapore

10.4.11.1 Singapore Trocars Market Estimates and Forecasts, by Product Type (2020-2032) (USD Million)

10.4.11.2 Singapore Trocars Market Estimates and Forecasts, by Trocars Tip (2020-2032) (USD Million)

10.4.11.3 Singapore Trocars Market Estimates and Forecasts, by Application (2020-2032) (USD Million)

10.4.12 Australia

10.4.12.1 Australia Trocars Market Estimates and Forecasts, by Product Type (2020-2032) (USD Million)

10.4.12.2 Australia Trocars Market Estimates and Forecasts, by Trocars Tip (2020-2032) (USD Million)

10.4.12.3 Australia Trocars Market Estimates and Forecasts, by Application (2020-2032) (USD Million)

10.4.13 Rest of Asia Pacific

10.4.13.1 Rest of Asia Pacific Trocars Market Estimates and Forecasts, by Product Type (2020-2032) (USD Million)

10.4.13.2 Rest of Asia Pacific Trocars Market Estimates and Forecasts, by Trocars Tip (2020-2032) (USD Million)

10.4.13.3 Rest of Asia Pacific Trocars Market Estimates and Forecasts, by Application (2020-2032) (USD Million)

10.5 Middle East and Africa

10.5.1 Middle East

10.5.1.1 Trends Analysis

10.5.1.2 Middle East Trocars Market Estimates and Forecasts, by Country (2020-2032) (USD Million)

10.5.1.3 Middle East Trocars Market Estimates and Forecasts, by Product Type (2020-2032) (USD Million) 

10.5.1.4 Middle East Trocars Market Estimates and Forecasts, by Trocars Tip (2020-2032) (USD Million)

10.5.1.5 Middle East Trocars Market Estimates and Forecasts, by Application (2020-2032) (USD Million)

10.5.1.6 UAE

10.5.1.6.1 UAE Trocars Market Estimates and Forecasts, by Product Type (2020-2032) (USD Million)

10.5.1.6.2 UAE Trocars Market Estimates and Forecasts, by Trocars Tip (2020-2032) (USD Million)

10.5.1.6.3 UAE Trocars Market Estimates and Forecasts, by Application (2020-2032) (USD Million)

10.5.1.7 Egypt

10.5.1.7.1 Egypt Trocars Market Estimates and Forecasts, by Product Type (2020-2032) (USD Million)

10.5.1.7.2 Egypt Trocars Market Estimates and Forecasts, by Trocars Tip (2020-2032) (USD Million)

10.5.1.7.3 Egypt Trocars Market Estimates and Forecasts, by Application (2020-2032) (USD Million)

10.5.1.8 Saudi Arabia

10.5.1.8.1 Saudi Arabia Trocars Market Estimates and Forecasts, by Product Type (2020-2032) (USD Million)

10.5.1.8.2 Saudi Arabia Trocars Market Estimates and Forecasts, by Trocars Tip (2020-2032) (USD Million)

10.5.1.8.3 Saudi Arabia Trocars Market Estimates and Forecasts, by Application (2020-2032) (USD Million)

10.5.1.9 Qatar

10.5.1.9.1 Qatar Trocars Market Estimates and Forecasts, by Product Type (2020-2032) (USD Million)

10.5.1.9.2 Qatar Trocars Market Estimates and Forecasts, by Trocars Tip (2020-2032) (USD Million)

10.5.1.9.3 Qatar Trocars Market Estimates and Forecasts, by Application (2020-2032) (USD Million)

10.5.1.10 Rest of Middle East

10.5.1.10.1 Rest of Middle East Trocars Market Estimates and Forecasts, by Product Type (2020-2032) (USD Million)

10.5.1.10.2 Rest of Middle East Trocars Market Estimates and Forecasts, by Trocars Tip (2020-2032) (USD Million)

10.5.1.10.3 Rest of Middle East Trocars Market Estimates and Forecasts, by Application (2020-2032) (USD Million)

10.5.2 Africa

10.5.2.1 Trends Analysis

10.5.2.2 Africa Trocars Market Estimates and Forecasts, by Country (2020-2032) (USD Million)

10.5.2.3 Africa Trocars Market Estimates and Forecasts, by Product Type (2020-2032) (USD Million) 

10.5.2.4 Africa Trocars Market Estimates and Forecasts, by Trocars Tip (2020-2032) (USD Million)

10.5.2.5 Africa Trocars Market Estimates and Forecasts, by Application (2020-2032) (USD Million)

10.5.2.6 South Africa

10.5.2.6.1 South Africa Trocars Market Estimates and Forecasts, by Product Type (2020-2032) (USD Million)

10.5.2.6.2 South Africa Trocars Market Estimates and Forecasts, by Trocars Tip (2020-2032) (USD Million)

10.5.2.6.3 South Africa Trocars Market Estimates and Forecasts, by Application (2020-2032) (USD Million)

10.5.2.7 Nigeria

10.5.2.7.1 Nigeria Trocars Market Estimates and Forecasts, by Product Type (2020-2032) (USD Million)

10.5.2.7.2 Nigeria Trocars Market Estimates and Forecasts, by Trocars Tip (2020-2032) (USD Million)

10.5.2.7.3 Nigeria Trocars Market Estimates and Forecasts, by Application (2020-2032) (USD Million)

10.5.2.8 Rest of Africa

10.5.2.8.1 Rest of Africa Trocars Market Estimates and Forecasts, by Product Type (2020-2032) (USD Million)

10.5.2.8.2 Rest of Africa Trocars Market Estimates and Forecasts, by Trocars Tip (2020-2032) (USD Million)

10.5.2.8.3 Rest of Africa Trocars Market Estimates and Forecasts, by Application (2020-2032) (USD Million)

10.6 Latin America

10.6.1 Trends Analysis

10.6.2 Latin America Trocars Market Estimates and Forecasts, by Country (2020-2032) (USD Million)

10.6.3 Latin America Trocars Market Estimates and Forecasts, by Product Type (2020-2032) (USD Million) 

10.6.4 Latin America Trocars Market Estimates and Forecasts, by Trocars Tip (2020-2032) (USD Million)

10.6.5 Latin America Trocars Market Estimates and Forecasts, by Application (2020-2032) (USD Million)

10.6.6 Brazil

10.6.6.1 Brazil Trocars Market Estimates and Forecasts, by Product Type (2020-2032) (USD Million)

10.6.6.2 Brazil Trocars Market Estimates and Forecasts, by Trocars Tip (2020-2032) (USD Million)

10.6.6.3 Brazil Trocars Market Estimates and Forecasts, by Application (2020-2032) (USD Million)

10.6.7 Argentina

10.6.7.1 Argentina Trocars Market Estimates and Forecasts, by Product Type (2020-2032) (USD Million)

10.6.7.2 Argentina Trocars Market Estimates and Forecasts, by Trocars Tip (2020-2032) (USD Million)

10.6.7.3 Argentina Trocars Market Estimates and Forecasts, by Application (2020-2032) (USD Million)

10.6.8 Colombia

10.6.8.1 Colombia Trocars Market Estimates and Forecasts, by Product Type (2020-2032) (USD Million)

10.6.8.2 Colombia Trocars Market Estimates and Forecasts, by Trocars Tip (2020-2032) (USD Million)

10.6.8.3 Colombia Trocars Market Estimates and Forecasts, by Application (2020-2032) (USD Million)

10.6.9 Rest of Latin America

10.6.9.1 Rest of Latin America Trocars Market Estimates and Forecasts, by Product Type (2020-2032) (USD Million)

10.6.9.2 Rest of Latin America Trocars Market Estimates and Forecasts, by Trocars Tip (2020-2032) (USD Million)

10.6.9.3 Rest of Latin America Trocars Market Estimates and Forecasts, by Application (2020-2032) (USD Million)

11. Company Profiles

11.1 Johnson & Johnson

11.1.1 Company Overview

11.1.2 Financial

11.1.3 Products/ Services Offered

11.1.4 SWOT Analysis

11.2 Medtronic

11.2.1 Company Overview

11.2.2 Financial

11.2.3 Products/ Services Offered

11.2.4 SWOT Analysis

11.3 B. Braun

11.3.1 Company Overview

11.3.2 Financial

11.3.3 Products/ Services Offered

11.3.4 SWOT Analysis

11.4 Applied Medical

11.4.1 Company Overview

11.4.2 Financial

11.4.3 Products/ Services Offered

11.4.4 SWOT Analysis

11.5 Conmed Corporation

11.5.1 Company Overview

11.5.2 Financial

11.5.3 Products/ Services Offered

11.5.4 SWOT Analysis

11.6 CooperSurgical

11.6.1 Company Overview

11.6.2 Financial

11.6.3 Products/ Services Offered

11.6.4 SWOT Analysis

11.7 Geyi Medical Instrument

11.7.1 Company Overview

11.7.2 Financial

11.7.3 Products/ Services Offered

11.7.4 SWOT Analysis

11.8 Hangzhou Kangji Medical Instruments

11.8.1 Company Overview

11.8.2 Financial

11.8.3 Products/ Services Offered

11.8.4 SWOT Analysis

11.9 Purple Surgical

11.9.1 Company Overview

11.9.2 Financial

11.9.3 Products/ Services Offered

11.9.4 SWOT Analysis

11.10 Genicon

11.10.1 Company Overview

11.10.2 Financial

11.10.3 Products/ Services Offered

11.10.4 SWOT Analysis

12. Use Cases and Best Practices

13. Conclusion

An accurate research report requires proper strategizing as well as implementation. There are multiple factors involved in the completion of good and accurate research report and selecting the best methodology to compete the research is the toughest part. Since the research reports we provide play a crucial role in any company’s decision-making process, therefore we at SNS Insider always believe that we should choose the best method which gives us results closer to reality. This allows us to reach at a stage wherein we can provide our clients best and accurate investment to output ratio.

Each report that we prepare takes a timeframe of 350-400 business hours for production. Starting from the selection of titles through a couple of in-depth brain storming session to the final QC process before uploading our titles on our website we dedicate around 350 working hours. The titles are selected based on their current market cap and the foreseen CAGR and growth.


The 5 steps process:

Step 1: Secondary Research:

Secondary Research or Desk Research is as the name suggests is a research process wherein, we collect data through the readily available information. In this process we use various paid and unpaid databases which our team has access to and gather data through the same. This includes examining of listed companies’ annual reports, Journals, SEC filling etc. Apart from this our team has access to various associations across the globe across different industries. Lastly, we have exchange relationships with various university as well as individual libraries.

Secondary Research

Step 2: Primary Research

When we talk about primary research, it is a type of study in which the researchers collect relevant data samples directly, rather than relying on previously collected data.  This type of research is focused on gaining content specific facts that can be sued to solve specific problems. Since the collected data is fresh and first hand therefore it makes the study more accurate and genuine.

We at SNS Insider have divided Primary Research into 2 parts.

Part 1 wherein we interview the KOLs of major players as well as the upcoming ones across various geographic regions. This allows us to have their view over the market scenario and acts as an important tool to come closer to the accurate market numbers. As many as 45 paid and unpaid primary interviews are taken from both the demand and supply side of the industry to make sure we land at an accurate judgement and analysis of the market.

This step involves the triangulation of data wherein our team analyses the interview transcripts, online survey responses and observation of on filed participants. The below mentioned chart should give a better understanding of the part 1 of the primary interview.

Primary Research

Part 2: In this part of primary research the data collected via secondary research and the part 1 of the primary research is validated with the interviews from individual consultants and subject matter experts.

Consultants are those set of people who have at least 12 years of experience and expertise within the industry whereas Subject Matter Experts are those with at least 15 years of experience behind their back within the same space. The data with the help of two main processes i.e., FGDs (Focused Group Discussions) and IDs (Individual Discussions). This gives us a 3rd party nonbiased primary view of the market scenario making it a more dependable one while collation of the data pointers.

Step 3: Data Bank Validation

Once all the information is collected via primary and secondary sources, we run that information for data validation. At our intelligence centre our research heads track a lot of information related to the market which includes the quarterly reports, the daily stock prices, and other relevant information. Our data bank server gets updated every fortnight and that is how the information which we collected using our primary and secondary information is revalidated in real time.

Data Bank Validation

Step 4: QA/QC Process

After all the data collection and validation our team does a final level of quality check and quality assurance to get rid of any unwanted or undesired mistakes. This might include but not limited to getting rid of the any typos, duplication of numbers or missing of any important information. The people involved in this process include technical content writers, research heads and graphics people. Once this process is completed the title gets uploader on our platform for our clients to read it.

Step 5: Final QC/QA Process:

This is the last process and comes when the client has ordered the study. In this process a final QA/QC is done before the study is emailed to the client. Since we believe in giving our clients a good experience of our research studies, therefore, to make sure that we do not lack at our end in any way humanly possible we do a final round of quality check and then dispatch the study to the client.

Key Market Segments:

By Product Type

    • Disposable Trocars

    • Reusable Trocars

By Trocars Tip

    • Bladeless Trocars

    • Optical Trocars

    • Blunt Trocars

    • Bladed Trocars

By Application

    • General Surgery

    • Gynecological Surgery

    • Urological Surgery

    • Pediatric Surgery

    • Other Surgeries

Request for Segment Customization as per your Business Requirement: Segment Customization Request

Regional Coverage: 

North America 

  • US 

  • Canada 

  • Mexico 

Europe 

  • Eastern Europe 

  • Poland 

  • Romania 

  • Hungary 

  • Turkey 

  • Rest of Eastern Europe 

  • Western Europe 

  • Germany 

  • France 

  • UK 

  • Italy 

  • Spain 

  • Netherlands 

  • Switzerland 

  • Austria 

  • Rest of Western Europe 

Asia Pacific 

  • China 

  • India 

  • Japan 

  • South Korea 

  • Vietnam 

  • Singapore 

  • Australia 

  • Rest of Asia Pacific 

Middle East & Africa 

  • Middle East 

  • UAE 

  • Egypt 

  • Saudi Arabia 

  • Qatar 

  • Rest of Middle East 

  • Africa 

  • Nigeria 

  • South Africa 

  • Rest of Africa 

Latin America 

  • Brazil 

  • Argentina 

  • Colombia 

  • Rest of Latin America 

Request for Country-Level Research Report: Country-Level Customization Request

Available Customization 

With the given market data, SNS Insider offers customization as per the company’s specific needs. The following customization options are available for the report: 

  • Detailed Volume Analysis 

  • Criss-Cross segment analysis (e.g., Product X Application) 

  • Competitive Product Benchmarking 

  • Geographic Analysis 

  • Additional countries in any of the regions 

  • Customized Data Representation 

  • Detailed analysis and profiling of additional market players 


  •            5000 (33% Discount)


  •            8950 (40% Discount)


  •            3050 (23% Discount)

Start a Conversation

Hi! Click one of our member below to chat on Phone