Travel and Expense Management Software Market Report Scope & Overview:
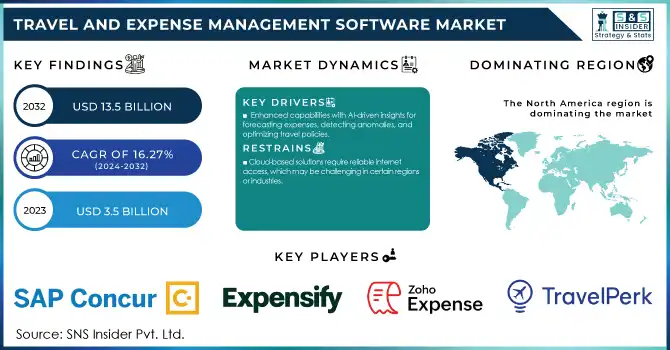
The Travel And Expense Management Software Market was valued at USD 3.5 Billion in 2023 and is expected to reach USD 13.5 Billion by 2032, growing at a CAGR of 16.27% from 2024-2032.
Get more information on Travel and Expense Management Software Market - Request Sample Report
The Travel and Expense Management Software Market is booming as companies are effectively exploiting these software systems in increasing automation to streamline travel and expense processes. The major driving factor for this growth is the increasing acceptance of cloud-based and mobile solutions that allow employees to book travel and apply expenses on the fly. The transition to a mobile platform itself improves efficiency by giving the users the ability to file an expense and get the necessary approvals while at the same time reducing the burden of administration and enabling a better user experience overall. Reduction of costs and efficiency will remain another essential driver of market growth. Automated solutions for travel and expense management help organizations reduce manual errors, keep compliance in check with corporate policy, and improve visibility into spending patterns. It helps in automating the process leading to more precise financial reporting and also better budget management, thus helping businesses control their expenses.
With the growth of globalization and the increase in remote work, the need for robust travel and expense management has only continued to increase. Today, millions of people travel more than before, and the situation is more complicated as businesses are working globally in more locations. Businesses operating in multiple regions often find it complicated to manage travel arrangements, monitor expenses, and enforce policies; using advanced software solutions for travel programs offers centralized platforms, simplifying the process. With the introduction of artificial intelligence and machine learning in these platforms they are becoming more and more powerful. AI-based knowledge reveals expenses on travel, identifies anomalies in things related to spending, and makes travel policies more efficient, thereby enabling better decision-making and financial planning.
Market Dynamics
Drivers
-
Enhanced capabilities with AI-driven insights for forecasting expenses, detecting anomalies, and optimizing travel policies.
The Travel and Expense Management Software Market is experiencing a major transformation driven by AI-powered insights, promising innovative tools to improve the management of travel-linked expenses in a very significant manner. By leveraging historical data to identify trends in spending, these AI-based solutions allow organizations to project travel expenditures more accurately, helping companies budget for future travel more effectively. Further, AI algorithms identify exceptions in spending — for example, unusual expenditures or variances in the organization's procedures — supporting the detection of potential fraud or lack of compliance [i]. Detecting this in real time guarantees compliance with the policies, enabling businesses to take corrective action without unnecessary delay.
AI also helps in travel policy optimization by analyzing previous travel data and suggesting modifications for cost-saving. AI, for example, can recommend the most cost-effective flight options like preferred airlines or hotels, leveraging employee preferences and historical data. Because AI learns continuously through data, these recommendations improve over time, resulting in a seamless travel policy that is tailored to the needs of a corporate traveler. AI in travel and expense management software significantly improves the decision-making process by minimizing human error ensuring the organization ends up with data-driven decisions that meet and exceed the overall financial goals. The importance of AI in forecasting, anomaly detection, and policy optimization is increasingly critical as companies strive for higher levels of operational efficiency and cost control, significantly boosting the demand in the Travel and Expense Management Software Market.
-
Increased use of cloud-based and mobile platforms for real-time expense management, improving accessibility and efficiency.
-
Growing need for solutions that manage travel logistics and expenses across distributed teams and international locations.
Restraints
-
Cloud-based solutions require reliable internet access, which may be challenging in certain regions or industries.
Cloud-based solutions in the Travel and Expense Management Software Market heavily rely on consistent and reliable internet connectivity for optimal performance. This dependency can be a significant challenge, particularly in regions or industries where internet access is limited, unreliable, or slow. In such areas, employees may struggle to access real-time data, update expense reports, or approve travel requests, leading to delays in the travel management process. This can impact the overall efficiency and effectiveness of the system, reducing the value of cloud-based solutions. For businesses operating in remote or rural locations, or industries with limited technological infrastructure, the reliance on cloud platforms may lead to frustrations and inefficiencies. In these cases, employees may be forced to use alternative methods, such as offline spreadsheets or manual reporting, which can undermine the benefits of automation and real-time expense tracking that cloud-based solutions offer. Moreover, industries with global operations, particularly those in developing regions, may face challenges in ensuring stable internet connectivity across multiple locations. This could result in inconsistencies in the management of travel and expense data, making it harder to enforce corporate policies and maintain accurate financial reporting.
To overcome these challenges, businesses may need to invest in improving internet infrastructure or consider hybrid solutions that combine cloud-based platforms with on-premise systems, ensuring that employees in areas with poor connectivity can still manage their travel and expenses effectively.
-
Storing sensitive financial and travel data on cloud platforms raises concerns about potential breaches and privacy issues.
-
Integrating travel and expense management software with existing enterprise systems can be time-consuming and complex.
Regional Analysis
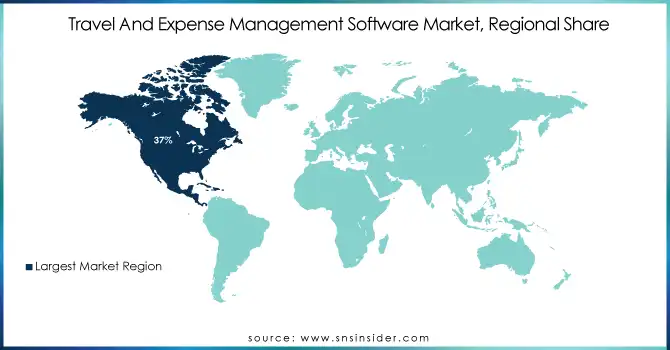
North America is dominating the industry. This is due to the development and use of cloud computing by enterprises. The Asia Pacific market for travel and spending management software is expected to grow quickly throughout the period of forecasting. The rise in the region is attributed to the presence of many small and medium-sized firms there as well as their growing desire for travel and expense management software. In addition, as business travel increases in countries like China, India, and Hong Kong, among others, it is projected that demand for the program would rise.
Due to the region's expanding business travel opportunities, Europe also holds the largest market share. Additionally, it is advised to display a healthy growth rate over the course of the forecast period. To diversify their product offerings and adopt modern technology, the regional industries are innovating in the areas of IT and telecom, retail, and e-commerce. For instance, TripActions introduced LIQUID, an all-in-one travel and expense management system with corporate card integration, in Europe This led to geographic expansion and promoted commercial expansion.
In the regional analysis study of the regions of North America, Europe, Asia Pacific middle east, and Africa.
Segment Analysis
By Deployment
In 2023, the hosted segment accounted for the maximum revenue share of 65% in the market. Cloud-based and hosted solutions enable companies to implement travel expenditure management without requiring large initial investments in IT systems. It lessens maintenance costs and provides flexibility, allowing businesses to grow accordingly. Additionally, with hosted solutions, users can access their data in real-time, anywhere, and track and report expenses much more efficiently as a result.
On-premise segment is anticipated to grow at the fastest CAGR during the forecast period. Organizations also have complete control over their infrastructure in an on-premise deployment, with access to confidential travel and expense data only taking place over their internal servers, so they need not worry about data breaches or compliance concerns. That is especially attractive for organizations in highly regulated areas, such as finance or health care. Furthermore, on-premise solutions are better customizable and can be set up according to certain unique business processes which makes them more suitable for bigger organizations looking for flexibility and improved control.
By Enterprise Type
In 2023, the largest enterprises segment dominated the market and accounted for the largest market revenue share of 71%. Large enterprises often have greater business travel volumes that call for automated solutions to simplify and expedite expense reporting, reduce errors, and improve policy compliance. These are among other aspects these organizations are expecting to improve, so they remain focused on enhancing the cost efficiency and understanding the travel expenses timely. Offering added functionalities like analytics, reporting, and mobile access compels large enterprises to adapt travel and expense management software to maintain enhanced control and transparency in their financial processes.
The SME segment is expected to have the fastest CAGR during the forecast period. SMEs tend to require more resources and manual processes, resulting in errors, inefficiencies, and increased operational costs. With the adoption of travel and expense management software, these companies can automate processes, including expense tracking, reimbursement, and ensuring compliance with travel policies. This minimizes administrative burden and offers forecasts of spending behaviors, allowing SMEs to make the best use of their budget and drive improved decision-making. Moreover, with SMEs expanding to do business across the globe, a streamlined system to handle travel expenses needs to be in place to remain competitive and legible with regulatory requirements.
Regional Analysis
In 2023, North America accounted for the highest revenue share of the market at 37.0%. In the region, a rising focus on corporate transparency, financial accountability, and cost optimization, propelling the market growth. More companies are turning to this software to help them manage business travel regulations and expense reporting against internal policies and government regulations. With travel more complex due to the increase of remote work and hybrid work models, businesses will need to track and report on this travel more efficiently. Moreover, the addition of the latest technologies like AI and automation in these platforms provides North American businesses with greater analytics and more insights, allowing them to make decisions based on data and lower costs.
The Asia Pacific is projected to have the highest CAGR over the forecast period. Market Drivers Corporates Setting up in the Region and Demand for Business Travel Further fueling this demand is the rapid adoption of digital solutions across various industries in Asia-Pacific and the need for automation to manage complex travel policies and reimbursement processes. With organizations in the region working towards greater employee efficiency and compliance with financial regulations, travel, and expense management software helps in optimizing resources with more control over costs.
Need any customization research/data on Travel and Expense Management Software Market - Enquiry Now
Key Players
The major key players along with their products are
-
SAP Concur - Concur Travel and Expense
-
Expensify - Expensify Expense Management
-
Zoho Expense - Zoho Expense Management Software
-
Certify - Certify Travel and Expense Management
-
TravelPerk - TravelPerk Business Travel Management
-
Chrome River - Chrome River EXPENSE
-
Rydoo - Rydoo Expense Management
-
Coupa Software - Coupa Expense Management
-
Xero - Xero Expenses
-
SAP - SAP Travel Management
-
Oracle - Oracle Expense Management Cloud
-
SutiSoft - SutiExpense
-
Emburse - Emburse Certify
-
TripActions - TripActions Travel Management
-
Expedia Group - Egencia Travel Management
Recent Developments
-
In January 2024, SAP Concur introduced new AI-powered features for enhanced expense tracking and fraud detection, improving real-time monitoring of expenses.
-
In February 2024, Expensify launched an integration with leading accounting platforms, streamlining the financial reporting process and improving overall expense management.
-
In March 2024, Zoho Expense released a mobile-friendly update, including advanced receipt scanning capabilities, making it easier for users to capture and submit expenses on-the-go.
| Report Attributes | Details |
|---|---|
| Market Size in 2023 | USD 3.5 Billion |
| Market Size by 2032 | USD 13.5 Billion |
| CAGR | CAGR of 16.27% From 2024 to 2032 |
| Base Year | 2023 |
| Forecast Period | 2024-2032 |
| Historical Data | 2020-2022 |
| Report Scope & Coverage | Market Size, Segments Analysis, Competitive Landscape, Regional Analysis, DROC & SWOT Analysis, Forecast Outlook |
| Key Segments | • By Deployment (Hosted, On-Premise) • By Enterprise Size (Large Enterprise, SMEs) |
| Regional Analysis/Coverage | North America (US, Canada, Mexico), Europe (Eastern Europe [Poland, Romania, Hungary, Turkey, Rest of Eastern Europe] Western Europe] Germany, France, UK, Italy, Spain, Netherlands, Switzerland, Austria, Rest of Western Europe]), Asia Pacific (China, India, Japan, South Korea, Vietnam, Singapore, Australia, Rest of Asia Pacific), Middle East & Africa (Middle East [UAE, Egypt, Saudi Arabia, Qatar, Rest of Middle East], Africa [Nigeria, South Africa, Rest of Africa], Latin America (Brazil, Argentina, Colombia, Rest of Latin America) |
| Company Profiles | SAP Concur, Expensify, Zoho Expense, Certify, TravelPerk, Chrome River, Rydoo, Coupa Software, Xero, SAP, Oracle, SutiSoft, Emburse, TripActions, Expedia Group |
| Key Drivers | • Increased use of cloud-based and mobile platforms for real-time expense management, improving accessibility and efficiency. • Growing need for solutions that manage travel logistics and expenses across distributed teams and international locations. |
| RESTRAINTS | • Storing sensitive financial and travel data on cloud platforms raises concerns about potential breaches and privacy issues. • Integrating travel and expense management software with existing enterprise systems can be time-consuming and complex. |
