image

Transparent Electronics Market Report Scope & Overview:

The Transparent Electronics Market was valued at USD 1.53 billion in 2023 and is expected to reach USD 7.25 billion by 2032, growing at a CAGR of 10.59% over the forecast period 2024-2032. Innovation in the transparent electronics market is advancing swiftly through the adoption of transparent solar panels as well as Building Integrated Photovoltaics (BIPV) in sustainable architecture. It is also getting integrated into EVs (Electric Vehicles), which complements HUDs and Smart Windows. Energy efficiency, design, and IoT compatibility are key adoption drivers in the construction and smart building sectors. Finally, new displays based on OLEDs and Micro LEDs are stretching limits to offer seamless, futuristic applications in automotive, commercial, and consumer electronics. The 2024 U.S. transparent electronics market shows remarkable progress in all fields. The construction sector also took a liking to transparent solar panels, especially with the rise of building-integrated photovoltaics (BIPV) and trends toward sustainable architecture.

The U.S. Transparent Electronics Market is estimated to be USD 1.36 billion in 2023 and is projected to grow at a CAGR of 9.85%. The increase in investments related to smart infrastructure and government initiatives aimed at promoting clean energy technologies, also, the change in R&D through nanomaterials and conductive films for the U.S. transparent electronics market, are projected to gain traction as the need for futuristic design in consumer devices will increase.

Market Dynamics

Key Drivers:

  • Emerging Applications and Material Innovations Fuel Growth in the Transparent Electronics Market Across Key Regions

The transparent electronics market is mainly driven by the increasing demand for next-generation display technologies in consumer electronics and automotive applications. The usage of transparent displays in augmented reality (AR) devices, smart wearables, and heads-up displays (HUDs) is growing, which is expected to spur additional growth in the market. Furthermore, growing smart cities and green architecture may also increase the transparent solar panels and smart windows across Europe and the Asia Pacific. Recent advancements in material science, like transparent conductive oxides (TCOs) and graphene-based components, are improving product efficiency and transparency, thus aiding market growth.

Restrain:

  • Performance Limitations of Transparent Materials Hinder Widespread Adoption in High Demand Application Areas

The transparent electronics market is expected to be restrained by the lower performance efficiency of transparent materials available today in comparison with conventional alternatives. While widely used, materials such as indium tin oxide (ITO) are limited in their flexibility and durability, which makes them impractical for use in dynamic or extreme environments. This can result in high transparency and/or conductivity, but can reduce the ability of the device to perform, especially in high-performing applications such as military or industrial systems. These technical compromises are not well-suited for ubiquitous adoption across all relevant sectors.

Opportunity:

  • Transparent Electronics Unlock Opportunities in Automotive Construction and Emerging Applications Through Smart Sustainable Innovations

Potential growth opportunities will be observed for these applications in the automobile and construction sectors. Autonomous vehicles: Transparent electronics for EV infotainment, windshield displays, and smart glass technology are in the pipeline. The use of transparent solar panels and smart windows for energy-efficient buildings is an attractive opportunity in the construction industry. It has also opened doors for R&D needed for flexible and stretchable transparent electronics, and additional research efforts could lead to breakthroughs in healthcare devices, military applications, and next-gen security systems. With a growing demand for sustainable, smart technologies within these industries, transparent electronics are likely to impact multiple verticals positively.

Challenges:

  • Challenges in Scalability and Standardization Hinder Widespread Adoption of Transparent Electronics Across Industries

Transparent electronic switching devices are still far from being scalable and mass-produced. The intricate processes for deposition of layers of transparent conductive materials to a very high degree of precision require advanced techniques that are yet to be established as a common pathway. In addition, embedding transparent electronics within the architecture of existing devices, e.g., automotive dashboards or large-scale building facades, requires extensive cross-industry collaboration and innovation in design and engineering. Also, new entrants and startups that want to commercialize emerging technologies have to clear existing barriers to enter the market, such as regulatory compliance and no universal standards for transparent electronic components. Overcoming these challenges is essential for realizing the full potential of transparent electronics in a broad range of applications.

Segment Analysis

By Product

Transparent Displays held a significant 46.6% share of the transparent electronics market in 2023. This is due to their high alignment in consumer electronics, automotive heads-up displays (HUDs), and retail advertising solutions. The excellent balance of visibility and informative visual content that transparent displays offer makes them the perfect candidate system for next-gen AR solutions, smart wearables,  and signage systems.

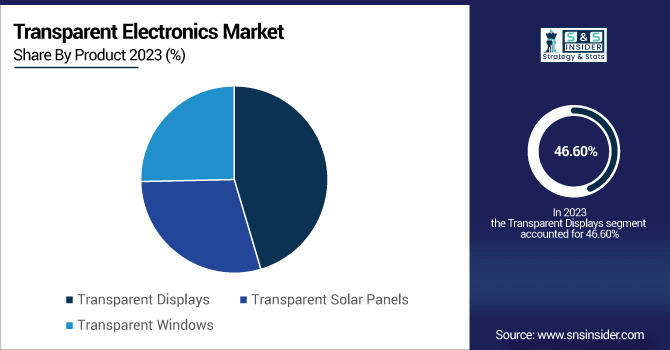
The Transparent Solar Panels segment is expected to hold the highest CAGR from 2024-2032. This property is fuelling the demand for these materials in the construction sector and the automotive sector, particularly in energy-efficient buildings and electric vehicles, as they can generate electricity while showing transparency. With green building trends rising around the world, transparent solar panels are also gradually being used in windows, facades, and skylights.

By Application

In 2023, Consumer Electronics dominated the transparent electronics market and captured nearly 36.5% of the overall revenue, research firm FindMarketResearch.com said on Tuesday. The other will aid in the domination of transparent displays for smartphones, smart wearables,  AR devices, and high-end televisions. Due to the overwhelming need for modern-day, design-oriented and interactive, and visually aesthetic-oriented devices, transparent electronics are being integrated massively, particularly within high-end consumer tech goods.

Automotive segment is expected to represent the fastest CAGR during the forecast period. (2024 — 2032) Transparent electronics is getting into the fast lane at the automotive end, specifically of electric and luxury vehicles, as well. Applications, like heads-up displays (HUDs), smart windows and even invisible infotainment panels are redefining the in-car user experience.

Regional Analysis

North America held a leading transparent electronics market share of 34.3% in 2023, owing to increasing demand for consumer electronics, defense, and automotive. The region is prominent at the forefront of advanced technology development, along with high R&D investments in the transparency displays, smart windows, and AR-enabled devices, which have resulted in early adoption of such technology in the markets. Such as companies like Apple or Microsoft bringing transparent technologies into their AR headsets or concepts of future devices. Regional market growth will also be increased due to transparent HUDs and smart glass that are being studied by General Motors and Ford, among other next-gen electric vehicles. Moreover, large research institutions and the supportive government also give North America to have a stronger hand in the market.

The Asia Pacific is projected to register the largest CAGR from 2024 to 2032. Countries including China, Japan and South Korea are leading the way in innovations relating to transparent solar panels and flexible transparent displays. Samsung and LG Display are developing transparent OLED, while transparent display concept phones have also been unveiled by a couple of companies including Xiaomi. In addition, increasing preference towards green buildings as well as BIPV (building-integrated photovoltaics) in China related to green architecture is likely to offer considerable profit-generating opportunities for transparent solar panels, with Asia Pacific being the leading region for growth in the coming years.

Key players

Some of the major players in the Transparent Electronics Market are:

  • Samsung Electronics (Transparent OLED Display),

  • LG Display (Transparent OLED Signage),

  • BOE Technology Group (55-inch Transparent OLED Panel),

  • Sharp Corporation (See-Through Display),

  • Panasonic Corporation (Transparent OLED TV),

  • Sony Corporation (Transparent Display Prototype),

  • AU Optronics (Transparent MicroLED Display),

  • Tianma Microelectronics (Transparent AMOLED Display),

  • Universal Display Corporation (UDC) (Transparent OLED Materials),

  • Zebra Imaging (Holographic Display),

  • Corning Incorporated (Gorilla Glass for Transparent Electronics),

  • Planar Systems (a Leyard company) (LookThru Transparent OLED Display),

  • OLEDWorks (Transparent OLED Lighting Panels),

  • Visionox (Transparent OLED Screens),

  • E Ink Holdings (E Ink Kaleido – Transparent ePaper Technology)

Recent Trends

  • In January 2024, Samsung unveiled its Transparent MICRO LED display at Samsung First Look, ahead of CES 2024, highlighting next-gen display technology with impressive transparency and image quality.

  • In December 2024, LG introduced the world's first transparent and true wireless 4K OLED TV, delivering a groundbreaking screen experience that blends cutting-edge visuals with an immersive, cable-free design.


Transparent Electronics Market Report Scope:

Report Attributes Details
Market Size in 2023 USD 1.53 Billion
Market Size by 2032 USD 7.25 Billion
CAGR CAGR of 18.90% From 2024 to 2032
Base Year 2023
Forecast Period 2024-2032
Historical Data 2020-2022
Report Scope & Coverage Market Size, Segments Analysis, Competitive  Landscape, Regional Analysis, DROC & SWOT Analysis, Forecast Outlook
Key Segments • By Product (Transparent Displays, Transparent Solar Panels, Transparent Windows)
• By Application (Consumer Electronics, Automotive, Construction, Healthcare, Military and Defense, Security Systems, Others)
Regional Analysis/Coverage North America (US, Canada, Mexico), Europe (Eastern Europe [Poland, Romania, Hungary, Turkey, Rest of Eastern Europe] Western Europe] Germany, France, UK, Italy, Spain, Netherlands, Switzerland, Austria, Rest of Western Europe]), Asia Pacific (China, India, Japan, South Korea, Vietnam, Singapore, Australia, Rest of Asia Pacific), Middle East & Africa (Middle East [UAE, Egypt, Saudi Arabia, Qatar, Rest of Middle East], Africa [Nigeria, South Africa, Rest of Africa], Latin America (Brazil, Argentina, Colombia, Rest of Latin America)
Company Profiles Samsung Electronics, LG Display, BOE Technology Group, Sharp Corporation, Panasonic Corporation, Sony Corporation, AU Optronics, Tianma Microelectronics, Universal Display Corporation, Zebra Imaging, Corning Incorporated, Planar Systems, OLEDWorks, Visionox, E Ink Holdings.

Frequently Asked Questions

Ans: The Transparent Electronics Market is expected to grow at a CAGR of 18.90% during 2024-2032.

Ans: Transparent Electronics Market size was USD 1.53 Billion in 2023 and is expected to Reach USD 7.25 Billion by 2032.

 Ans: The major growth factor of the Transparent Electronics market is the rising demand for energy-efficient and advanced display technologies across consumer electronics, automotive, and smart buildings.

Ans: The Transparent Displays segment dominated the Transparent Electronics market in 2023.

 Ans: North America dominated the Transparent Electronics Market in 2023.

Table of Content

1. Introduction

1.1 Market Definition

1.2 Scope (Inclusion and Exclusions)

1.3 Research Assumptions

2. Executive Summary

2.1 Market Overview

2.2 Regional Synopsis

2.3 Competitive Summary

3. Research Methodology

3.1 Top-Down Approach

3.2 Bottom-up Approach

3.3. Data Validation

3.4 Primary Interviews

4. Market Dynamics Impact Analysis

4.1 Market Driving Factors Analysis

4.1.1 Drivers

4.1.2 Restraints

4.1.3 Opportunities

4.1.4 Challenges

4.2 PESTLE Analysis

4.3 Porter’s Five Forces Model

5. Statistical Insights and Trends Reporting

5.1 Transparent Solar Panels and BIPV Adoption Rates

5.2 Integration of Transparent Electronics in EVs

5.3 Key Drivers of Adoption in Construction and Smart Buildings

5.4 Advanced Display Technologies

6. Competitive Landscape

6.1 List of Major Companies, By Region

6.2 Market Share Analysis, By Region

6.3 Product Benchmarking

6.3.1 Product specifications and features

6.3.2 Pricing

6.4 Strategic Initiatives

6.4.1 Marketing and promotional activities

6.4.2 Distribution and Supply Chain Strategies

6.4.3 Expansion plans and new product launches

6.4.4 Strategic partnerships and collaborations

6.5 Technological Advancements

6.6 Market Positioning and Branding

7. Transparent Electronics Market Segmentation, By Product

7.1 Chapter Overview

7.2 Transparent Displays

7.2.1 Transparent Displays Market Trends Analysis (2020-2032)

7.2.2 Transparent Displays Market Size Estimates and Forecasts to 2032 (USD BILLION)

7.3 Transparent Solar Panels

7.3.1 Transparent Solar Panels Market Trends Analysis (2020-2032)

7.3.2 Transparent Solar Panels Market Size Estimates and Forecasts to 2032 (USD BILLION)

7.4 Transparent Windows

7.4.1 Transparent Windows Market Trends Analysis (2020-2032)

7.4.2 Transparent Windows Market Size Estimates and Forecasts to 2032 (USD BILLION)

8. Transparent Electronics Market Segmentation, By Application

8.1 Chapter Overview

8.2 Consumer Electronics

8.2.1 Consumer Electronics Market Trends Analysis (2020-2032)

8.2.2 Consumer Electronics Market Size Estimates and Forecasts to 2032 (USD BILLION)

8.3 Automotive

8.3.1 Automotive Market Trends Analysis (2020-2032)

8.3.2 Automotive Market Size Estimates and Forecasts to 2032 (USD BILLION)

8.4 Construction

8.4.1 Construction Market Trends Analysis (2020-2032)

8.4.2 Construction Market Size Estimates and Forecasts to 2032 (USD BILLION)

8.5 Healthcare

8.5.1 Healthcare Market Trends Analysis (2020-2032)

8.5.2 Healthcare Market Size Estimates and Forecasts to 2032 (USD BILLION)

8.6 Military and Defense

8.6.1 Military and Defense Market Trends Analysis (2020-2032)

8.6.2 Military and Defense Market Size Estimates and Forecasts to 2032 (USD BILLION)

8.7 Security Systems

8.7.1 Security Systems Market Trends Analysis (2020-2032)

8.7.2 Security Systems Market Size Estimates and Forecasts to 2032 (USD BILLION)

8.8 Others

8.8.1 Others Market Trends Analysis (2020-2032)

8.8.2 Others Market Size Estimates and Forecasts to 2032 (USD BILLION)

9. Regional Analysis

9.1 Chapter Overview

9.2 North America

9.2.1 Trends Analysis

9.2.2 North America Transparent Electronics Market Estimates and Forecasts, by Country (2020-2032) (USD BILLION)

9.2.3 North America Transparent Electronics Market Estimates and Forecasts, By Product (2020-2032) (USD BILLION) 

9.2.4 North America Transparent Electronics Market Estimates and Forecasts, By Application (2020-2032) (USD BILLION)

9.2.5 USA

9.2.5.1 USA Transparent Electronics Market Estimates and Forecasts, By Product (2020-2032) (USD BILLION)

9.2.5.2 USA Transparent Electronics Market Estimates and Forecasts, By Application (2020-2032) (USD BILLION)

9.2.6 Canada

9.2.6.1 Canada Transparent Electronics Market Estimates and Forecasts, By Product (2020-2032) (USD BILLION)

9.2.6.2 Canada Transparent Electronics Market Estimates and Forecasts, By Application (2020-2032) (USD BILLION)

9.2.7 Mexico

9.2.7.1 Mexico Transparent Electronics Market Estimates and Forecasts, By Product (2020-2032) (USD BILLION)

9.2.7.2 Mexico Transparent Electronics Market Estimates and Forecasts, By Application (2020-2032) (USD BILLION)

9.3 Europe

9.3.1 Eastern Europe

9.3.1.1 Trends Analysis

9.3.1.2 Eastern Europe Transparent Electronics Market Estimates and Forecasts, by Country (2020-2032) (USD BILLION)

9.3.1.3 Eastern Europe Transparent Electronics Market Estimates and Forecasts, By Product (2020-2032) (USD BILLION) 

9.3.1.4 Eastern Europe Transparent Electronics Market Estimates and Forecasts, By Application (2020-2032) (USD BILLION)

9.3.1.5 Poland

9.3.1.5.1 Poland Transparent Electronics Market Estimates and Forecasts, By Product (2020-2032) (USD BILLION)

9.3.1.5.2 Poland Transparent Electronics Market Estimates and Forecasts, By Application (2020-2032) (USD BILLION)

9.3.1.6 Romania

9.3.1.6.1 Romania Transparent Electronics Market Estimates and Forecasts, By Product (2020-2032) (USD BILLION)

9.3.1.6.2 Romania Transparent Electronics Market Estimates and Forecasts, By Application (2020-2032) (USD BILLION)

9.3.1.7 Hungary

9.3.1.7.1 Hungary Transparent Electronics Market Estimates and Forecasts, By Product (2020-2032) (USD BILLION)

9.3.1.7.2 Hungary Transparent Electronics Market Estimates and Forecasts, By Application (2020-2032) (USD BILLION)

9.3.1.8 turkey

9.3.1.8.1 Turkey Transparent Electronics Market Estimates and Forecasts, By Product (2020-2032) (USD BILLION)

9.3.1.8.2 Turkey Transparent Electronics Market Estimates and Forecasts, By Application (2020-2032) (USD BILLION)

9.3.1.9 Rest of Eastern Europe

9.3.1.9.1 Rest of Eastern Europe Transparent Electronics Market Estimates and Forecasts, By Product (2020-2032) (USD BILLION)

9.3.1.9.2 Rest of Eastern Europe Transparent Electronics Market Estimates and Forecasts, By Application (2020-2032) (USD BILLION)

9.3.2 Western Europe

9.3.2.1 Trends Analysis

9.3.2.2 Western Europe Transparent Electronics Market Estimates and Forecasts, by Country (2020-2032) (USD BILLION)

9.3.2.3 Western Europe Transparent Electronics Market Estimates and Forecasts, By Product (2020-2032) (USD BILLION) 

9.3.2.4 Western Europe Transparent Electronics Market Estimates and Forecasts, By Application (2020-2032) (USD BILLION)

9.3.2.5 Germany

9.3.2.5.1 Germany Transparent Electronics Market Estimates and Forecasts, By Product (2020-2032) (USD BILLION)

9.3.2.5.2 Germany Transparent Electronics Market Estimates and Forecasts, By Application (2020-2032) (USD BILLION)

9.3.2.6 France

9.3.2.6.1 France Transparent Electronics Market Estimates and Forecasts, By Product (2020-2032) (USD BILLION)

9.3.2.6.2 France Transparent Electronics Market Estimates and Forecasts, By Application (2020-2032) (USD BILLION)

9.3.2.7 UK

9.3.2.7.1 UK Transparent Electronics Market Estimates and Forecasts, By Product (2020-2032) (USD BILLION)

9.3.2.7.2 UK Transparent Electronics Market Estimates and Forecasts, By Application (2020-2032) (USD BILLION)

9.3.2.8 Italy

9.3.2.8.1 Italy Transparent Electronics Market Estimates and Forecasts, By Product (2020-2032) (USD BILLION)

9.3.2.8.2 Italy Transparent Electronics Market Estimates and Forecasts, By Application (2020-2032) (USD BILLION)

9.3.2.9 Spain

9.3.2.9.1 Spain Transparent Electronics Market Estimates and Forecasts, By Product (2020-2032) (USD BILLION)

9.3.2.9.2 Spain Transparent Electronics Market Estimates and Forecasts, By Application (2020-2032) (USD BILLION)

9.3.2.10 Netherlands

9.3.2.10.1 Netherlands Transparent Electronics Market Estimates and Forecasts, By Product (2020-2032) (USD BILLION)

9.3.2.10.2 Netherlands Transparent Electronics Market Estimates and Forecasts, By Application (2020-2032) (USD BILLION)

9.3.2.11 Switzerland

9.3.2.11.1 Switzerland Transparent Electronics Market Estimates and Forecasts, By Product (2020-2032) (USD BILLION)

9.3.2.11.2 Switzerland Transparent Electronics Market Estimates and Forecasts, By Application (2020-2032) (USD BILLION)

9.3.2.12 Austria

9.3.2.12.1 Austria Transparent Electronics Market Estimates and Forecasts, By Product (2020-2032) (USD BILLION)

9.3.2.12.2 Austria Transparent Electronics Market Estimates and Forecasts, By Application (2020-2032) (USD BILLION)

9.3.2.13 Rest of Western Europe

9.3.2.13.1 Rest of Western Europe Transparent Electronics Market Estimates and Forecasts, By Product (2020-2032) (USD BILLION)

9.3.2.13.2 Rest of Western Europe Transparent Electronics Market Estimates and Forecasts, By Application (2020-2032) (USD BILLION)

9.4 Asia Pacific

9.4.1 Trends Analysis

9.4.2 Asia Pacific Transparent Electronics Market Estimates and Forecasts, by Country (2020-2032) (USD BILLION)

9.4.3 Asia Pacific Transparent Electronics Market Estimates and Forecasts, By Product (2020-2032) (USD BILLION) 

9.4.4 Asia Pacific Transparent Electronics Market Estimates and Forecasts, By Application (2020-2032) (USD BILLION)

9.4.5 China

9.4.5.1 China Transparent Electronics Market Estimates and Forecasts, By Product (2020-2032) (USD BILLION)

9.4.5.2 China Transparent Electronics Market Estimates and Forecasts, By Application (2020-2032) (USD BILLION)

9.4.6 India

9.4.5.1 India Transparent Electronics Market Estimates and Forecasts, By Product (2020-2032) (USD BILLION)

9.4.5.2 India Transparent Electronics Market Estimates and Forecasts, By Application (2020-2032) (USD BILLION)

9.4.5 Japan

9.4.5.1 Japan Transparent Electronics Market Estimates and Forecasts, By Product (2020-2032) (USD BILLION)

9.4.5.2 Japan Transparent Electronics Market Estimates and Forecasts, By Application (2020-2032) (USD BILLION)

9.4.6 South Korea

9.4.6.1 South Korea Transparent Electronics Market Estimates and Forecasts, By Product (2020-2032) (USD BILLION)

9.4.6.2 South Korea Transparent Electronics Market Estimates and Forecasts, By Application (2020-2032) (USD BILLION)

9.4.7 Vietnam

9.4.7.1 Vietnam Transparent Electronics Market Estimates and Forecasts, By Product (2020-2032) (USD BILLION)

9.2.7.2 Vietnam Transparent Electronics Market Estimates and Forecasts, By Application (2020-2032) (USD BILLION)

9.4.8 Singapore

9.4.8.1 Singapore Transparent Electronics Market Estimates and Forecasts, By Product (2020-2032) (USD BILLION)

9.4.8.2 Singapore Transparent Electronics Market Estimates and Forecasts, By Application (2020-2032) (USD BILLION)

9.4.9 Australia

9.4.9.1 Australia Transparent Electronics Market Estimates and Forecasts, By Product (2020-2032) (USD BILLION)

9.4.9.2 Australia Transparent Electronics Market Estimates and Forecasts, By Application (2020-2032) (USD BILLION)

9.4.10 Rest of Asia Pacific

9.4.10.1 Rest of Asia Pacific Transparent Electronics Market Estimates and Forecasts, By Product (2020-2032) (USD BILLION)

9.4.10.2 Rest of Asia Pacific Transparent Electronics Market Estimates and Forecasts, By Application (2020-2032) (USD BILLION)

9.5 Middle East and Africa

9.5.1 Middle East

9.5.1.1 Trends Analysis

9.5.1.2 Middle East Transparent Electronics Market Estimates and Forecasts, by Country (2020-2032) (USD BILLION)

9.5.1.3 Middle East Transparent Electronics Market Estimates and Forecasts, By Product (2020-2032) (USD BILLION) 

9.5.1.4 Middle East Transparent Electronics Market Estimates and Forecasts, By Application (2020-2032) (USD BILLION)

9.5.1.5 UAE

9.5.1.5.1 UAE Transparent Electronics Market Estimates and Forecasts, By Product (2020-2032) (USD BILLION)

9.5.1.5.2 UAE Transparent Electronics Market Estimates and Forecasts, By Application (2020-2032) (USD BILLION)

9.5.1.6 Egypt

9.5.1.6.1 Egypt Transparent Electronics Market Estimates and Forecasts, By Product (2020-2032) (USD BILLION)

9.5.1.6.2 Egypt Transparent Electronics Market Estimates and Forecasts, By Application (2020-2032) (USD BILLION)

9.5.1.7 Saudi Arabia

9.5.1.7.1 Saudi Arabia Transparent Electronics Market Estimates and Forecasts, By Product (2020-2032) (USD BILLION)

9.5.1.7.2 Saudi Arabia Transparent Electronics Market Estimates and Forecasts, By Application (2020-2032) (USD BILLION)

9.5.1.8 Qatar

9.5.1.8.1 Qatar Transparent Electronics Market Estimates and Forecasts, By Product (2020-2032) (USD BILLION)

9.5.1.8.2 Qatar Transparent Electronics Market Estimates and Forecasts, By Application (2020-2032) (USD BILLION)

9.5.1.9 Rest of Middle East

9.5.1.9.1 Rest of Middle East Transparent Electronics Market Estimates and Forecasts, By Product (2020-2032) (USD BILLION)

9.5.1.9.2 Rest of Middle East Transparent Electronics Market Estimates and Forecasts, By Application (2020-2032) (USD BILLION)

9.5.2 Africa

9.5.2.1 Trends Analysis

9.5.2.2 Africa Transparent Electronics Market Estimates and Forecasts, by Country (2020-2032) (USD BILLION)

9.5.2.3 Africa Transparent Electronics Market Estimates and Forecasts, By Product (2020-2032) (USD BILLION) 

9.5.2.4 Africa Transparent Electronics Market Estimates and Forecasts, By Application (2020-2032) (USD BILLION)

9.5.2.5 South Africa

9.5.2.5.1 South Africa Transparent Electronics Market Estimates and Forecasts, By Product (2020-2032) (USD BILLION)

9.5.2.5.2 South Africa Transparent Electronics Market Estimates and Forecasts, By Application (2020-2032) (USD BILLION)

9.5.2.6 Nigeria

9.5.2.6.1 Nigeria Transparent Electronics Market Estimates and Forecasts, By Product (2020-2032) (USD BILLION)

9.5.2.6.2 Nigeria Transparent Electronics Market Estimates and Forecasts, By Application (2020-2032) (USD BILLION)

9.5.2.7 Rest of Africa

9.5.2.7.1 Rest of Africa Transparent Electronics Market Estimates and Forecasts, By Product (2020-2032) (USD BILLION)

9.5.2.7.2 Rest of Africa Transparent Electronics Market Estimates and Forecasts, By Application (2020-2032) (USD BILLION)

9.6 Latin America

9.6.1 Trends Analysis

9.6.2 Latin America Transparent Electronics Market Estimates and Forecasts, by Country (2020-2032) (USD BILLION)

9.6.3 Latin America Transparent Electronics Market Estimates and Forecasts, By Product (2020-2032) (USD BILLION) 

9.6.4 Latin America Transparent Electronics Market Estimates and Forecasts, By Application (2020-2032) (USD BILLION)

9.6.5 Brazil

9.6.5.1 Brazil Transparent Electronics Market Estimates and Forecasts, By Product (2020-2032) (USD BILLION)

9.6.5.2 Brazil Transparent Electronics Market Estimates and Forecasts, By Application (2020-2032) (USD BILLION)

9.6.6 Argentina

9.6.6.1 Argentina Transparent Electronics Market Estimates and Forecasts, By Product (2020-2032) (USD BILLION)

9.6.6.2 Argentina Transparent Electronics Market Estimates and Forecasts, By Application (2020-2032) (USD BILLION)

9.6.7 Colombia

9.6.7.1 Colombia Transparent Electronics Market Estimates and Forecasts, By Product (2020-2032) (USD BILLION)

9.6.7.2 Colombia Transparent Electronics Market Estimates and Forecasts, By Application (2020-2032) (USD BILLION)

9.6.8 Rest of Latin America

9.6.8.1 Rest of Latin America Transparent Electronics Market Estimates and Forecasts, By Product (2020-2032) (USD BILLION)

9.6.8.2 Rest of Latin America Transparent Electronics Market Estimates and Forecasts, By Application (2020-2032) (USD BILLION)

10. Company Profiles

10.1 Samsung Electronics

10.1.1 Company Overview

10.1.2 Financial

10.1.3 Products/ Services Offered

110.1.4 SWOT Analysis

10.2 LG Display

10.2.1 Company Overview

10.2.2 Financial

10.2.3 Products/ Services Offered

10.2.4 SWOT Analysis

10.3 BOE Technology Group

10.3.1 Company Overview

10.3.2 Financial

10.3.3 Products/ Services Offered

10.3.4 SWOT Analysis

10.4 Sharp Corporation

10.4.1 Company Overview

10.4.2 Financial

10.4.3 Products/ Services Offered

10.4.4 SWOT Analysis

10.5 Panasonic Corporation

10.5.1 Company Overview

10.5.2 Financial

10.5.3 Products/ Services Offered

10.5.4 SWOT Analysis

10.6 Sony Corporation.

10.6.1 Company Overview

10.6.2 Financial

10.6.3 Products/ Services Offered

10.6.4 SWOT Analysis

10.7 AU Optronics

10.7.1 Company Overview

10.7.2 Financial

10.7.3 Products/ Services Offered

10.7.4 SWOT Analysis

10.8 Tianma Microelectronics

10.8.1 Company Overview

10.8.2 Financial

10.8.3 Products/ Services Offered

10.8.4 SWOT Analysis

10.9 Universal Display Corporation (UDC)

10.9.1 Company Overview

10.9.2 Financial

10.9.3 Products/ Services Offered

10.9.4 SWOT Analysis

10.10 Zebra Imaging

             10.9.1 Company Overview

10.9.2 Financial

10.9.3 Products/ Services Offered

10.9.4 SWOT Analysis

11. Use Cases and Best Practices

12. Conclusion

An accurate research report requires proper strategizing as well as implementation. There are multiple factors involved in the completion of good and accurate research report and selecting the best methodology to compete the research is the toughest part. Since the research reports we provide play a crucial role in any company’s decision-making process, therefore we at SNS Insider always believe that we should choose the best method which gives us results closer to reality. This allows us to reach at a stage wherein we can provide our clients best and accurate investment to output ratio.

Each report that we prepare takes a timeframe of 350-400 business hours for production. Starting from the selection of titles through a couple of in-depth brain storming session to the final QC process before uploading our titles on our website we dedicate around 350 working hours. The titles are selected based on their current market cap and the foreseen CAGR and growth.


The 5 steps process:

Step 1: Secondary Research:

Secondary Research or Desk Research is as the name suggests is a research process wherein, we collect data through the readily available information. In this process we use various paid and unpaid databases which our team has access to and gather data through the same. This includes examining of listed companies’ annual reports, Journals, SEC filling etc. Apart from this our team has access to various associations across the globe across different industries. Lastly, we have exchange relationships with various university as well as individual libraries.

Secondary Research

Step 2: Primary Research

When we talk about primary research, it is a type of study in which the researchers collect relevant data samples directly, rather than relying on previously collected data.  This type of research is focused on gaining content specific facts that can be sued to solve specific problems. Since the collected data is fresh and first hand therefore it makes the study more accurate and genuine.

We at SNS Insider have divided Primary Research into 2 parts.

Part 1 wherein we interview the KOLs of major players as well as the upcoming ones across various geographic regions. This allows us to have their view over the market scenario and acts as an important tool to come closer to the accurate market numbers. As many as 45 paid and unpaid primary interviews are taken from both the demand and supply side of the industry to make sure we land at an accurate judgement and analysis of the market.

This step involves the triangulation of data wherein our team analyses the interview transcripts, online survey responses and observation of on filed participants. The below mentioned chart should give a better understanding of the part 1 of the primary interview.

Primary Research

Part 2: In this part of primary research the data collected via secondary research and the part 1 of the primary research is validated with the interviews from individual consultants and subject matter experts.

Consultants are those set of people who have at least 12 years of experience and expertise within the industry whereas Subject Matter Experts are those with at least 15 years of experience behind their back within the same space. The data with the help of two main processes i.e., FGDs (Focused Group Discussions) and IDs (Individual Discussions). This gives us a 3rd party nonbiased primary view of the market scenario making it a more dependable one while collation of the data pointers.

Step 3: Data Bank Validation

Once all the information is collected via primary and secondary sources, we run that information for data validation. At our intelligence centre our research heads track a lot of information related to the market which includes the quarterly reports, the daily stock prices, and other relevant information. Our data bank server gets updated every fortnight and that is how the information which we collected using our primary and secondary information is revalidated in real time.

Data Bank Validation

Step 4: QA/QC Process

After all the data collection and validation our team does a final level of quality check and quality assurance to get rid of any unwanted or undesired mistakes. This might include but not limited to getting rid of the any typos, duplication of numbers or missing of any important information. The people involved in this process include technical content writers, research heads and graphics people. Once this process is completed the title gets uploader on our platform for our clients to read it.

Step 5: Final QC/QA Process:

This is the last process and comes when the client has ordered the study. In this process a final QA/QC is done before the study is emailed to the client. Since we believe in giving our clients a good experience of our research studies, therefore, to make sure that we do not lack at our end in any way humanly possible we do a final round of quality check and then dispatch the study to the client.

Key Segments:

By Product

  • Transparent Displays

  • Transparent Solar Panels

  • Transparent Windows

By Application

  • Consumer Electronics

  • Automotive

  • Construction

  • Healthcare

  • Military and Defense

  • Security Systems

  • Others

Request for Segment Customization as per your Business Requirement: Segment Customization Request

Regional Coverage:

North America

  • US

  • Canada

  • Mexico

Europe

  • Eastern Europe

    • Poland

    • Romania

    • Hungary

    • Turkey

    • Rest of Eastern Europe

  • Western Europe

    • Germany

    • France

    • UK

    • Italy

    • Spain

    • Netherlands

    • Switzerland

    • Austria

    • Rest of Western Europe

Asia Pacific

  • China

  • India

  • Japan

  • South Korea

  • Vietnam

  • Singapore

  • Australia

  • Rest of Asia Pacific

Middle East & Africa

  • Middle East

    • UAE

    • Egypt

    • Saudi Arabia

    • Qatar

    • Rest of Middle East

  • Africa

    • Nigeria

    • South Africa

    • Rest of Africa

Latin America

  • Brazil

  • Argentina

  • Colombia

  • Rest of Latin America

Request for Country Level Research Report: Country Level Customization Request

Available Customization

With the given market data, SNS Insider offers customization as per the company’s specific needs. The following customization options are available for the report:

  • Detailed Volume Analysis

  • Criss-Cross segment analysis (e.g. Product X Application)

  • Competitive Product Benchmarking

  • Geographic Analysis

  • Additional countries in any of the regions

  • Customized Data Representation

  • Detailed analysis and profiling of additional market players


  •            5000 (33% Discount)


  •            8950 (40% Discount)


  •            3050 (23% Discount)

Start a Conversation

Hi! Click one of our member below to chat on Phone