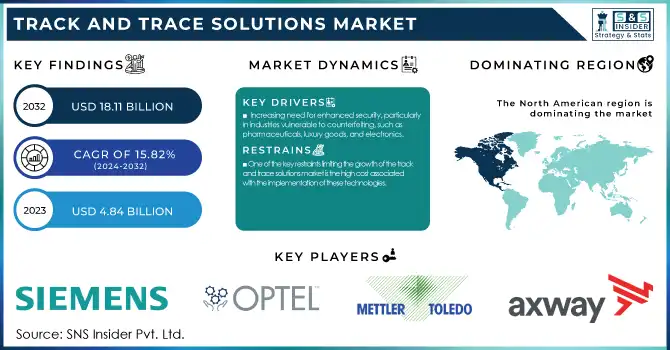
The Track and Trace Solutions Market size was valued at USD 4.84 billion in 2023 and is expected to reach USD 18.11 billion by 2032 at a CAGR of 15.82% during the forecast period of 2024-2032.
Get more information on Track and Trace Solutions Market - Request Sample Report
The track and trace solutions market is experiencing robust growth, driven by the increasing need for supply chain transparency, regulatory compliance, and enhanced product security. Industries such as pharmaceuticals, food and beverage, and consumer goods are adopting these solutions to ensure the authenticity, safety, and timely delivery of products. According to a 2023 survey by Zebra Technologies, 80% of supply chain professionals reported the need for better visibility to improve supply chain efficiency. The pharmaceutical industry, in particular, is a significant driver of this growth. For example, the FDA’s Drug Supply Chain Security Act (DSCSA) mandates that all pharmaceutical products in the U.S. must have a unique product identifier, a clear requirement for track and trace systems.
Technological innovations such as RFID, GPS, IoT, and blockchain are revolutionizing the way companies track products. RFID alone has been cited as a game-changer in warehouse operations, reducing the time needed for inventory management by up to 50%, according to a study by the Harvard Business Review. Similarly, the global adoption of GPS technology for supply chain logistics has improved asset tracking accuracy, reducing lost goods and minimizing transit delays. Companies like Amazon and Walmart have integrated advanced track and trace solutions into their logistics networks to improve delivery times and customer satisfaction. For example, Amazon’s use of IoT sensors and GPS technology has helped streamline its fulfillment centers, reducing operational costs and enhancing the speed of deliveries.
Blockchain technology is also making waves in industries like pharmaceuticals, where it is used to prevent counterfeiting. Companies such as MediLedger and IBM’s Food Trust network are leveraging blockchain for traceability, allowing every step of a product’s journey to be recorded in an immutable ledger, which helps verify authenticity and safety. Additionally, consumer goods and luxury brands are adopting track and trace systems to combat counterfeiting. For instance, luxury fashion brands like LVMH and Prada use RFID and QR codes to guarantee the authenticity of their high-end products, offering consumers confidence in their purchases.
As e-commerce continues to grow, with global online retail sales projected to reach USD 8.1 trillion by 2026, the need for efficient track-and-trace solutions is more critical than ever. Consumers expect transparency regarding the origin and delivery status of their purchases, pushing businesses to implement real-time tracking and data-sharing technologies. The demand for such solutions is clear: 62% of consumers reported that they would prefer to buy from a brand offering complete product traceability, according to a 2022 study by GS1.
Drivers
Increasing need for enhanced security, particularly in industries vulnerable to counterfeiting, such as pharmaceuticals, luxury goods, and electronics.
Counterfeiting is a significant global issue, especially in sectors like healthcare, where counterfeit drugs can pose severe risks to public health. Track and trace technologies, including RFID and blockchain, allow for real-time tracking of products throughout the supply chain. These technologies create a tamper-proof digital trail, verifying product authenticity and ensuring that goods have not been altered or replaced during transportation. This level of security is crucial for maintaining consumer trust, protecting brand integrity, and complying with regulations aimed at preventing counterfeit goods from entering the market. As counterfeiting techniques become more sophisticated, these solutions play a pivotal role in safeguarding both businesses and consumers.
Increasing regulatory requirements across various industries, particularly pharmaceuticals, food, and beverages, are driving the adoption of track and trace solutions.
Governments worldwide are implementing stringent laws to ensure product safety and transparency. For example, in the pharmaceutical sector, regulations such as the Drug Supply Chain Security Act (DSCSA) in the U.S. and the Falsified Medicines Directive (FMD) in Europe mandate the use of track and trace systems to prevent counterfeit drugs from reaching consumers. Similarly, food safety regulations require full traceability of products to respond quickly in case of contamination or product recalls. These regulations require companies to invest in systems that provide real-time visibility, making it easier to trace the origin, movement, and destination of goods. As regulations continue to evolve, compliance with these requirements will remain a major driver for businesses to adopt effective track-and-trace solutions.
The rapid growth of e-commerce is another significant factor driving the Track and Trace Solutions Market.
With online shopping expanding globally, customers expect greater transparency and control over their purchases. Real-time tracking, including updates on the location and estimated delivery time of products, is now a standard expectation among consumers. Research indicates that 62% of consumers prioritize the ability to track their orders over other factors when making online purchases. As e-commerce giants like Amazon and Walmart continuously improve their logistics networks, other companies are also feeling the pressure to adopt similar technologies to meet customer expectations. The widespread use of mobile devices and apps that allow consumers to track their orders in real time further amplifies the demand for track-and-trace solutions. Consequently, businesses are investing in these technologies to maintain customer satisfaction and loyalty.
Restraints
One of the key restraints limiting the growth of the track and trace solutions market is the high cost associated with the implementation of these technologies.
The integration of advanced systems such as RFID, GPS, IoT, and blockchain into existing supply chain infrastructures can be expensive, particularly for small and medium-sized enterprises (SMEs) that may lack the financial resources to invest in such technologies. Additionally, these solutions often require significant changes in operational processes, employee training, and system upgrades, all of which add to the overall cost. The complexity of integrating multiple technologies, especially in large, global supply chains, can also be a barrier. Ensuring seamless data exchange between various systems while maintaining real-time visibility can be technically challenging and time-consuming. As a result, businesses may hesitate to adopt track and trace solutions despite their potential benefits, slowing the overall market growth.
By Product
In 2023, software solutions dominated the track and trace solutions market, accounting for 42.2% market share. These solutions are essential for managing data, providing real-time tracking, and enabling reporting across various stages of the supply chain. Software solutions are preferred due to their ability to integrate various technologies like RFID, IoT, and GPS into a unified platform that ensures comprehensive traceability. The growth of cloud-based platforms and SaaS models has made it easier for businesses to deploy track and trace systems with minimal upfront costs while offering scalability and flexibility. The software also enables companies to comply with industry regulations, boost efficiency, and improve supply chain transparency. As the need for digital transformation across industries continues to rise, software solutions will remain the dominant force in the market.
The hardware components segment, which includes devices like RFID tags, sensors, and GPS tracking systems, is the fastest-growing segment in the Track and Trace Solutions Market. This growth is largely driven by the increasing demand for accurate, real-time tracking of products, especially in industries like pharmaceuticals, food, and logistics, where precise monitoring is crucial. The rise of advanced technologies such as IoT and RFID is significantly improving the capability of hardware solutions, enabling more effective and efficient tracking. As industries continue to adopt automation and seek to optimize supply chain operations, the demand for advanced hardware components that provide real-time data will continue to expand.
By Application
Serialization solutions dominated the track and trace solutions market in 2023, as they are critical for ensuring product authenticity and compliance with industry regulations. Serialization assigns a unique identifier to each product, enabling traceability from the manufacturer to the end consumer. This solution is especially important in the pharmaceutical industry, where regulations such as the Drug Supply Chain Security Act and the Falsified Medicines Directive require robust traceability measures to prevent counterfeit products. Serialization helps enhance patient safety, improving brand protection, and enabling efficient recalls, making it a vital component of track and trace systems. With increasing regulatory pressures and growing consumer demands for verified products, serialization is expected to continue to lead the market.
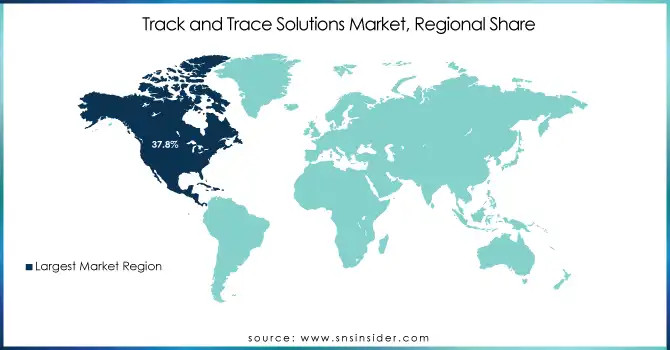
The North American region dominated the track and trace solutions market in 2023 with 37.8% market share, with the U.S. being a key contributor. The presence of stringent regulatory frameworks, such as the Drug Supply Chain Security Act (DSCSA), drives the adoption of track-and-trace solutions in sectors like pharmaceuticals. Additionally, the increasing adoption of advanced technologies such as IoT, RFID, and cloud computing further fuels the demand for these solutions in the region. The region's strong focus on supply chain security and product authenticity, along with the presence of key market players, contributes to its market leadership.
In Europe, the market is also witnessing substantial growth, primarily due to regulations like the Falsified Medicines Directive (FMD), which mandates traceability in the pharmaceutical sector. The European market is increasingly shifting toward automated solutions to improve supply chain efficiency, with countries like Germany, the U.K., and France leading the way in adopting these technologies. As e-commerce and logistics become more complex, demand for end-to-end visibility is rising in Europe.
The Asia-Pacific region, however, is expected to grow at the fastest rate due to the rapid industrialization of countries like China, India, and Japan. The region is experiencing a surge in demand for track and trace solutions, particularly in industries such as pharmaceuticals, food, and electronics. With increased regulatory pressure and the rising need for enhanced supply chain management, Asia-Pacific is emerging as a key growth hub for the market.
Need any customization research on Track and Trace Solutions Market - Enquiry Now
Mettler-Toledo International, Inc.
Optel Vision
Adents
Antares Vision S.r.l
Korber AG
ACG Worldwide
Markem Imaje, a Dover Company
Syntegon Technology GmbH
Marchesini Group S.p.A.
Laetus GmbH
Systech International Inc.
Zebra Technologies Corporation
IBM Corporation
SAP SE
Siemens S.A.
Honeywell International Inc.
HCL Technologies
In March 2024, MNG integrated Venom blockchain technology to enhance its track-and-trace capabilities. Venom's secure, transparent, and scalable ledger is specifically designed to meet the needs of the modern logistics industry.
In March 2024, Systech, a leader in digital traceability and serialization and part of Markem-Imaje and Dover, expanded its product portfolio and global presence with the acquisition of Pharmacontrol Electronic GmbH (PCE), a leading provider of pharmaceutical track-and-trace solutions in Europe.
Report Attributes | Details |
---|---|
Market Size in 2023 | US$ 4.84 Billion |
Market Size by 2032 | US$ 18.11 Billion |
CAGR | CAGR of 15.82% From 2024 to 2032 |
Base Year | 2022 |
Forecast Period | 2023-2030 |
Historical Data | 2020-2022 |
Report Scope & Coverage | Market Size, Segments Analysis, Competitive Landscape, Regional Analysis, DROC & SWOT Analysis, Forecast Outlook |
Key Segments |
• By Product (Software Solutions, Hardware Components, Standalone Platforms) |
Regional Analysis/Coverage | North America (USA, Canada, Mexico), Europe (Germany, UK, France, Italy, Spain, Netherlands, Rest of Europe), Asia-Pacific (Japan, South Korea, China, India, Australia, Rest of Asia-Pacific), The Middle East & Africa (Israel, UAE, South Africa, Rest of Middle East & Africa), Latin America (Brazil, Argentina, Rest of Latin America) |
Company Profiles |
Axway, Mettler-Toledo International, Inc., Optel Vision, TraceLink, Inc., Adents, Antares Vision S.r.l, Siemens AG, Korber AG, ACG Worldwide, Markem Imaje a Dover Company, Syntegon Technology GmbH, Marchesini Group S.p.A., Lateus GmbH, Systech international Inc., Zebra Technologies Corportation, IBM Corportation, SAP SE, Accenture Plc.,Siemens S.A., Honeywell International Inc., HCL Technologies. |
DRIVERS | • Increasing need for enhanced security, particularly in industries vulnerable to counterfeiting, such as pharmaceuticals, luxury goods, and electronics. • Increasing regulatory requirements across various industries, particularly pharmaceuticals, food, and beverages, are driving the adoption of track and trace solutions. • The rapid growth of e-commerce is another significant factor driving the Track and Trace Solutions Market. |
Restaints | • One of the key restraints limiting the growth of the track and trace solutions market is the high cost associated with the implementation of these technologies. |
Track and Trace Solutions Market Size was valued at USD 4.84 billion in 2023.
Ans: The Track and Trace Solutions market is to grow at a CAGR of 15.82% over the forecast period 2024-2032.
Due to the availability of highly controlled serialisation and aggregation requirements, as well as advanced healthcare infrastructure, North America accounted for the biggest revenue share.
The generic and over-the-counter drug marketplaces are experiencing rapid expansion, and the medical device sector is growing at a rapid pace are all propelling the Track and Trace Solutions market forward.
Setup expenditures are enormous is the main restraints of the Pancreatic and Biliary Stents market
Table of Contents
1. Introduction
1.1 Market Definition
1.2 Scope (Inclusion and Exclusions)
1.3 Research Assumptions
2. Executive Summary
2.1 Market Overview
2.2 Regional Synopsis
2.3 Competitive Summary
3. Research Methodology
3.1 Top-Down Approach
3.2 Bottom-up Approach
3.3. Data Validation
3.4 Primary Interviews
4. Market Dynamics Impact Analysis
4.1 Market Driving Factors Analysis
4.1.1 Drivers
4.1.2 Restraints
4.1.3 Opportunities
4.1.4 Challenges
4.2 PESTLE Analysis
4.3 Porter’s Five Forces Model
5. Statistical Insights and Trends Reporting
5.1 Adoption and Implementation Trends (2023), by Region
5.2 Technology Trends (2023)
5.3 Healthcare Spending Impact (by Region, 2023)
5.4 Prescription and Regulatory Trends (2023), by Region
6. Competitive Landscape
6.1 List of Major Companies, By Region
6.2 Market Share Analysis, By Region
6.3 Product Benchmarking
6.3.1 Product specifications and features
6.3.2 Pricing
6.4 Strategic Initiatives
6.4.1 Marketing and promotional activities
6.4.2 Distribution and Supply Chain Strategies
6.4.3 Expansion plans and new product launches
6.4.4 Strategic partnerships and collaborations
6.5 Technological Advancements
6.6 Market Positioning and Branding
7. Track and Trace Solutions Market Segmentation, by Product
7.1 Chapter Overview
7.2 Software Solutions
7.2.1 Software Solutions Market Trends Analysis (2020-2032)
7.2.2 Software Solutions Market Size Estimates and Forecasts to 2032 (USD Billion)
7.2.3 Plant managers
7.2.3.1 Plant Managers Market Trends Analysis (2020-2032)
7.2.3.2 Plant Managers Market Size Estimates and Forecasts to 2032 (USD Billion)
7.2.4 Enterprise & network managers
7.2.4.1 Enterprise & Network Managers Market Trends Analysis (2020-2032)
7.2.4.2 Enterprise & Network Managers Market Size Estimates and Forecasts to 2032 (USD Billion)
7.2.5 Line controllers
7.2.5.1 Line Controllers Market Trends Analysis (2020-2032)
7.2.5.2 Line Controllers Market Size Estimates and Forecasts to 2032 (USD Billion)
7.2.6 Bundle tracking solutions
7.2.6.1 Bundle Tracking Solutions Market Trends Analysis (2020-2032)
7.2.6.2 Bundle Tracking Solutions Market Size Estimates and Forecasts to 2032 (USD Billion)
7.2.7 Case tracking solutions
7.2.7.1 Case Tracking Solutions Market Trends Analysis (2020-2032)
7.2.7.2 Case Tracking Solutions Market Size Estimates and Forecasts to 2032 (USD Billion)
7.2.8 Warehouse and shipment managers
7.2.8.1 Warehouse and shipment managers Market Trends Analysis (2020-2032)
7.2.8.2 Warehouse and Shipment Managers Market Size Estimates and Forecasts to 2032 (USD Billion)
7.2.9 Pallet Tracking Solutions
7.2.9.1 Pallet Tracking Solutions Market Trends Analysis (2020-2032)
7.2.9.2 Pallet Tracking Solutions Market Size Estimates and Forecasts to 2032 (USD Billion)
7.3 Hardware components
7.3.1 Hardware Components Market Trends Analysis (2020-2032)
7.3.2 Hardware Components Market Size Estimates and Forecasts to 2032 (USD Billion)
7.3.3 Printing and marking solutions
7.3.3.1 Printing and Marking Solutions Market Trends Analysis (2020-2032)
7.3.3.2 Printing and Marking Solutions Market Size Estimates and Forecasts to 2032 (USD Billion)
7.3.4 Barcode scanners
7.3.4.1 Barcode Scanners Market Trends Analysis (2020-2032)
7.3.4.2 Barcode Scanners Market Size Estimates and Forecasts to 2032 (USD Billion)
7.3.5 Monitoring And Verification Solutions
7.3.5.1 Monitoring And Verification Solutions Market Trends Analysis (2020-2032)
7.3.5.2 Monitoring And Verification Solutions Market Size Estimates and Forecasts to 2032 (USD Billion)
7.3.6 Labelers
7.3.6.1 Labelers Market Trends Analysis (2020-2032)
7.3.6.2 Labelers Market Size Estimates and Forecasts to 2032 (USD Billion)
7.3.7 Checkweighers
7.3.7.1 Checkweighers Market Trends Analysis (2020-2032)
7.3.7.2 Checkweighers Market Size Estimates and Forecasts to 2032 (USD Billion)
7.3.8 RFID readers
7.3.8.1 RFID readers Market Trends Analysis (2020-2032)
7.3.8.2 RFID readers Market Size Estimates and Forecasts to 2032 (USD Billion)
7.4 Standalone platforms
7.4.1 Standalone Platforms Market Trends Analysis (2020-2032)
7.4.2 Standalone Platforms Market Size Estimates and Forecasts to 2032 (USD Billion)
8. Track and Trace Solutions Market Segmentation, By Application
8.1 Chapter Overview
8.2 Serialization solutions
8.2.1 Serialization Solutions Market Trends Analysis (2020-2032)
8.2.2 Serialization Solutions Market Size Estimates and Forecasts to 2032 (USD Billion)
8.3 Aggregation solutions
8.3.1 Aggregation Solutions Market Trends Analysis (2020-2032)
8.3.2 Aggregation Solutions Market Size Estimates And Forecasts To 2032 (USD Billion)
8.4 Tracking, tracing, and Reporting solutions
8.4.1 Tracking, tracing, and Reporting solutions Market Trends Analysis (2020-2032)
8.4.2 Tracking, tracing, and Reporting solutions Market Size Estimates And Forecasts To 2032 (USD Billion)
9. Track and Trace Solutions Market Segmentation, by Technology
9.1 Chapter Overview
9.2 2D barcodes
9.2.1 2D barcodes Market Trends Analysis (2020-2032)
9.2.2 2D barcodes Market Size Estimates and Forecasts to 2032 (USD Billion)
9.3 Radiofrequency identification
9.3.1 Radiofrequency Identification Market Trends Analysis (2020-2032)
9.3.2 Radiofrequency Identification Market Size Estimates and Forecasts to 2032 (USD Billion)
9.4 Linear barcodes
9.4.1 Linear Barcodes Market Trends Analysis (2020-2032)
9.4.2 Linear Barcodes Market Size Estimates and Forecasts to 2032 (USD Billion)
10. Track and Trace Solutions Market Segmentation, By End User
10.1 Chapter Overview
10.2 Pharmaceutical and biopharmaceutical companies
10.2.1 Pharmaceutical and biopharmaceutical companies Market Trends Analysis (2020-2032)
10.2.2 Pharmaceutical and Biopharmaceutical Companies Market Size Estimates and Forecasts to 2032 (USD Billion)
10.3 Food industry
10.3.1 Food Industry Market Trends Analysis (2020-2032)
10.3.2 Food Industry Market Size Estimates and Forecasts to 2032 (USD Billion)
10.4 Medical device companies
10.4.1 Medical Device Companies Market Trends Analysis (2020-2032)
10.4.2 Medical Device Companies Market Size Estimates and Forecasts to 2032 (USD Billion)
10.5 Cosmetic industry
10.5.1 Cosmetic Industry Market Trends Analysis (2020-2032)
10.5.2 Cosmetic Industry Market Size Estimates and Forecasts to 2032 (USD Billion)
10.6 Others
10.6.1 Others Market Trends Analysis (2020-2032)
10.6.2 Others Market Size Estimates and Forecasts to 2032 (USD Billion)
11. Regional Analysis
11.1 Chapter Overview
11.2 North America
11.2.1 Trends Analysis
11.2.2 North America Track and Trace Solutions Market Estimates and Forecasts, by Country (2020-2032) (USD Billion)
11.2.3 North America Track and Trace Solutions Market Estimates and Forecasts, by Product (2020-2032) (USD Billion)
11.2.4 North America Track and Trace Solutions Market Estimates and Forecasts, By Application (2020-2032) (USD Billion)
11.2.5 North America Track and Trace Solutions Market Estimates and Forecasts, by Technology (2020-2032) (USD Billion)
11.2.6 North America Track and Trace Solutions Market Estimates and Forecasts, By End User (2020-2032) (USD Billion)
11.2.7 USA
11.2.7.1 USA Track and Trace Solutions Market Estimates and Forecasts, by Product (2020-2032) (USD Billion)
11.2.7.2 USA Track and Trace Solutions Market Estimates and Forecasts, By Application (2020-2032) (USD Billion)
11.2.7.3 USA Track and Trace Solutions Market Estimates and Forecasts, by Technology (2020-2032) (USD Billion)
11.2.7.4 USA Track and Trace Solutions Market Estimates and Forecasts, By End User (2020-2032) (USD Billion)
11.2.8 Canada
11.2.8.1 Canada Track and Trace Solutions Market Estimates and Forecasts, by Product (2020-2032) (USD Billion)
11.2.8.2 Canada Track and Trace Solutions Market Estimates and Forecasts, By Application (2020-2032) (USD Billion)
11.2.8.3 Canada Track and Trace Solutions Market Estimates and Forecasts, by Technology (2020-2032) (USD Billion)
11.2.8.4 Canada Track and Trace Solutions Market Estimates and Forecasts, By End User (2020-2032) (USD Billion)
11.2.9 Mexico
11.2.9.1 Mexico Track and Trace Solutions Market Estimates and Forecasts, by Product (2020-2032) (USD Billion)
11.2.9.2 Mexico Track and Trace Solutions Market Estimates and Forecasts, By Application (2020-2032) (USD Billion)
11.2.9.3 Mexico Track and Trace Solutions Market Estimates and Forecasts, by Technology (2020-2032) (USD Billion)
11.2.9.4 Mexico Track and Trace Solutions Market Estimates and Forecasts, By End User (2020-2032) (USD Billion
11.3 Europe
11.3.1 Eastern Europe
11.3.1.1 Trends Analysis
11.3.1.2 Eastern Europe Track and Trace Solutions Market Estimates and Forecasts, by Country (2020-2032) (USD Billion)
11.3.1.3 Eastern Europe Track and Trace Solutions Market Estimates and Forecasts, by Product (2020-2032) (USD Billion)
11.3.1.4 Eastern Europe Track and Trace Solutions Market Estimates and Forecasts, By Application (2020-2032) (USD Billion)
11.3.1.5 Eastern Europe Track and Trace Solutions Market Estimates and Forecasts, by Technology (2020-2032) (USD Billion)
11.3.1.6 Eastern Europe Track and Trace Solutions Market Estimates and Forecasts, By End User (2020-2032) (USD Billion)
11.3.1.7 Poland
11.3.1.7.1 Poland Track and Trace Solutions Market Estimates and Forecasts, by Product (2020-2032) (USD Billion)
11.3.1.7.2 Poland Track and Trace Solutions Market Estimates and Forecasts, By Application (2020-2032) (USD Billion)
11.3.1.7.3 Poland Track and Trace Solutions Market Estimates and Forecasts, by Technology (2020-2032) (USD Billion)
11.3.1.7.4 Poland Track and Trace Solutions Market Estimates and Forecasts, By End User (2020-2032) (USD Billion)
11.3.1.8 Romania
11.3.1.8.1 Romania Track and Trace Solutions Market Estimates and Forecasts, by Product (2020-2032) (USD Billion)
11.3.1.8.2 Romania Track and Trace Solutions Market Estimates and Forecasts, By Application (2020-2032) (USD Billion)
11.3.1.8.3 Romania Track and Trace Solutions Market Estimates and Forecasts, by Technology (2020-2032) (USD Billion)
11.3.1.8.4 Romania Track and Trace Solutions Market Estimates and Forecasts, By End User (2020-2032) (USD Billion)
11.3.1.9 Hungary
11.3.1.9.1 Hungary Track and Trace Solutions Market Estimates and Forecasts, by Product (2020-2032) (USD Billion)
11.3.1.9.2 Hungary Track and Trace Solutions Market Estimates and Forecasts, By Application (2020-2032) (USD Billion)
11.3.1.9.3 Hungary Track and Trace Solutions Market Estimates and Forecasts, by Technology (2020-2032) (USD Billion)
11.3.1.9.4 Hungary Track and Trace Solutions Market Estimates and Forecasts, By End User (2020-2032) (USD Billion)
11.3.1.10 Turkey
11.3.1.10.1 Turkey Track and Trace Solutions Market Estimates and Forecasts, by Product (2020-2032) (USD Billion)
11.3.1.10.2 Turkey Track and Trace Solutions Market Estimates and Forecasts, By Application (2020-2032) (USD Billion)
11.3.1.10.3 Turkey Track and Trace Solutions Market Estimates and Forecasts, by Technology (2020-2032) (USD Billion)
11.3.1.10.4 Turkey Track and Trace Solutions Market Estimates and Forecasts, By End User (2020-2032) (USD Billion)
11.3.1.11 Rest of Eastern Europe
11.3.1.11.1 Rest of Eastern Europe Track and Trace Solutions Market Estimates and Forecasts, by Product (2020-2032) (USD Billion)
11.3.1.11.2 Rest of Eastern Europe Track and Trace Solutions Market Estimates and Forecasts, By Application (2020-2032) (USD Billion)
11.3.1.11.3 Rest of Eastern Europe Track and Trace Solutions Market Estimates and Forecasts, by Technology (2020-2032) (USD Billion)
11.3.1.11.4 Rest of Eastern Europe Track and Trace Solutions Market Estimates and Forecasts, By End User (2020-2032) (USD Billion)
11.3.2 Western Europe
11.3.2.1 Trends Analysis
11.3.2.2 Western Europe Track and Trace Solutions Market Estimates and Forecasts, by Country (2020-2032) (USD Billion)
11.3.2.3 Western Europe Track and Trace Solutions Market Estimates and Forecasts, by Product (2020-2032) (USD Billion)
11.3.2.4 Western Europe Track and Trace Solutions Market Estimates and Forecasts, By Application (2020-2032) (USD Billion)
11.3.2.5 Western Europe Track and Trace Solutions Market Estimates and Forecasts, by Technology (2020-2032) (USD Billion)
11.3.2.6 Western Europe Track and Trace Solutions Market Estimates and Forecasts, By End User (2020-2032) (USD Billion)
11.3.2.7 Germany
11.3.2.7.1 Germany Track and Trace Solutions Market Estimates and Forecasts, by Product (2020-2032) (USD Billion)
11.3.2.7.2 Germany Track and Trace Solutions Market Estimates and Forecasts, By Application (2020-2032) (USD Billion)
11.3.2.7.3 Germany Track and Trace Solutions Market Estimates and Forecasts, by Technology (2020-2032) (USD Billion)
11.3.2.7.4 Germany Track and Trace Solutions Market Estimates and Forecasts, By End User (2020-2032) (USD Billion)
11.3.2.8 France
11.3.2.8.1 France Track and Trace Solutions Market Estimates and Forecasts, by Product (2020-2032) (USD Billion)
11.3.2.8.2 France Track and Trace Solutions Market Estimates and Forecasts, By Application (2020-2032) (USD Billion)
11.3.2.8.3 France Track and Trace Solutions Market Estimates and Forecasts, by Technology(2020-2032) (USD Billion)
11.3.2.8.4 France Track and Trace Solutions Market Estimates and Forecasts, By End User (2020-2032) (USD Billion)
11.3.2.9 UK
11.3.2.9.1 UK Track and Trace Solutions Market Estimates and Forecasts, by Product (2020-2032) (USD Billion)
11.3.2.9.2 UK Track and Trace Solutions Market Estimates and Forecasts, By Application (2020-2032) (USD Billion)
11.3.2.9.3 UK Track and Trace Solutions Market Estimates and Forecasts, by Technology(2020-2032) (USD Billion)
11.3.2.9.4 UK Track and Trace Solutions Market Estimates and Forecasts, By End User (2020-2032) (USD Billion)
11.3.2.10 Italy
11.3.2.10.1 Italy Track and Trace Solutions Market Estimates and Forecasts, by Product (2020-2032) (USD Billion)
11.3.2.10.2 Italy Track and Trace Solutions Market Estimates and Forecasts, By Application (2020-2032) (USD Billion)
11.3.2.10.3 Italy Track and Trace Solutions Market Estimates and Forecasts, by Technology(2020-2032) (USD Billion)
11.3.2.10.4 Italy Track and Trace Solutions Market Estimates and Forecasts, By End User (2020-2032) (USD Billion)
11.3.2.11 Spain
11.3.2.11.1 Spain Track and Trace Solutions Market Estimates and Forecasts, by Product (2020-2032) (USD Billion)
11.3.2.11.2 Spain Track and Trace Solutions Market Estimates and Forecasts, By Application (2020-2032) (USD Billion)
11.3.2.11.3 Spain Track and Trace Solutions Market Estimates and Forecasts, by Technology (2020-2032) (USD Billion)
11.3.2.11.4 Spain Track and Trace Solutions Market Estimates and Forecasts, By End User (2020-2032) (USD Billion)
11.3.2.12 Netherlands
11.3.2.12.1 Netherlands Track and Trace Solutions Market Estimates and Forecasts, by Product (2020-2032) (USD Billion)
11.3.2.12.2 Netherlands Track and Trace Solutions Market Estimates and Forecasts, By Application (2020-2032) (USD Billion)
11.3.2.12.3 Netherlands Track and Trace Solutions Market Estimates and Forecasts, by Technology (2020-2032) (USD Billion)
11.3.2.12.4 Netherlands Track and Trace Solutions Market Estimates and Forecasts, By End User (2020-2032) (USD Billion)
11.3.2.13 Switzerland
11.3.2.13.1 Switzerland Track and Trace Solutions Market Estimates and Forecasts, by Product (2020-2032) (USD Billion)
11.3.2.13.2 Switzerland Track and Trace Solutions Market Estimates and Forecasts, By Application (2020-2032) (USD Billion)
11.3.2.13.3 Switzerland Track and Trace Solutions Market Estimates and Forecasts, by Technology (2020-2032) (USD Billion)
11.3.2.13.4 Switzerland Track and Trace Solutions Market Estimates and Forecasts, By End User (2020-2032) (USD Billion)
11.3.2.14 Austria
11.3.2.14.1 Austria Track and Trace Solutions Market Estimates and Forecasts, by Product (2020-2032) (USD Billion)
11.3.2.14.2 Austria Track and Trace Solutions Market Estimates and Forecasts, By Application (2020-2032) (USD Billion)
11.3.2.14.3 Austria Track and Trace Solutions Market Estimates and Forecasts, by Technology (2020-2032) (USD Billion)
11.3.2.14.4 Austria Track and Trace Solutions Market Estimates and Forecasts, By End User (2020-2032) (USD Billion)
11.3.2.15 Rest of Western Europe
11.3.2.15.1 Rest of Western Europe Track and Trace Solutions Market Estimates and Forecasts, by Product (2020-2032) (USD Billion)
11.3.2.15.2 Rest of Western Europe Track and Trace Solutions Market Estimates and Forecasts, By Application (2020-2032) (USD Billion)
11.3.2.15.3 Rest of Western Europe Track and Trace Solutions Market Estimates and Forecasts, by Technology (2020-2032) (USD Billion)
11.3.2.15.4 Rest of Western Europe Track and Trace Solutions Market Estimates and Forecasts, By End User (2020-2032) (USD Billion)
11.4 Asia Pacific
11.4.1 Trends Analysis
11.4.2 Asia Pacific Track and Trace Solutions Market Estimates and Forecasts, by Country (2020-2032) (USD Billion)
11.4.3 Asia Pacific Track and Trace Solutions Market Estimates and Forecasts, by Product (2020-2032) (USD Billion)
11.4.4 Asia Pacific Track and Trace Solutions Market Estimates and Forecasts, By Application (2020-2032) (USD Billion)
11.4.5 Asia Pacific Track and Trace Solutions Market Estimates and Forecasts, by Technology (2020-2032) (USD Billion)
11.4.6 Asia Pacific Track and Trace Solutions Market Estimates and Forecasts, By End User (2020-2032) (USD Billion)
11.4.7 China
11.4.7.1 China Track and Trace Solutions Market Estimates and Forecasts, by Product (2020-2032) (USD Billion)
11.4.7.2 China Track and Trace Solutions Market Estimates and Forecasts, By Application (2020-2032) (USD Billion)
11.4.7.3 China Track and Trace Solutions Market Estimates and Forecasts, by Technology (2020-2032) (USD Billion)
11.4.7.4 China Track and Trace Solutions Market Estimates and Forecasts, By End User (2020-2032) (USD Billion)
11.4.8 India
11.4.8.1 India Track and Trace Solutions Market Estimates and Forecasts, by Product (2020-2032) (USD Billion)
11.4.8.2 India Track and Trace Solutions Market Estimates and Forecasts, By Application (2020-2032) (USD Billion)
11.4.8.3 India Track and Trace Solutions Market Estimates and Forecasts, by Technology (2020-2032) (USD Billion)
11.4.8.4 India Track and Trace Solutions Market Estimates and Forecasts, By End User (2020-2032) (USD Billion)
11.4.9 Japan
11.4.9.1 Japan Track and Trace Solutions Market Estimates and Forecasts, by Product (2020-2032) (USD Billion)
11.4.9.2 Japan Track and Trace Solutions Market Estimates and Forecasts, By Application (2020-2032) (USD Billion)
11.4.9.3 Japan Track and Trace Solutions Market Estimates and Forecasts, by Technology (2020-2032) (USD Billion)
11.4.9.4 Japan Track and Trace Solutions Market Estimates and Forecasts, By End User (2020-2032) (USD Billion)
11.4.10 South Korea
11.4.10.1 South Korea Track and Trace Solutions Market Estimates and Forecasts, by Product (2020-2032) (USD Billion)
11.4.10.2 South Korea Track and Trace Solutions Market Estimates and Forecasts, By Application (2020-2032) (USD Billion)
11.4.10.3 South Korea Track and Trace Solutions Market Estimates and Forecasts, by Technology (2020-2032) (USD Billion)
11.4.10.4 South Korea Track and Trace Solutions Market Estimates and Forecasts, By End User (2020-2032) (USD Billion)
11.4.11 Vietnam
11.4.11.1 Vietnam Track and Trace Solutions Market Estimates and Forecasts, by Product (2020-2032) (USD Billion)
11.4.11.2 Vietnam Track and Trace Solutions Market Estimates and Forecasts, By Application (2020-2032) (USD Billion)
11.4.11.3 Vietnam Track and Trace Solutions Market Estimates and Forecasts, by Technology(2020-2032) (USD Billion)
11.4.11.4 Vietnam Track and Trace Solutions Market Estimates and Forecasts, By End User (2020-2032) (USD Billion)
11.4.12 Singapore
11.4.12.1 Singapore Track and Trace Solutions Market Estimates and Forecasts, by Product (2020-2032) (USD Billion)
11.4.12.2 Singapore Track and Trace Solutions Market Estimates and Forecasts, By Application (2020-2032) (USD Billion)
11.4.12.3 Singapore Track and Trace Solutions Market Estimates and Forecasts, by Technology (2020-2032) (USD Billion)
11.4.12.4 Singapore Track and Trace Solutions Market Estimates and Forecasts, By End User (2020-2032) (USD Billion)
11.4.13 Australia
11.4.13.1 Australia Track and Trace Solutions Market Estimates and Forecasts, by Product (2020-2032) (USD Billion)
11.4.13.2 Australia Track and Trace Solutions Market Estimates and Forecasts, By Application (2020-2032) (USD Billion)
11.4.13.3 Australia Track and Trace Solutions Market Estimates and Forecasts, by Technology(2020-2032) (USD Billion)
11.4.13.4 Australia Track and Trace Solutions Market Estimates and Forecasts, By End User (2020-2032) (USD Billion)
11.4.14 Rest of Asia Pacific
11.4.14.1 Rest of Asia Pacific Track and Trace Solutions Market Estimates and Forecasts, by Product (2020-2032) (USD Billion)
11.4.14.2 Rest of Asia Pacific Track and Trace Solutions Market Estimates and Forecasts, By Application (2020-2032) (USD Billion)
11.4.14.3 Rest of Asia Pacific Track and Trace Solutions Market Estimates and Forecasts, by Technology (2020-2032) (USD Billion)
11.4.14.4 Rest of Asia Pacific Track and Trace Solutions Market Estimates and Forecasts, By End User (2020-2032) (USD Billion)
11.5 Middle East and Africa
11.5.1 Middle East
11.5.1.1 Trends Analysis
11.5.1.2 Middle East Track and Trace Solutions Market Estimates and Forecasts, by Country (2020-2032) (USD Billion)
11.5.1.3 Middle East Track and Trace Solutions Market Estimates and Forecasts, by Product (2020-2032) (USD Billion)
11.5.1.4 Middle East Track and Trace Solutions Market Estimates and Forecasts, By Application (2020-2032) (USD Billion)
11.5.1.5 Middle East Track and Trace Solutions Market Estimates and Forecasts, by Technology (2020-2032) (USD Billion)
11.5.1.6 Middle East Track and Trace Solutions Market Estimates and Forecasts, By End User (2020-2032) (USD Billion)
11.5.1.7 UAE
11.5.1.7.1 UAE Track and Trace Solutions Market Estimates and Forecasts, by Product (2020-2032) (USD Billion)
11.5.1.7.2 UAE Track and Trace Solutions Market Estimates and Forecasts, By Application (2020-2032) (USD Billion)
11.5.1.7.3 UAE Track and Trace Solutions Market Estimates and Forecasts, by Technology (2020-2032) (USD Billion)
11.5.1.7.4 UAE Track and Trace Solutions Market Estimates and Forecasts, By End User (2020-2032) (USD Billion)
11.5.1.8 Egypt
11.5.1.8.1 Egypt Track and Trace Solutions Market Estimates and Forecasts, by Product (2020-2032) (USD Billion)
11.5.1.8.2 Egypt Track and Trace Solutions Market Estimates and Forecasts, By Application (2020-2032) (USD Billion)
11.5.1.8.3 Egypt Track and Trace Solutions Market Estimates and Forecasts, by Technology (2020-2032) (USD Billion)
11.5.1.8.4 Egypt Track and Trace Solutions Market Estimates and Forecasts, By End User (2020-2032) (USD Billion)
11.5.1.9 Saudi Arabia
11.5.1.9.1 Saudi Arabia Track and Trace Solutions Market Estimates and Forecasts, by Product (2020-2032) (USD Billion)
11.5.1.9.2 Saudi Arabia Track and Trace Solutions Market Estimates and Forecasts, By Application (2020-2032) (USD Billion)
11.5.1.9.3 Saudi Arabia Track and Trace Solutions Market Estimates and Forecasts, by Technology (2020-2032) (USD Billion)
11.5.1.9.4 Saudi Arabia Track and Trace Solutions Market Estimates and Forecasts, By End User (2020-2032) (USD Billion)
11.5.1.10 Qatar
11.5.1.10.1 Qatar Track and Trace Solutions Market Estimates and Forecasts, by Product (2020-2032) (USD Billion)
11.5.1.10.2 Qatar Track and Trace Solutions Market Estimates and Forecasts, By Application (2020-2032) (USD Billion)
11.5.1.10.3 Qatar Track and Trace Solutions Market Estimates and Forecasts, by Technology (2020-2032) (USD Billion)
11.5.1.10.4 Qatar Track and Trace Solutions Market Estimates and Forecasts, By End User (2020-2032) (USD Billion)
11.5.1.11 Rest of Middle East
11.5.1.11.1 Rest of Middle East Track and Trace Solutions Market Estimates and Forecasts, by Product (2020-2032) (USD Billion)
11.5.1.11.2 Rest of Middle East Track and Trace Solutions Market Estimates and Forecasts, By Application (2020-2032) (USD Billion)
11.5.1.11.3 Rest of Middle East Track and Trace Solutions Market Estimates and Forecasts, by Technology (2020-2032) (USD Billion)
11.5.1.11.4 Rest of Middle East Track and Trace Solutions Market Estimates and Forecasts, By End User (2020-2032) (USD Billion)
11.5.2 Africa
11.5.2.1 Trends Analysis
11.5.2.2 Africa Track and Trace Solutions Market Estimates and Forecasts, by Country (2020-2032) (USD Billion)
11.5.2.3 Africa Track and Trace Solutions Market Estimates and Forecasts, by Product (2020-2032) (USD Billion)
11.5.2.4 Africa Track and Trace Solutions Market Estimates and Forecasts, By Application (2020-2032) (USD Billion)
11.5.2.5 Africa Track and Trace Solutions Market Estimates and Forecasts, by Technology (2020-2032) (USD Billion)
11.5.2.6 Africa Track and Trace Solutions Market Estimates and Forecasts, By End User (2020-2032) (USD Billion)
11.5.2.7 South Africa
11.5.2.7.1 South Africa Track and Trace Solutions Market Estimates and Forecasts, by Product (2020-2032) (USD Billion)
11.5.2.7.2 South Africa Track and Trace Solutions Market Estimates and Forecasts, By Application (2020-2032) (USD Billion)
11.5.2.7.3 South Africa Track and Trace Solutions Market Estimates and Forecasts, by Technology (2020-2032) (USD Billion)
11.5.2.7.4 South Africa Track and Trace Solutions Market Estimates and Forecasts, By End User (2020-2032) (USD Billion)
11.5.2.8 Nigeria
11.5.2.8.1 Nigeria Track and Trace Solutions Market Estimates and Forecasts, by Product (2020-2032) (USD Billion)
11.5.2.8.2 Nigeria Track and Trace Solutions Market Estimates and Forecasts, By Application (2020-2032) (USD Billion)
11.5.2.8.3 Nigeria Track and Trace Solutions Market Estimates and Forecasts, by Technology (2020-2032) (USD Billion)
11.5.2.8.4 Nigeria Track and Trace Solutions Market Estimates and Forecasts, By End User (2020-2032) (USD Billion)
11.5.2.9 Rest of Africa
11.5.2.9.1 Rest of Africa Track and Trace Solutions Market Estimates and Forecasts, by Product (2020-2032) (USD Billion)
11.5.2.9.2 Rest of Africa Track and Trace Solutions Market Estimates and Forecasts, By Application (2020-2032) (USD Billion)
11.5.2.9.3 Rest of Africa Track and Trace Solutions Market Estimates and Forecasts, by Technology (2020-2032) (USD Billion)
11.5.2.9.4 Rest of Africa Track and Trace Solutions Market Estimates and Forecasts, By End User (2020-2032) (USD Billion)
11.6 Latin America
11.6.1 Trends Analysis
11.6.2 Latin America Track and Trace Solutions Market Estimates and Forecasts, by Country (2020-2032) (USD Billion)
11.6.3 Latin America Track and Trace Solutions Market Estimates and Forecasts, by Product (2020-2032) (USD Billion)
11.6.4 Latin America Track and Trace Solutions Market Estimates and Forecasts, By Application (2020-2032) (USD Billion)
11.6.5 Latin America Track and Trace Solutions Market Estimates and Forecasts, by Technology (2020-2032) (USD Billion)
11.6.6 Latin America Track and Trace Solutions Market Estimates and Forecasts, By End User (2020-2032) (USD Billion)
11.6.7 Brazil
11.6.7.1 Brazil Track and Trace Solutions Market Estimates and Forecasts, by Product (2020-2032) (USD Billion)
11.6.7.2 Brazil Track and Trace Solutions Market Estimates and Forecasts, By Application (2020-2032) (USD Billion)
11.6.7.3 Brazil Track and Trace Solutions Market Estimates and Forecasts, by Technology (2020-2032) (USD Billion)
11.6.7.4 Brazil Track and Trace Solutions Market Estimates and Forecasts, By End User (2020-2032) (USD Billion)
11.6.8 Argentina
11.6.8.1 Argentina Track and Trace Solutions Market Estimates and Forecasts, by Product (2020-2032) (USD Billion)
11.6.8.2 Argentina Track and Trace Solutions Market Estimates and Forecasts, By Application (2020-2032) (USD Billion)
11.6.8.3 Argentina Track and Trace Solutions Market Estimates and Forecasts, by Technology (2020-2032) (USD Billion)
11.6.8.4 Argentina Track and Trace Solutions Market Estimates and Forecasts, By End User (2020-2032) (USD Billion)
11.6.9 Colombia
11.6.9.1 Colombia Track and Trace Solutions Market Estimates and Forecasts, by Product (2020-2032) (USD Billion)
11.6.9.2 Colombia Track and Trace Solutions Market Estimates and Forecasts, By Application (2020-2032) (USD Billion)
11.6.9.3 Colombia Track and Trace Solutions Market Estimates and Forecasts, by Technology (2020-2032) (USD Billion)
11.6.9.4 Colombia Track and Trace Solutions Market Estimates and Forecasts, By End User (2020-2032) (USD Billion)
11.6.10 Rest of Latin America
11.6.10.1 Rest of Latin America Track and Trace Solutions Market Estimates and Forecasts, by Product (2020-2032) (USD Billion)
11.6.10.2 Rest of Latin America Track and Trace Solutions Market Estimates and Forecasts, By Application (2020-2032) (USD Billion)
11.6.10.3 Rest of Latin America Track and Trace Solutions Market Estimates and Forecasts, by Technology (2020-2032) (USD Billion)
11.6.10.4 Rest of Latin America Track and Trace Solutions Market Estimates and Forecasts, By End User (2020-2032) (USD Billion)
12. Company Profiles
12.1 Axway
12.1.1 Company Overview
12.1.2 Financial
12.1.3 Product Types/ Services Offered
12.1.4 SWOT Analysis
12.2 Mettler-Toledo International, Inc.
12.2.1 Company Overview
12.2.2 Financial
12.2.3 Product Types/ Services Offered
12.2.4 SWOT Analysis
12.3 Optel Vision
12.3.1 Company Overview
12.3.2 Financial
12.3.3 Product Types/ Services Offered
12.3.4 SWOT Analysis
12.4 TraceLink, Inc.
12.4.1 Company Overview
12.4.2 Financial
12.4.3 Product Types/ Services Offered
12.4.4 SWOT Analysis
12.5 Adents
12.5.1 Company Overview
12.5.2 Financial
12.5.3 Product Types/ Services Offered
12.5.4 SWOT Analysis
12.6 Siemens AG
12.6.1 Company Overview
12.6.2 Financial
12.6.3 Product Types/ Services Offered
12.6.4 SWOT Analysis
12.7 Markem Imaje, a Dover Company
12.7.1 Company Overview
12.7.2 Financial
12.7.3 Product Types/ Services Offered
12.7.4 SWOT Analysis
12.8 Syntegon Technology GmbH
12.8.1 Company Overview
12.8.2 Financial
12.8.3 Product Types/ Services Offered
12.8.4 SWOT Analysis
12.9 Zebra Technologies Corporation
12.9.1 Company Overview
12.9.2 Financial
12.9.3 Product Types/ Services Offered
12.9.4 SWOT Analysis
12.10 Systech International Inc.
12.10.1 Company Overview
12.10.2 Financial
12.10.3 Product Types/ Services Offered
12.10.4 SWOT Analysis
13. Use Cases and Best Practices
14. Conclusion
An accurate research report requires proper strategizing as well as implementation. There are multiple factors involved in the completion of good and accurate research report and selecting the best methodology to compete the research is the toughest part. Since the research reports we provide play a crucial role in any company’s decision-making process, therefore we at SNS Insider always believe that we should choose the best method which gives us results closer to reality. This allows us to reach at a stage wherein we can provide our clients best and accurate investment to output ratio.
Each report that we prepare takes a timeframe of 350-400 business hours for production. Starting from the selection of titles through a couple of in-depth brain storming session to the final QC process before uploading our titles on our website we dedicate around 350 working hours. The titles are selected based on their current market cap and the foreseen CAGR and growth.
The 5 steps process:
Step 1: Secondary Research:
Secondary Research or Desk Research is as the name suggests is a research process wherein, we collect data through the readily available information. In this process we use various paid and unpaid databases which our team has access to and gather data through the same. This includes examining of listed companies’ annual reports, Journals, SEC filling etc. Apart from this our team has access to various associations across the globe across different industries. Lastly, we have exchange relationships with various university as well as individual libraries.
Step 2: Primary Research
When we talk about primary research, it is a type of study in which the researchers collect relevant data samples directly, rather than relying on previously collected data. This type of research is focused on gaining content specific facts that can be sued to solve specific problems. Since the collected data is fresh and first hand therefore it makes the study more accurate and genuine.
We at SNS Insider have divided Primary Research into 2 parts.
Part 1 wherein we interview the KOLs of major players as well as the upcoming ones across various geographic regions. This allows us to have their view over the market scenario and acts as an important tool to come closer to the accurate market numbers. As many as 45 paid and unpaid primary interviews are taken from both the demand and supply side of the industry to make sure we land at an accurate judgement and analysis of the market.
This step involves the triangulation of data wherein our team analyses the interview transcripts, online survey responses and observation of on filed participants. The below mentioned chart should give a better understanding of the part 1 of the primary interview.
Part 2: In this part of primary research the data collected via secondary research and the part 1 of the primary research is validated with the interviews from individual consultants and subject matter experts.
Consultants are those set of people who have at least 12 years of experience and expertise within the industry whereas Subject Matter Experts are those with at least 15 years of experience behind their back within the same space. The data with the help of two main processes i.e., FGDs (Focused Group Discussions) and IDs (Individual Discussions). This gives us a 3rd party nonbiased primary view of the market scenario making it a more dependable one while collation of the data pointers.
Step 3: Data Bank Validation
Once all the information is collected via primary and secondary sources, we run that information for data validation. At our intelligence centre our research heads track a lot of information related to the market which includes the quarterly reports, the daily stock prices, and other relevant information. Our data bank server gets updated every fortnight and that is how the information which we collected using our primary and secondary information is revalidated in real time.
Step 4: QA/QC Process
After all the data collection and validation our team does a final level of quality check and quality assurance to get rid of any unwanted or undesired mistakes. This might include but not limited to getting rid of the any typos, duplication of numbers or missing of any important information. The people involved in this process include technical content writers, research heads and graphics people. Once this process is completed the title gets uploader on our platform for our clients to read it.
Step 5: Final QC/QA Process:
This is the last process and comes when the client has ordered the study. In this process a final QA/QC is done before the study is emailed to the client. Since we believe in giving our clients a good experience of our research studies, therefore, to make sure that we do not lack at our end in any way humanly possible we do a final round of quality check and then dispatch the study to the client.
By Product
Software Solutions
Plant managers
Enterprise & network managers
Line controllers
Bundle tracking solutions
Case tracking solutions
Warehouse and shipment managers
Pallet tracking solutions
Hardware components
Printing and marking solutions
Barcode scanners
Monitoring and verification solutions
Labelers
Checkweighers
RFID readers
Standalone platforms
By Application
Serialization solutions
Carton Serialization
Bottle Serialization
medical device serialization
Blister Serialization
Vial and ampoule Serialization
Aggregation solutions
Case Aggregation
Pallet aggregation
Bundle Aggregation
Tracking, tracing, and Reporting solutions
By Technology
2D barcodes
Radiofrequency identification
Linear barcodes
By End Users
Pharmaceutical and biopharmaceutical companies
Food industry
Medical device companies
Cosmetic industry
Others
Request for Segment Customization as per your Business Requirement: Segment Customization Request
Regional Coverage:
North America
US
Canada
Mexico
Europe
Eastern Europe
Poland
Romania
Hungary
Turkey
Rest of Eastern Europe
Western Europe
Germany
France
UK
Italy
Spain
Netherlands
Switzerland
Austria
Rest of Western Europe
Asia Pacific
China
India
Japan
South Korea
Vietnam
Singapore
Australia
Rest of Asia Pacific
Middle East & Africa
Middle East
UAE
Egypt
Saudi Arabia
Qatar
Rest of the Middle East
Africa
Nigeria
South Africa
Rest of Africa
Latin America
Brazil
Argentina
Colombia
Rest of Latin America
Request for Country Level Research Report: Country Level Customization Request
Available Customization
With the given market data, SNS Insider offers customization to meet the company’s specific needs. The following customization options are available for the report:
Product Analysis
Criss-Cross segment analysis (e.g. Product X Application)
Product Matrix which gives a detailed comparison of the product portfolio of each company
Geographic Analysis
Additional countries in any of the regions
Company Information
Detailed analysis and profiling of additional market players (Up to five)
The Computerized Physician Order Entry Market Size was valued at USD 1.81 billion in 2023, and expected to reach USD 3.25 billion by 2032, and grow at a CAGR of 6.7% over the forecast period 2024-2032.
The Biological Safety Testing Products and Services Market size was valued at $4.42 Bn in 2023 & will reach $10.51 Bn by 2032 & growing at a CAGR of 10.10% Over the Forecast period of 2024-2032.
The Generative AI in Healthcare Market size was valued at US$ 1.7 Bn in 2023 and is estimated to US$ 19.99 Bn by 2032 with a growing CAGR of 31.5% Over the Forecast Period of 2024-2032.
The Medical Equipment Rental Market was valued at USD 58.57 Billion in 2023 and is expected to reach USD 97.69 billion by 2032 and grow at a CAGR of 5.85% over the forecast period 2024-2032.
The Enteral Feeding Devices Market size was valued at USD 4.15 billion in 2023 and is expected to reach USD 7.06 billion by 2032 and grow at a CAGR of 6.11% over the forecast period 2024-2032.
The Biopreservation Market size was estimated at USD 3.5 billion in 2023 and is expected to reach USD 14.3 billion by 2032 at a CAGR of 17.0% during the forecast period of 2024-2032.
Hi! Click one of our member below to chat on Phone