image

Touch Screen Display Market Size & Overview:

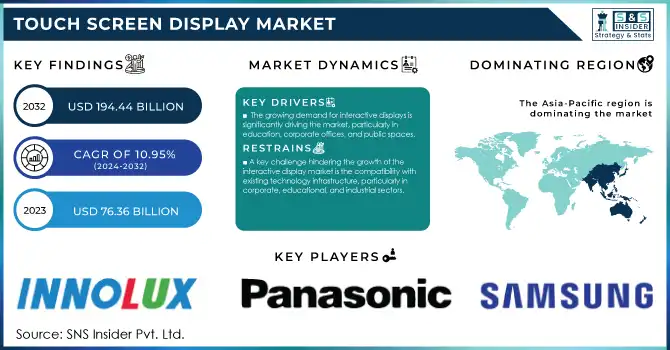
The Touch Screen Display Market Size was valued at USD 76.36 billion in 2023 and is expected to reach USD 194.44 billion by 2032, growing at a robust CAGR of 10.95% during the forecast period of 2024-2032.

The Touch Screen Display Market is experiencing substantial growth driven by the escalating demand for consumer electronics, particularly smartphones, tablets, and other touch-enabled devices. As technology continues to evolve, OLED and AMOLED display technologies are becoming more prevalent, offering superior color accuracy, better energy efficiency, and thinner form factors, which further fuel adoption in mobile devices and wearables.

Touch Screen Display Market Revenue Analysis

Get More Information on Touch Screen Display MarketRequest Free Sample Report

IoT and Big Data are transforming industries by enabling smart devices to collect and transmit vast amounts of real-time data, creating more demand for advanced touch interfaces to interact with these systems. Beyond consumer devices, sectors like automotive, retail, healthcare, and education are increasingly leveraging touch screen displays to provide more interactive, user-friendly experiences, further expanding the market.

The automotive sector is one of the most notable examples of touch screen integration, with 97% of vehicles sold in the United States now featuring at least one touchscreen. While the National Highway Traffic Safety Administration (NHTSA) mandated backup cameras in 2018 to save approximately 70 lives per year, the public's obsession with touchscreens in vehicles has grown far beyond just safety. Currently, 60 million vehicles are equipped with a center stack display, and that number is expected to increase to 75 million units by 2025, reaching 80 million units. The size of these screens is also expanding rapidly; in 2022, about 12 million vehicles had displays larger than 11 inches, and this number is expected to nearly double to 25 million by 2025 and 35 million, signaling a significant shift toward larger, more advanced touch interfaces in vehicles. While this demographic shift may alleviate some wage pressures from the higher salaries commanded by experienced workers, it also signals a steady drain of critical knowledge and skills from the workforce. Industries must act quickly to capture and disseminate this valuable knowledge before it is lost, as the demand for new technology, including advanced touch displays, continues to grow.The rising need for automation and remote access is also pushing demand in the enterprise sector. Touch screen displays are integral to self-service kiosks, point-of-sale (POS) systems, interactive digital signage, and smart home devices like thermostats and kitchen appliances, which are becoming central in modern homes. In conclusion, technological innovations and the integration of touch screens across a broad range of sectors are driving rapid expansion in the touch display market, with major advancements in display technologies like OLED and AMOLED being key contributors.

Touch Screen Display Market Dynamics

Drivers

  • The growing demand for interactive displays is significantly driving the market, particularly in education, corporate offices, and public spaces.

The shift towards more engaging and dynamic environments, where touch-enabled screens enable seamless communication, collaboration, and interaction, is a key factor in this rise. Interactive touchscreens are replacing traditional whiteboards, allowing for better student engagement through multimedia content and real-time collaboration, which is enhancing learning experiences and academic outcomes., this shift is particularly evident in the retail sector, where high-street experiences are being transformed with interactive touch displays that enhance customer engagement, enabling users to interact with the content and access tailored product information directly from the screen. these displays are becoming increasingly ubiquitous in smart retail, with more retail environments adopting touchscreens for point-of-sale (POS) systems and digital signage, which improves customer interaction and purchasing decisions. Design Reuse highlights how the evolution of small- and medium-sized AMFPD (Active Matrix Flat Panel Display) technologies has led to fluctuating revenue projections by application, particularly in educational and corporate sectors, due to their high adoption rate and ability to cater to diverse needs. The ability to interact with these screens is enhancing user experience, driving efficiency, and offering businesses more opportunities for brand interaction. The ongoing technological advancements, coupled with the growing demand for improved communication and engagement, are making interactive touch displays indispensable in these sectors, propelling significant growth in the market.

Restraints

  • A key challenge hindering the growth of the interactive display market is the compatibility with existing technology infrastructure, particularly in corporate, educational, and industrial sectors.

Many organizations continue to rely on legacy systems, which can create integration issues with new interactive touchscreens. Older devices, platforms, and display interfaces, such as resistive touchscreens, often lack the advanced capabilities found in modern systems, including multi-touch or gesture control features. The introduction of advanced displays—like the Lenovo Yoga Book 9i with dual 4K touchscreens—while offering cutting-edge features, may require significant upgrades or modifications to integrate with older systems, leading to additional costs and time investments. According to Electronics Weekly (2025), several interactive displays, such as 7-inch color touchscreens built to last 20,000 hours, may not align with the existing infrastructure in many businesses or educational institutions, as they may still be operating on outdated hardware or software. Moreover, the need for regular software updates and specialized drivers to ensure compatibility may cause disruptions in multi-device environments, leading to further complications. This issue is even more pronounced in specialized sectors like military applications, where touchscreen technology must meet stringent operational standards which may not align with older, less adaptable systems. These integration challenges present a significant barrier to widespread adoption, as organizations must ensure their current systems can accommodate these advanced interactive displays without large-scale overhauls. Given the increasing need for seamless connectivity across industries, resolving these compatibility issues is crucial for unlocking the full potential of interactive displays, ensuring that businesses and institutions can fully embrace the benefits of modern touch technology.

Touch Screen Display Market Segment Analysis

By Screen Type

In 2023, capacitive touch screens held the largest share of the Touch Screen Display Market, accounting for around 57%. This dominance is driven by their enhanced sensitivity, durability, and ability to support multi-touch functionality, making them a preferred choice for smartphones, tablets, consumer electronics, and automotive applications. Capacitive screens offer high clarity, fast response times, and greater resistance to wear compared to resistive screens. Their ability to detect touch through the electrical properties of the human body, without requiring pressure, improves the overall user experience. With growing, demand for more interactive and intuitive devices across various industries, the adoption of capacitive touch screens is set to continue expanding.

Infrared touch screens are expected to be the fastest-growing segment in the touch screen display market during the forecast period from 2024 to 2032. Their rapid growth is attributed to their versatility and ability to detect touch without physical contact, making them ideal for large displays, public kiosks, interactive signage, and other applications requiring durable, high-performance touch technology. Infrared touch screens offer advantages such as multi-touch capability, high sensitivity, and resistance to wear, making them suitable for a variety of industries, including retail, healthcare, and transportation. Additionally, their cost-effectiveness and ease of integration into large-format displays are further driving their adoption, ensuring continued market expansion.

By End User

In 2023, the residential segment accounted for approximately 59% of the touch screen display market, driven by the growing adoption of smart home technologies and interactive devices. With an increasing number of consumers integrating smart devices such as voice assistants, smart thermostats, and home automation systems into their daily lives, the demand for touch screen displays has surged. These displays provide enhanced user experience, offering intuitive and easy interaction for controlling home appliances, security systems, and entertainment devices. The rise in smart kitchens, where touch-enabled screens are incorporated into appliances like refrigerators and ovens, further boosts market growth. As smart home integration becomes more widespread, the residential segment is poised to continue its dominance in the Touch Screen Display Market, offering seamless connectivity and control.

The commercial segment is poised to be the fastest-growing sector in the Touch Screen Display Market from 2024 to 2032, driven by increasing demand for interactive technology in retail, hospitality, and corporate environments. Businesses are adopting touch screen displays for point-of-sale (POS) systems, digital signage, customer engagement, and collaborative workspaces. These displays enhance user interaction, streamline operations, and improve customer experiences. In retail, digital signage and self-service kiosks are transforming the shopping experience, while in corporate settings, touchscreens are enhancing productivity in meetings and presentations. As the need for efficient and interactive solutions grows, the commercial segment is expected to witness rapid expansion during the forecast period.

Touch Screen Display Market Regional Outlook

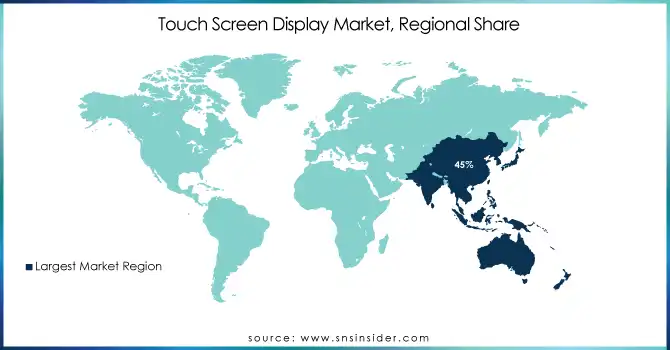
In 2023, the Asia-Pacific region dominates the Touch Screen Display Market, accounting for around 45% of the global share. This dominance is driven by rapid technological advancements, high manufacturing capabilities, and the increasing demand for touch-enabled devices across various industries such as retail, education, automotive, and healthcare. Countries like China, Japan, South Korea, and India play pivotal roles in this growth. China’s position as a manufacturing hub for consumer electronics and displays has significantly contributed to market expansion. Additionally, India’s growing adoption of smart technologies, coupled with South Korea and Japan’s advancements in interactive displays for smart retail and digital signage, is further propelling the region's market dominance. The increasing demand for smartphones, tablets, and industrial automation technologies in these countries also supports the region’s leadership in The Touch Screen Display Market. As Asia-Pacific continues to embrace innovation in consumer electronics and industrial applications, it is expected to retain its dominant position in the market through 2032.

North America is poised to be the fastest-growing region in the touch screen display market over the forecast period from 2024 to 2032. This growth is driven by the increasing adoption of interactive displays across diverse sectors, including retail, healthcare, and education. The U.S. and Canada are key contributors, with significant investments in technological advancements and infrastructure. The region’s high demand for advanced consumer electronics, coupled with the growing trend of smart home devices and digital signage, is boosting the market. Additionally, the rise of AI-driven touch solutions and innovation in automotive displays is further accelerating growth in North America.

Touch-Screen-Display-Market-Regional-Share

Get Customized Report as per your Business Requirement - Request For Customized Report

Key Players

Some of the major key players in Touch Screen Display market along with their product

  • BOE Technology Group Co., Ltd. (LCD, OLED, and Touch Screen Displays)

  • Innolux Corporation (LCD Panels, Touch Screens)

  • AU Optronics Corp. (LCD Panels, Touch Screens, OLED Displays)

  • Panasonic Holdings Corporation (LCD, OLED Displays, Touch Screens)

  • Samsung Corporation (OLED Displays, Touch Screens, LCD Panels)

  • Corning Incorporated (Glass, Touch Screen Panels, Optical Materials)

  • Mouser Electronics, Inc. (Electronic Components, Touch Screen Modules)

  • FUJITSU (Touch Screen Displays, Industrial Displays)

  • NEC Corporation (LCD Displays, Touch Screens, Digital Signage)

  • DISPLAX (Touch Foils, Interactive Touch Displays)

  • Sharp Corporation (LCD, OLED Displays, Touch Panels)

  • LG Display (OLED, LCD, and Touch Screen Panels)

  • Japan Display Inc. (LCD Panels, Touch Screens)

  • ELO Touch Solutions (Interactive Touch Screens, Digital Signage)

  • TruTouch Technologies (Touch Screens, Interactive Display Solutions)

List of raw material suppliers and potential customers for the Touch Screen Display Market without mentioning specific products:

Raw Material Suppliers:

  • Corning Incorporated

  • 3M Company

  • DuPont

  • Nitto Denko Corporation

  • Samsung SDI

  • LG Chem

  • Hanwa Total

  • Schott AG

  • BOE Technology Group Co., Ltd.

  • Sharp Corporation

Potential Customers:

  • Apple Inc.

  • Samsung Electronics

  • Microsoft

  • Sony Corporation

  • HP Inc.

  • Dell Technologies

  • Lenovo

  • Tesla Inc.

  • Panasonic Corporation

  • Google LLC

Recent Development

  • On September 2024, BOE Technology Group Co. Ltd. announced on September 5, 2024, that it will invest 63 billion yuan to establish a new AMOLED production line in Chengdu. This investment aims to enhance its production of high-end touch screens for mid-sized laptops and tablets, strengthening its presence in the growing OLED market.

  • On December 2024, Panasonic launched its new Balanced Home Elite and Elite Plus Series of Energy Recovery Ventilators (ERV) offering enhanced efficiency and versatility for single-family homes. The series, featuring models with varying CFM levels and mounting options, integrates Smart Flow  technology and meets major building codes, providing professionals with customizable solutions for improving indoor air quality.

Touch Screen Display Market Report Scope:

Report Attributes Details
Market Size in 2023 USD 76.36 Billion
Market Size by 2032 USD 194.44 Billion
CAGR CAGR of 10.95% From 2024 to 2032
Base Year 2023
Forecast Period 2024-2032
Historical Data 2020-2022
Report Scope & Coverage Market Size, Segments Analysis, Competitive  Landscape, Regional Analysis, DROC & SWOT Analysis, Forecast Outlook
Key Segments • By Screen Type (Capacitive, Resistive, Optical, Infrared, Others)
• By Application (Display Signage, Kiosks, Consumer Electronics)
• By End User (Residential, Commercial, Industrial)
Regional Analysis/Coverage North America (US, Canada, Mexico), Europe (Eastern Europe [Poland, Romania, Hungary, Turkey, Rest of Eastern Europe] Western Europe] Germany, France, UK, Italy, Spain, Netherlands, Switzerland, Austria, Rest of Western Europe]), Asia Pacific (China, India, Japan, South Korea, Vietnam, Singapore, Australia, Rest of Asia Pacific), Middle East & Africa (Middle East [UAE, Egypt, Saudi Arabia, Qatar, Rest of Middle East], Africa [Nigeria, South Africa, Rest of Africa], Latin America (Brazil, Argentina, Colombia, Rest of Latin America)
Company Profiles BOE Technology Group Co., Ltd., Innolux Corporation, AU Optronics Corp., Panasonic Holdings Corporation, Samsung Corporation, Corning Incorporated, Mouser Electronics, Inc., FUJITSU, NEC Corporation, DISPLAX, Sharp Corporation, LG Display, Japan Display Inc., ELO Touch Solutions, TruTouch Technologies.
Key Drivers • The growing demand for interactive displays is significantly driving the market, particularly in education, corporate offices, and public spaces.
Restraints • A key challenge hindering the growth of the interactive display market is the compatibility with existing technology infrastructure, particularly in corporate, educational, and industrial sectors.

Frequently Asked Questions

Ans: The Touch Screen Display Market is expected to grow at a CAGR of 10.95%.

Ans: Touch Screen Display Market size was USD 76.36 billion in 2023 and is expected to Reach USD 194.44 billion by 2032.

Ans: Limited Screen Size for Certain Applications

Ans: Asia-Pacific is the dominating region in the Touch Screen Display Market.

Table of Content

1. Introduction

1.1 Market Definition

1.2 Scope (Inclusion and Exclusions)

1.3 Research Assumptions

2. Executive Summary

2.1 Market Overview

2.2 Regional Synopsis

2.3 Competitive Summary

3. Research Methodology

3.1 Top-Down Approach

3.2 Bottom-up Approach

3.3. Data Validation

3.4 Primary Interviews

4. Market Dynamics Impact Analysis

4.1 Market Driving Factors Analysis

4.1.1 Drivers

4.1.2 Restraints

4.2 PESTLE Analysis

4.3 Porter’s Five Forces Model

5. Statistical Insights and Trends Reporting

5.1 Consumer Spending on Touch Screen Devices

5.2 Failure Rates and Reliability Metrics

5.3 Technological Trends in Screen Resolution and Size

5.4 Maintenance and Service Data

6. Competitive Landscape

6.1 List of Major Companies, By Region

6.2 Market Share Analysis, By Region

6.3 Product Benchmarking

6.3.1 Product specifications and features

6.3.2 Pricing

6.4 Strategic Initiatives

6.4.1 Marketing and promotional activities

6.4.2 Distribution and supply chain strategies

6.4.3 Expansion plans and new product launches

6.4.4 Strategic partnerships and collaborations

6.5 Technological Advancements

6.6 Market Positioning and Branding

7. Touch Screen Display Market Segmentation, by Screen Type

7.1 Chapter Overview

7.2 Capacitive Touch Screens

7.2.1 Capacitive Touch Screens Market Trends Analysis (2020-2032)

7.2.2 Capacitive Touch Screens Market Size Estimates and Forecasts to 2032 (USD Billion)

7.3 Resistive Touch Screens

7.3.1 Resistive Touch Screens Market Trends Analysis (2020-2032)

7.3.2 Resistive Touch Screens Market Size Estimates and Forecasts to 2032 (USD Billion)

7.4 Optical

7.4.1 Optical Market Trends Analysis (2020-2032)

7.4.2 Optical Market Size Estimates and Forecasts to 2032 (USD Billion)

7.5 Infrared Touch Screens

7.5.1 Infrared Touch Screens Market Trends Analysis (2020-2032)

7.5.2 Infrared Touch Screens Market Size Estimates and Forecasts to 2032 (USD Billion)

7.6 Others (Surface Acoustic Wave Type Displays)

7.5.1 Others (Surface Acoustic Wave Type Displays) Market Trends Analysis (2020-2032)

7.5.2 Others (Surface Acoustic Wave Type Displays) Market Size Estimates and Forecasts to 2032 (USD Billion)

8. Touch Screen Display Market Segmentation, by Application

8.1 Chapter Overview

8.2 Display/Digital Signage

8.2.1 Display/Digital Signage Market Trends Analysis (2020-2032)

8.2.2 Display/Digital Signage Market Size Estimates and Forecasts to 2032 (USD Billion)

8.3 Kiosks

8.3.1 Kiosks Market Trends Analysis (2020-2032)

8.3.2 Kiosks Market Size Estimates and Forecasts to 2032 (USD Billion)

8.4 Consumer Electronics

8.4.1 Consumer Electronics Market Trends Analysis (2020-2032)

8.4.2 Consumer Electronics Market Size Estimates and Forecasts to 2032 (USD Billion)

8.4.3 Laptops & Tablets and Smart Television

8.4.3.1 Laptops & Tablets and Smart Television Market Trends Analysis (2020-2032)

8.4.3.2 Laptops & Tablets and Smart Television Market Size Estimates and Forecasts to 2032 (USD Billion)

8.4.4 Smartphones & Smart Wearables

8.4.4.1 Smartphones & Smart Wearables Market Trends Analysis (2020-2032)

8.4.4.2 Smartphones & Smart Wearables Market Size Estimates and Forecasts to 2032 (USD Billion)

9. Touch Screen Display Market Segmentation, by End User

9.1 Chapter Overview

9.2 Residential

9.2.1 Residential Market Trends Analysis (2020-2032)

9.2.2 Residential Market Size Estimates and Forecasts to 2032 (USD Billion)

9.3 Commercial

9.3.1 Commercial Market Trends Analysis (2020-2032)

9.3.2 Commercial Market Size Estimates and Forecasts to 2032 (USD Billion)

9.4 Industrial

9.4.1 Industrial Market Trends Analysis (2020-2032)

9.4.2 Industrial Market Size Estimates and Forecasts to 2032 (USD Billion)

10. Regional Analysis

10.1 Chapter Overview

10.2 North America

10.2.1 Trends Analysis

10.2.2 North America Touch Screen Display Market Estimates and Forecasts, by Country (2020-2032) (USD Billion)

10.2.3 North America Touch Screen Display Market Estimates and Forecasts, by Screen Type (2020-2032) (USD Billion) 

10.2.4 North America Touch Screen Display Market Estimates and Forecasts, by Application (2020-2032) (USD Billion)

10.2.5 North America Touch Screen Display Market Estimates and Forecasts, by End User (2020-2032) (USD Billion)

10.2.6 USA

10.2.6.1 USA Touch Screen Display Market Estimates and Forecasts, by Screen Type (2020-2032) (USD Billion)

10.2.6.2 USA Touch Screen Display Market Estimates and Forecasts, by Application (2020-2032) (USD Billion)

10.2.6.3 USA Touch Screen Display Market Estimates and Forecasts, by End User (2020-2032) (USD Billion)

10.2.7 Canada

10.2.7.1 Canada Touch Screen Display Market Estimates and Forecasts, by Screen Type (2020-2032) (USD Billion)

10.2.7.2 Canada Touch Screen Display Market Estimates and Forecasts, by Application (2020-2032) (USD Billion)

10.2.7.3 Canada Touch Screen Display Market Estimates and Forecasts, by End User (2020-2032) (USD Billion)

10.2.8 Mexico

10.2.8.1 Mexico Touch Screen Display Market Estimates and Forecasts, by Screen Type (2020-2032) (USD Billion)

10.2.8.2 Mexico Touch Screen Display Market Estimates and Forecasts, by Application (2020-2032) (USD Billion)

10.2.8.3 Mexico Touch Screen Display Market Estimates and Forecasts, by End User (2020-2032) (USD Billion)

10.3 Europe

10.3.1 Eastern Europe

10.3.1.1 Trends Analysis

10.3.1.2 Eastern Europe Touch Screen Display Market Estimates and Forecasts, by Country (2020-2032) (USD Billion)

10.3.1.3 Eastern Europe Touch Screen Display Market Estimates and Forecasts, by Screen Type (2020-2032) (USD Billion) 

10.3.1.4 Eastern Europe Touch Screen Display Market Estimates and Forecasts, by Application (2020-2032) (USD Billion)

10.3.1.5 Eastern Europe Touch Screen Display Market Estimates and Forecasts, by End User (2020-2032) (USD Billion)

10.3.1.6 Poland

10.3.1.6.1 Poland Touch Screen Display Market Estimates and Forecasts, by Screen Type (2020-2032) (USD Billion)

10.3.1.6.2 Poland Touch Screen Display Market Estimates and Forecasts, by Application (2020-2032) (USD Billion)

10.3.1.6.3 Poland Touch Screen Display Market Estimates and Forecasts, by End User (2020-2032) (USD Billion)

10.3.1.7 Romania

10.3.1.7.1 Romania Touch Screen Display Market Estimates and Forecasts, by Screen Type (2020-2032) (USD Billion)

10.3.1.7.2 Romania Touch Screen Display Market Estimates and Forecasts, by Application (2020-2032) (USD Billion)

10.3.1.7.3 Romania Touch Screen Display Market Estimates and Forecasts, by End User (2020-2032) (USD Billion)

10.3.1.8 Hungary

10.3.1.8.1 Hungary Touch Screen Display Market Estimates and Forecasts, by Screen Type (2020-2032) (USD Billion)

10.3.1.8.2 Hungary Touch Screen Display Market Estimates and Forecasts, by Application (2020-2032) (USD Billion)

10.3.1.8.3 Hungary Touch Screen Display Market Estimates and Forecasts, by End User (2020-2032) (USD Billion)

10.3.1.9 Turkey

10.3.1.9.1 Turkey Touch Screen Display Market Estimates and Forecasts, by Screen Type (2020-2032) (USD Billion)

10.3.1.9.2 Turkey Touch Screen Display Market Estimates and Forecasts, by Application (2020-2032) (USD Billion)

10.3.1.9.3 Turkey Touch Screen Display Market Estimates and Forecasts, by End User (2020-2032) (USD Billion)

10.3.1.10 Rest of Eastern Europe

10.3.1.10.1 Rest of Eastern Europe Touch Screen Display Market Estimates and Forecasts, by Screen Type (2020-2032) (USD Billion)

10.3.1.10.2 Rest of Eastern Europe Touch Screen Display Market Estimates and Forecasts, by Application (2020-2032) (USD Billion)

10.3.1.10.3 Rest of Eastern Europe Touch Screen Display Market Estimates and Forecasts, by End User (2020-2032) (USD Billion)

10.3.2 Western Europe

10.3.2.1 Trends Analysis

10.3.2.2 Western Europe Touch Screen Display Market Estimates and Forecasts, by Country (2020-2032) (USD Billion)

10.3.2.3 Western Europe Touch Screen Display Market Estimates and Forecasts, by Screen Type (2020-2032) (USD Billion) 

10.3.2.4 Western Europe Touch Screen Display Market Estimates and Forecasts, by Application (2020-2032) (USD Billion)

10.3.2.5 Western Europe Touch Screen Display Market Estimates and Forecasts, by End User (2020-2032) (USD Billion)

10.3.2.6 Germany

10.3.2.6.1 Germany Touch Screen Display Market Estimates and Forecasts, by Screen Type (2020-2032) (USD Billion)

10.3.2.6.2 Germany Touch Screen Display Market Estimates and Forecasts, by Application (2020-2032) (USD Billion)

10.3.2.6.3 Germany Touch Screen Display Market Estimates and Forecasts, by End User (2020-2032) (USD Billion)

10.3.2.7 France

10.3.2.7.1 France Touch Screen Display Market Estimates and Forecasts, by Screen Type (2020-2032) (USD Billion)

10.3.2.7.2 France Touch Screen Display Market Estimates and Forecasts, by Application (2020-2032) (USD Billion)

10.3.2.7.3 France Touch Screen Display Market Estimates and Forecasts, by End User (2020-2032) (USD Billion)

10.3.2.8 UK

10.3.2.8.1 UK Touch Screen Display Market Estimates and Forecasts, by Screen Type (2020-2032) (USD Billion)

10.3.2.8.2 UK Touch Screen Display Market Estimates and Forecasts, by Application (2020-2032) (USD Billion)

10.3.2.8.3 UK Touch Screen Display Market Estimates and Forecasts, by End User (2020-2032) (USD Billion)

10.3.2.9 Italy

10.3.2.9.1 Italy Touch Screen Display Market Estimates and Forecasts, by Screen Type (2020-2032) (USD Billion)

10.3.2.9.2 Italy Touch Screen Display Market Estimates and Forecasts, by Application (2020-2032) (USD Billion)

10.3.2.9.3 Italy Touch Screen Display Market Estimates and Forecasts, by End User (2020-2032) (USD Billion)

10.3.2.10 Spain

10.3.2.10.1 Spain Touch Screen Display Market Estimates and Forecasts, by Screen Type (2020-2032) (USD Billion)

10.3.2.10.2 Spain Touch Screen Display Market Estimates and Forecasts, by Application (2020-2032) (USD Billion)

10.3.2.10.3 Spain Touch Screen Display Market Estimates and Forecasts, by End User (2020-2032) (USD Billion)

10.3.2.11 Netherlands

10.3.2.11.1 Netherlands Touch Screen Display Market Estimates and Forecasts, by Screen Type (2020-2032) (USD Billion)

10.3.2.11.2 Netherlands Touch Screen Display Market Estimates and Forecasts, by Application (2020-2032) (USD Billion)

10.3.2.11.3 Netherlands Touch Screen Display Market Estimates and Forecasts, by End User (2020-2032) (USD Billion)

10.3.2.12 Switzerland

10.3.2.12.1 Switzerland Touch Screen Display Market Estimates and Forecasts, by Screen Type (2020-2032) (USD Billion)

10.3.2.12.2 Switzerland Touch Screen Display Market Estimates and Forecasts, by Application (2020-2032) (USD Billion)

10.3.2.12.3 Switzerland Touch Screen Display Market Estimates and Forecasts, by End User (2020-2032) (USD Billion)

10.3.2.13 Austria

10.3.2.13.1 Austria Touch Screen Display Market Estimates and Forecasts, by Screen Type (2020-2032) (USD Billion)

10.3.2.13.2 Austria Touch Screen Display Market Estimates and Forecasts, by Application (2020-2032) (USD Billion)

10.3.2.13.3 Austria Touch Screen Display Market Estimates and Forecasts, by End User (2020-2032) (USD Billion)

10.3.2.14 Rest of Western Europe

10.3.2.14.1 Rest of Western Europe Touch Screen Display Market Estimates and Forecasts, by Screen Type (2020-2032) (USD Billion)

10.3.2.14.2 Rest of Western Europe Touch Screen Display Market Estimates and Forecasts, by Application (2020-2032) (USD Billion)

10.3.2.14.3 Rest of Western Europe Touch Screen Display Market Estimates and Forecasts, by End User (2020-2032) (USD Billion)

10.4 Asia Pacific

10.4.1 Trends Analysis

10.4.2 Asia Pacific Touch Screen Display Market Estimates and Forecasts, by Country (2020-2032) (USD Billion)

10.4.3 Asia Pacific Touch Screen Display Market Estimates and Forecasts, by Screen Type (2020-2032) (USD Billion) 

10.4.4 Asia Pacific Touch Screen Display Market Estimates and Forecasts, by Application (2020-2032) (USD Billion)

10.4.5 Asia Pacific Touch Screen Display Market Estimates and Forecasts, by End User (2020-2032) (USD Billion)

10.4.6 China

10.4.6.1 China Touch Screen Display Market Estimates and Forecasts, by Screen Type (2020-2032) (USD Billion)

10.4.6.2 China Touch Screen Display Market Estimates and Forecasts, by Application (2020-2032) (USD Billion)

10.4.6.3 China Touch Screen Display Market Estimates and Forecasts, by End User (2020-2032) (USD Billion)

10.4.7 India

10.4.7.1 India Touch Screen Display Market Estimates and Forecasts, by Screen Type (2020-2032) (USD Billion)

10.4.7.2 India Touch Screen Display Market Estimates and Forecasts, by Application (2020-2032) (USD Billion)

10.4.7.3 India Touch Screen Display Market Estimates and Forecasts, by End User (2020-2032) (USD Billion)

10.4.8 Japan

10.4.8.1 Japan Touch Screen Display Market Estimates and Forecasts, by Screen Type (2020-2032) (USD Billion)

10.4.8.2 Japan Touch Screen Display Market Estimates and Forecasts, by Application (2020-2032) (USD Billion)

10.4.8.3 Japan Touch Screen Display Market Estimates and Forecasts, by End User (2020-2032) (USD Billion)

10.4.9 South Korea

10.4.9.1 South Korea Touch Screen Display Market Estimates and Forecasts, by Screen Type (2020-2032) (USD Billion)

10.4.9.2 South Korea Touch Screen Display Market Estimates and Forecasts, by Application (2020-2032) (USD Billion)

10.4.9.3 South Korea Touch Screen Display Market Estimates and Forecasts, by End User (2020-2032) (USD Billion)

10.4.10 Vietnam

10.4.10.1 Vietnam Touch Screen Display Market Estimates and Forecasts, by Screen Type (2020-2032) (USD Billion)

10.4.10.2 Vietnam Touch Screen Display Market Estimates and Forecasts, by Application (2020-2032) (USD Billion)

10.4.10.3 Vietnam Touch Screen Display Market Estimates and Forecasts, by End User (2020-2032) (USD Billion)

10.4.11 Singapore

10.4.11.1 Singapore Touch Screen Display Market Estimates and Forecasts, by Screen Type (2020-2032) (USD Billion)

10.4.11.2 Singapore Touch Screen Display Market Estimates and Forecasts, by Application (2020-2032) (USD Billion)

10.4.11.3 Singapore Touch Screen Display Market Estimates and Forecasts, by End User (2020-2032) (USD Billion)

10.4.12 Australia

10.4.12.1 Australia Touch Screen Display Market Estimates and Forecasts, by Screen Type (2020-2032) (USD Billion)

10.4.12.2 Australia Touch Screen Display Market Estimates and Forecasts, by Application (2020-2032) (USD Billion)

10.4.12.3 Australia Touch Screen Display Market Estimates and Forecasts, by End User (2020-2032) (USD Billion)

10.4.13 Rest of Asia Pacific

10.4.13.1 Rest of Asia Pacific Touch Screen Display Market Estimates and Forecasts, by Screen Type (2020-2032) (USD Billion)

10.4.13.2 Rest of Asia Pacific Touch Screen Display Market Estimates and Forecasts, by Application (2020-2032) (USD Billion)

10.4.13.3 Rest of Asia Pacific Touch Screen Display Market Estimates and Forecasts, by End User (2020-2032) (USD Billion)

10.5 Middle East and Africa

10.5.1 Middle East

10.5.1.1 Trends Analysis

10.5.1.2 Middle East Touch Screen Display Market Estimates and Forecasts, by Country (2020-2032) (USD Billion)

10.5.1.3 Middle East Touch Screen Display Market Estimates and Forecasts, by Screen Type (2020-2032) (USD Billion) 

10.5.1.4 Middle East Touch Screen Display Market Estimates and Forecasts, by Application (2020-2032) (USD Billion)

10.5.1.5 Middle East Touch Screen Display Market Estimates and Forecasts, by End User (2020-2032) (USD Billion)

10.5.1.6 UAE

10.5.1.6.1 UAE Touch Screen Display Market Estimates and Forecasts, by Screen Type (2020-2032) (USD Billion)

10.5.1.6.2 UAE Touch Screen Display Market Estimates and Forecasts, by Application (2020-2032) (USD Billion)

10.5.1.6.3 UAE Touch Screen Display Market Estimates and Forecasts, by End User (2020-2032) (USD Billion)

10.5.1.7 Egypt

10.5.1.7.1 Egypt Touch Screen Display Market Estimates and Forecasts, by Screen Type (2020-2032) (USD Billion)

10.5.1.7.2 Egypt Touch Screen Display Market Estimates and Forecasts, by Application (2020-2032) (USD Billion)

10.5.1.7.3 Egypt Touch Screen Display Market Estimates and Forecasts, by End User (2020-2032) (USD Billion)

10.5.1.8 Saudi Arabia

10.5.1.8.1 Saudi Arabia Touch Screen Display Market Estimates and Forecasts, by Screen Type (2020-2032) (USD Billion)

10.5.1.8.2 Saudi Arabia Touch Screen Display Market Estimates and Forecasts, by Application (2020-2032) (USD Billion)

10.5.1.8.3 Saudi Arabia Touch Screen Display Market Estimates and Forecasts, by End User (2020-2032) (USD Billion)

10.5.1.9 Qatar

10.5.1.9.1 Qatar Touch Screen Display Market Estimates and Forecasts, by Screen Type (2020-2032) (USD Billion)

10.5.1.9.2 Qatar Touch Screen Display Market Estimates and Forecasts, by Application (2020-2032) (USD Billion)

10.5.1.9.3 Qatar Touch Screen Display Market Estimates and Forecasts, by End User (2020-2032) (USD Billion)

10.5.1.10 Rest of Middle East

10.5.1.10.1 Rest of Middle East Touch Screen Display Market Estimates and Forecasts, by Screen Type (2020-2032) (USD Billion)

10.5.1.10.2 Rest of Middle East Touch Screen Display Market Estimates and Forecasts, by Application (2020-2032) (USD Billion)

10.5.1.10.3 Rest of Middle East Touch Screen Display Market Estimates and Forecasts, by End User (2020-2032) (USD Billion)

10.5.2 Africa

10.5.2.1 Trends Analysis

10.5.2.2 Africa Touch Screen Display Market Estimates and Forecasts, by Country (2020-2032) (USD Billion)

10.5.2.3 Africa Touch Screen Display Market Estimates and Forecasts, by Screen Type (2020-2032) (USD Billion) 

10.5.2.4 Africa Touch Screen Display Market Estimates and Forecasts, by Application (2020-2032) (USD Billion)

10.5.2.5 Africa Touch Screen Display Market Estimates and Forecasts, by End User (2020-2032) (USD Billion)

10.5.2.6 South Africa

10.5.2.6.1 South Africa Touch Screen Display Market Estimates and Forecasts, by Screen Type (2020-2032) (USD Billion)

10.5.2.6.2 South Africa Touch Screen Display Market Estimates and Forecasts, by Application (2020-2032) (USD Billion)

10.5.2.6.3 South Africa Touch Screen Display Market Estimates and Forecasts, by End User (2020-2032) (USD Billion)

10.5.2.7 Nigeria

10.5.2.7.1 Nigeria Touch Screen Display Market Estimates and Forecasts, by Screen Type (2020-2032) (USD Billion)

10.5.2.7.2 Nigeria Touch Screen Display Market Estimates and Forecasts, by Application (2020-2032) (USD Billion)

10.5.2.7.3 Nigeria Touch Screen Display Market Estimates and Forecasts, by End User (2020-2032) (USD Billion)

10.5.2.8 Rest of Africa

10.5.2.8.1 Rest of Africa Touch Screen Display Market Estimates and Forecasts, by Screen Type (2020-2032) (USD Billion)

10.5.2.8.2 Rest of Africa Touch Screen Display Market Estimates and Forecasts, by Application (2020-2032) (USD Billion)

10.5.2.8.3 Rest of Africa Touch Screen Display Market Estimates and Forecasts, by End User (2020-2032) (USD Billion)

10.6 Latin America

10.6.1 Trends Analysis

10.6.2 Latin America Touch Screen Display Market Estimates and Forecasts, by Country (2020-2032) (USD Billion)

10.6.3 Latin America Touch Screen Display Market Estimates and Forecasts, by Screen Type (2020-2032) (USD Billion) 

10.6.4 Latin America Touch Screen Display Market Estimates and Forecasts, by Application (2020-2032) (USD Billion)

10.6.5 Latin America Touch Screen Display Market Estimates and Forecasts, by End User (2020-2032) (USD Billion)

10.6.6 Brazil

10.6.6.1 Brazil Touch Screen Display Market Estimates and Forecasts, by Screen Type (2020-2032) (USD Billion)

10.6.6.2 Brazil Touch Screen Display Market Estimates and Forecasts, by Application (2020-2032) (USD Billion)

10.6.6.3 Brazil Touch Screen Display Market Estimates and Forecasts, by End User (2020-2032) (USD Billion)

10.6.7 Argentina

10.6.7.1 Argentina Touch Screen Display Market Estimates and Forecasts, by Screen Type (2020-2032) (USD Billion)

10.6.7.2 Argentina Touch Screen Display Market Estimates and Forecasts, by Application (2020-2032) (USD Billion)

10.6.7.3 Argentina Touch Screen Display Market Estimates and Forecasts, by End User (2020-2032) (USD Billion)

10.6.8 Colombia

10.6.8.1 Colombia Touch Screen Display Market Estimates and Forecasts, by Screen Type (2020-2032) (USD Billion)

10.6.8.2 Colombia Touch Screen Display Market Estimates and Forecasts, by Application (2020-2032) (USD Billion)

10.6.8.3 Colombia Touch Screen Display Market Estimates and Forecasts, by End User (2020-2032) (USD Billion)

10.6.9 Rest of Latin America

10.6.9.1 Rest of Latin America Touch Screen Display Market Estimates and Forecasts, by Screen Type (2020-2032) (USD Billion)

10.6.9.2 Rest of Latin America Touch Screen Display Market Estimates and Forecasts, by Application (2020-2032) (USD Billion)

10.6.9.3 Rest of Latin America Touch Screen Display Market Estimates and Forecasts, by End User (2020-2032) (USD Billion)

11. Company Profiles

11.1 BOE Technology Group Co., Ltd.

11.1.1 Company Overview

11.1.2 Financial

11.1.3 Products/ Services Offered

11.1.4 SWOT Analysis

11.2 Innolux Corporation

11.2.1 Company Overview

11.2.2 Financial

11.2.3 Products/ Services Offered

11.2.4 SWOT Analysis

11.3 AU Optronics Corp.

11.3.1 Company Overview

11.3.2 Financial

11.3.3 Products/ Services Offered

11.3.4 SWOT Analysis

11.4 Panasonic Holdings Corporation

11.4.1 Company Overview

11.4.2 Financial

11.4.3 Products/ Services Offered

11.4.4 SWOT Analysis

11.5 Samsung Corporation

11.5.1 Company Overview

11.5.2 Financial

11.5.3 Products/ Services Offered

11.5.4 SWOT Analysis

11.6 Corning Incorporated

11.6.1 Company Overview

11.6.2 Financial

11.6.3 Products/ Services Offered

11.6.4 SWOT Analysis

11.7 Mouser Electronics, Inc.

11.7.1 Company Overview

11.7.2 Financial

11.7.3 Products/ Services Offered

11.7.4 SWOT Analysis

11.8 FUJITSU

11.8.1 Company Overview

11.8.2 Financial

11.8.3 Products/ Services Offered

11.8.4 SWOT Analysis

11.9 NEC Corporation

11.9.1 Company Overview

11.9.2 Financial

11.9.3 Products/ Services Offered

11.9.4 SWOT Analysis

11.10 DISPLAX

11.10.1 Company Overview

11.10.2 Financial

11.10.3 Products/ Services Offered

11.10.4 SWOT Analysis

12. Use Cases and Best Practices

13. Conclusion

An accurate research report requires proper strategizing as well as implementation. There are multiple factors involved in the completion of good and accurate research report and selecting the best methodology to compete the research is the toughest part. Since the research reports we provide play a crucial role in any company’s decision-making process, therefore we at SNS Insider always believe that we should choose the best method which gives us results closer to reality. This allows us to reach at a stage wherein we can provide our clients best and accurate investment to output ratio.

Each report that we prepare takes a timeframe of 350-400 business hours for production. Starting from the selection of titles through a couple of in-depth brain storming session to the final QC process before uploading our titles on our website we dedicate around 350 working hours. The titles are selected based on their current market cap and the foreseen CAGR and growth.


The 5 steps process:

Step 1: Secondary Research:

Secondary Research or Desk Research is as the name suggests is a research process wherein, we collect data through the readily available information. In this process we use various paid and unpaid databases which our team has access to and gather data through the same. This includes examining of listed companies’ annual reports, Journals, SEC filling etc. Apart from this our team has access to various associations across the globe across different industries. Lastly, we have exchange relationships with various university as well as individual libraries.

Secondary Research

Step 2: Primary Research

When we talk about primary research, it is a type of study in which the researchers collect relevant data samples directly, rather than relying on previously collected data.  This type of research is focused on gaining content specific facts that can be sued to solve specific problems. Since the collected data is fresh and first hand therefore it makes the study more accurate and genuine.

We at SNS Insider have divided Primary Research into 2 parts.

Part 1 wherein we interview the KOLs of major players as well as the upcoming ones across various geographic regions. This allows us to have their view over the market scenario and acts as an important tool to come closer to the accurate market numbers. As many as 45 paid and unpaid primary interviews are taken from both the demand and supply side of the industry to make sure we land at an accurate judgement and analysis of the market.

This step involves the triangulation of data wherein our team analyses the interview transcripts, online survey responses and observation of on filed participants. The below mentioned chart should give a better understanding of the part 1 of the primary interview.

Primary Research

Part 2: In this part of primary research the data collected via secondary research and the part 1 of the primary research is validated with the interviews from individual consultants and subject matter experts.

Consultants are those set of people who have at least 12 years of experience and expertise within the industry whereas Subject Matter Experts are those with at least 15 years of experience behind their back within the same space. The data with the help of two main processes i.e., FGDs (Focused Group Discussions) and IDs (Individual Discussions). This gives us a 3rd party nonbiased primary view of the market scenario making it a more dependable one while collation of the data pointers.

Step 3: Data Bank Validation

Once all the information is collected via primary and secondary sources, we run that information for data validation. At our intelligence centre our research heads track a lot of information related to the market which includes the quarterly reports, the daily stock prices, and other relevant information. Our data bank server gets updated every fortnight and that is how the information which we collected using our primary and secondary information is revalidated in real time.

Data Bank Validation

Step 4: QA/QC Process

After all the data collection and validation our team does a final level of quality check and quality assurance to get rid of any unwanted or undesired mistakes. This might include but not limited to getting rid of the any typos, duplication of numbers or missing of any important information. The people involved in this process include technical content writers, research heads and graphics people. Once this process is completed the title gets uploader on our platform for our clients to read it.

Step 5: Final QC/QA Process:

This is the last process and comes when the client has ordered the study. In this process a final QA/QC is done before the study is emailed to the client. Since we believe in giving our clients a good experience of our research studies, therefore, to make sure that we do not lack at our end in any way humanly possible we do a final round of quality check and then dispatch the study to the client.

Key Market Segments:

By Screen Type

  • Capacitive Touch Screens

  • Resistive Touch Screens

  • Optical

  • Infrared Touch Screens

  • Others (Surface Acoustic Wave Type Displays)

By Application

  • Display/Digital Signage

  • Kiosks

  • Consumer Electronics

    • Laptops & Tablets and Smart Television

    • Smartphones & Smart Wearables

By End User

  • Residential

  • Commercial

  • Industrial

Request for Segment Customization as per your Business Requirement: Segment Customization Request

REGIONAL COVERAGE:

North America

  • US

  • Canada

  • Mexico

Europe

  • Eastern Europe

    • Poland

    • Romania

    • Hungary

    • Turkey

    • Rest of Eastern Europe

  • Western Europe

    • Germany

    • France

    • UK

    • Italy

    • Spain

    • Netherlands

    • Switzerland

    • Austria

    • Rest of Western Europe

Asia-Pacific

  • China

  • India

  • Japan

  • South Korea

  • Vietnam

  • Singapore

  • Australia

  • Rest of Asia Pacific

Middle East & Africa

  • Middle East

    • UAE

    • Egypt

    • Saudi Arabia

    • Qatar

    • Rest of the Middle East

  • Africa

    • Nigeria

    • South Africa

    • Rest of Africa

Latin America

  • Brazil

  • Argentina

  • Colombia

  • Rest of Latin America

Request for Country Level Research Report: Country Level Customization Request

Available Customization

With the given market data, SNS Insider offers customization as per the company’s specific needs. The following customization options are available for the report:

  • Product Analysis

  • Criss-Cross segment analysis (e.g. Product X Application)

  • Product Matrix which gives a detailed comparison of the product portfolio of each company

  • Geographic Analysis

  • Additional countries in any of the regions

  • Company Information

  • Detailed analysis and profiling of additional market players (Up to five)


  •            5000 (33% Discount)


  •            8950 (40% Discount)


  •            3050 (23% Discount)

Start a Conversation

Hi! Click one of our member below to chat on Phone