Toluene Market Key Insights:
Get more information on Toluene Market - Request Sample Report
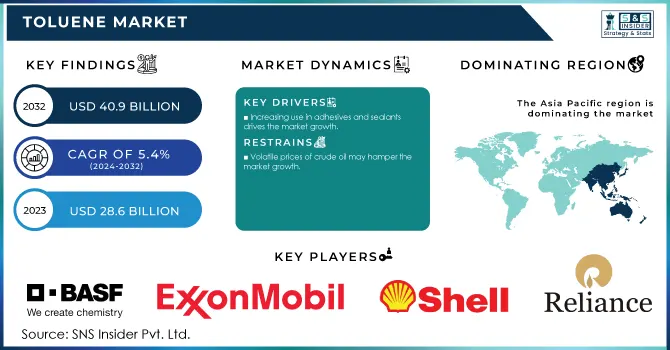
The Toluene Market Size was valued at USD 28.6 Billion in 2023. It is expected to grow to USD 40.9 Billion by 2032 and grow at a CAGR of 5.4% over the forecast period of 2024-2032.
The growing paints and coatings industry is a major driving force behind the toluene market, as it serves as one of the most effective solvents owing to its high solvency power and fast evaporation rate. It is ideal for coating because of its ability to dissolve resins and pigments, enhancing paint fluidity and drying times. The expansion of construction, due to urbanization & infrastructure development as well as the increasing automotive production has bolstered the demand for high-quality paints and coatings worldwide. This increase in demand contributes to the positive outlook for the toluene market, as the solvent is still critical in creating long-lasting and efficient coatings.
According to the European Coatings Federation, the European paints and coatings market grew by 4% in 2022, driven by rising construction and automotive activities. Similar growth trends were observed in Asia-Pacific, led by China and India, according to the India Brand Equity Foundation, which noted a 12.7% rise in the Indian paints industry in 2022.
Toluene is widely used as an octane booster in gasoline and the increasing demand for gasoline blending is a key factor supporting the growth of the global toluene market. Toluene with its high-octane number also increases fuel economy and engine performance by minimizing knocking, as well as permitting higher compression ratios in internal combustion engines. For a long time, it has found widespread application in the refining sector to produce high-octane gasoline, which is particularly essential due to increasing automotive demand and stringent fuel quality regulation. The increasing use of vehicles, rise in urbanization and utility income in developing economies like China and India have significantly contributed to gasoline consumption.
The increasing demand for private and commercial vehicles in these fast-developing markets has resulted in increased gasoline consumption, which will require even higher toluene blending needs. Government policies to uphold fuel quality and fulfill emission standards are other drivers augmenting the scope for octane boosters such as Toluene.
For instance, according to the International Energy Agency (IEA), gasoline consumption in India reached approximately 33.4 million tonnes in 2022, reflecting a 10% increase from the previous year. This rising gasoline consumption trend in major markets like India and China is directly linked to the increased utilization of toluene in refining processes to enhance fuel performance.
Drivers
-
Increasing use in adhesives and sealants drives the market growth.
One such factor that is fueling the growth of the toluene market is its increasing applications in adhesives and sealants. It is also a key component in many adhesives and sealants where it serves as an effective solvent with strong solvency power dispersing resins and other important constituents. Adhesives and sealants are required in various industries such as construction, automotive, packaging, and furniture manufacturing for bonding, assembling, or surface protection purposes.
Adhesives and sealants are highly sought after in the construction sector for applications including flooring, insulation, and paneling. These products also serve a primary role in the assembly of vehicles, interior applications, and weatherproofing within the automotive industry. Adhesives and sealants are used in a multitude of applications, which is likely to propel the market demand for toluene; an increase in infrastructure projects and construction activities as well as the production of automotive using adhesives will contribute positively towards this segment.
The U.S. Bureau of Economic Analysis declared that the U.S. construction sector experienced a major year-on-year growth of 6.7% in 2022 this robust demand for construction materials such as adhesives and sealants is expected to boost the market value during the forecast period. Such a growth trend demonstrates the increasing market potential of toluene used as an important solvent for manufacturing adhesives and sealants.
Restraint
-
Volatile prices of crude oil may hamper the market growth.
Crude oil prices affect the toluene market as toluene is produced from petroleum through several refining processes. Due to the dependence of the toluene production costs on crude oil prices, any variations in international crude oil prices cause market instability. As crude oil prices go up, the input cost of toluene rises thus making products based on toluene costlier. As price sensitivity in the automotive, paints & coatings, and adhesives sectors is high, it can increase their cost to consumers and avert demand accordingly. On the other hand, lower crude prices offer relief from rising production costs but only temporarily; it is the volatility that deters manufacturers from long-term investments and strategic planning. As a result, price fluctuations make budgeting and forecasting difficult for the whole supply chain of toluene, which negatively affects their profitability over the long run. Consequently, these economic pressures can slow growth in the toluene market, and result in manufacturers looking for alternative feedstocks or end-use materials that provide lower-cost production and more stable pricing.
Toluene Market Segmentation Analysis
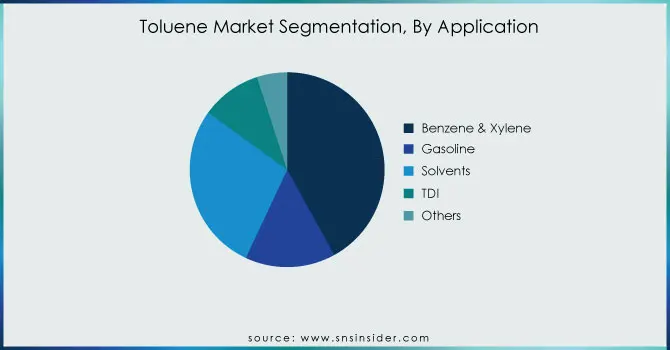
By Application
Solvents & Catalysts held the largest market share around 38% in 2023. This is due to their wide usage in multiple industries. Benzene is one of the most important petrochemical building blocks used to make a wide variety of chemicals, including styrene (used in PVC), phenol (used in adhesives and other plastics), and cyclohexane (for nylon manufacturing). In contrast, xylene is primarily used as a solvent and in the manufacture of raw materials for terephthalic acid (a precursor to polyesters). Benzene and xylene account for the largest share of the market, owing to their strong demand from end-user industries such as automotive, construction, and textiles. Additionally, changing customer preferences for high-performance materials and the growth of the chemical manufacturing sector in developing regions further increase their consumption. Benzene and xylene derivatives have market dominance due to their inherent relations of economic growth; as the demand for these derivatives rises, the appealing characteristic of benzene is that it provides a base for various chemical processes and applications.
Do You Need any Customization Research on Toluene Market - Inquire Now
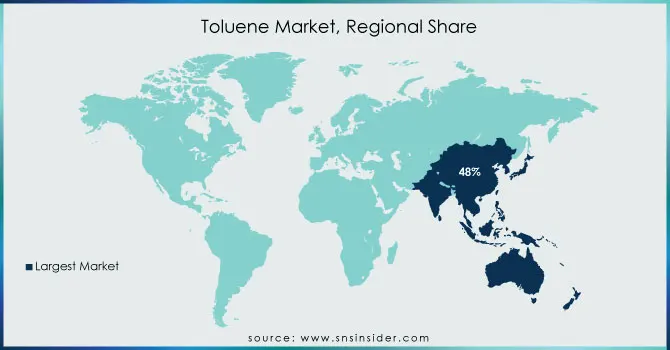
Toluene Market Regional Analysis
Asia Pacific region held the highest market share around 48% in 2023. Due to the strong industrial base, rapid urbanization, and increase from primary level automotive, construction, and textile industry sectors found within the region, the Asia Pacific region holds a significant market share over the benzene & xylene market. China and India are leading this development with great investments in infrastructure and their corresponding manufacturing activity. An expanding middle class, fueled by increasing disposable incomes in the region has created a surge in demand for consumer products manufactured using benzene and xylene derivatives such as plastics and synthetic fibres. Moreover, the rising demand for sustainability and innovation in deeming activities has raised the consumption of these phenolic compounds required to manufacture staples. Strong chemical value chains and large chemical manufacturers once again support regional dominance.
According to the National Bureau of Statistics of China, the country's industrial output rose by approximately 6.1% in 2022, highlighting the ongoing expansion of its manufacturing sector and the consequent demand for benzene and xylene. This dynamic growth landscape positions the Asia-Pacific region as a critical hub for the aromatic hydrocarbons market.
Key Players
-
ExxonMobil Corporation (Toluene Solvent, ExxonMobil Aromatic 100)
-
Royal Dutch Shell Plc (Shell Toluene, ShellSol A)
-
BASF SE (Toluene Pure, Basosolv Toluene)
-
China National Petroleum Corporation (CNPC) (CNPC Toluene, Toluene Solvent Grade)
-
Reliance Industries Limited (Reliance Toluene, Petrochemical Toluene)
-
Saudi Basic Industries Corporation (SABIC) (SABIC Toluene, Aromatics Toluene)
-
Chevron Phillips Chemical Company LLC (CPChem Toluene, Soltrol 220)
-
LyondellBasell Industries N.V. (Lyondell Toluene, Puretol)
-
Mitsui Chemicals, Inc. (Mitsui Toluene, Aromatics Toluene)
-
Indian Oil Corporation Ltd. (IOC Toluene, Industrial Grade Toluene)
-
BP Plc (BP Toluene, BP Aromatics)
-
TotalEnergies SE (Total Toluene, Toluene Industrial)
-
China Petroleum & Chemical Corporation (Sinopec) (Sinopec Toluene, Aromatics Toluene)
-
SK Global Chemical Co., Ltd. (SK Toluene, Chemical Toluene)
-
Formosa Chemicals & Fibre Corporation (Formosa Toluene, Aromatics Solvent Toluene)
-
Toray Industries, Inc. (Toray Toluene, High-Purity Toluene)
-
Tosoh Corporation (Tosoh Toluene, Pure Toluene Solvent)
-
JXTG Nippon Oil & Energy Corporation (JXTG Toluene, Solvent Toluene)
-
Idemitsu Kosan Co., Ltd. (Idemitsu Toluene, Industrial Toluene)
-
Haldia Petrochemicals Limited (HPL Toluene, HPL Aromatics Toluene)
Recent Developments:
-
In 2023, BASF launched a new product line of high-performance benzene derivatives aimed at enhancing applications in the automotive and electronics sectors. This initiative focuses on improving material properties while reducing environmental impact.
-
In 2023, Shell announced plans to invest in upgrading its chemical manufacturing facilities in Asia, specifically targeting an increase in xylene production capacity. This expansion aims to meet the growing demand for xylene in the polyester industry.
-
In 2023, ExxonMobil completed the integration of advanced technology in its petrochemical plants to enhance the efficiency of benzene production, significantly lowering operational costs and improving sustainability metrics.
| Report Attributes | Details |
|---|---|
| Market Size in 2023 | US$ 28.6 Billion |
| Market Size by 2032 | US$ 40.9 Billion |
| CAGR | CAGR of 5.4% From 2024 to 2032 |
| Base Year | 2023 |
| Forecast Period | 2024-2032 |
| Historical Data | 2020-2022 |
| Report Scope & Coverage | Market Size, Segments Analysis, Competitive Landscape, Regional Analysis, DROC & SWOT Analysis, Forecast Outlook |
| Key Segments | • By Application (Benzene & Xylene, Gasoline, Solvents, TDI, Others) |
| Regional Analysis/Coverage | North America (US, Canada, Mexico), Europe (Eastern Europe [Poland, Romania, Hungary, Turkey, Rest of Eastern Europe] Western Europe] Germany, France, UK, Italy, Spain, Netherlands, Switzerland, Austria, Rest of Western Europe]), Asia Pacific (China, India, Japan, South Korea, Vietnam, Singapore, Australia, Rest of Asia Pacific), Middle East & Africa (Middle East [UAE, Egypt, Saudi Arabia, Qatar, Rest of Middle East], Africa [Nigeria, South Africa, Rest of Africa], Latin America (Brazil, Argentina, Colombia, Rest of Latin America) |
| Company Profiles | ExxonMobil Corporation, Royal Dutch Shell Plc, BASF SE, China National Petroleum Corporation, Reliance Industries Limited, Saudi Basic Industries Corporation, Chevron Phillips Chemical Company LLC, LyondellBasell Industries N.V., Mitsui Chemicals, Inc., Indian Oil Corporation Ltd., BP Plc, TotalEnergies SE, China Petroleum & Chemical Corporation, SK Global Chemical Co., Ltd., Formosa Chemicals & Fibre Corporation, Toray Industries, Inc., Tosoh Corporation, JXTG Nippon Oil & Energy Corporation, Idemitsu Kosan Co., Ltd., Haldia Petrochemicals Limited Others |
| Key Drivers | • Increasing use in adhesives and sealants drives the market growth. |
| Restraints | • Volatile prices of crude oil may hamper the market growth. |
