Tire Recycling Market Report Scope & Overview:
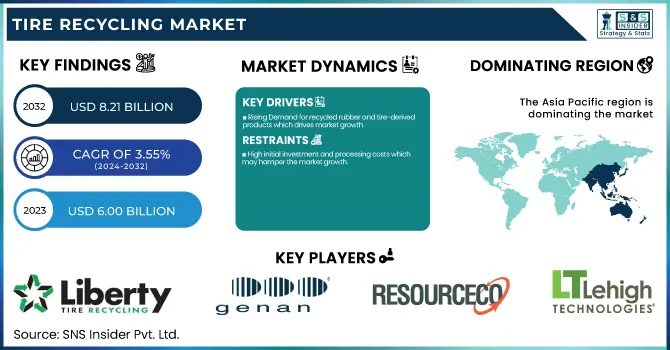
The Tire Recycling Market size was USD 6.00 Billion in 2023 and is expected to reach USD 8.21 Billion by 2032 and grow at a CAGR of 3.55 % over the forecast period of 2024-2032. The tire recycling market report provides an in-depth analysis of recycled tire output and utilization by country and type, highlighting production trends in 2023. It examines pricing trends for recycled rubber, carbon black, and steel wires across regions, alongside the regulatory landscape and government policies impacting the industry. The report also covers environmental impact metrics, including emission reduction and waste diversion rates, while assessing technological advancements in pyrolysis, devulcanization, and recycling processes. Additionally, it explores the market penetration of recycled tire-derived products across various industries, offering a data-driven perspective on the industry's growth and sustainability initiatives.
To Get more information on Tire Recycling Market - Request Free Sample Report
Tire Recycling Market Dynamics
Drivers
-
Rising Demand for recycled rubber and tire-derived products which drives market growth.
Increasing consumption of recycled rubber and products based on tire-derived material is one of the key factors expected to drive the growth of the global tire recycling market during the forecast period, across various industries. Due to its cost-effectiveness and sustainability benefits, recycled rubber is gaining momentum in applications in the construction, automotive, and sports sectors. It is incorporated in several products and is commonly used in various facilities such as crumb rubber, rubber mulch, and restored rubber for road surfaces, play areas, and commercial use. TDF is finding its way into cement kilns, paper mills, and power plants as a one-third-cheaper, high-heat alternative to fossil fuels. In the growing climate of circular economy and environmental sustainability, and with landfill avoidance high on the agenda for industries and governments, the situation finds a further positive boost as demand for recycled tire materials drives resource efficiency.
Restraint
-
High initial investment and processing costs which may hamper the market growth.
Due to extremely high initial investment and processing costs, the global tire recycling market is facing a serious challenge to its growth. The cost of production base, land, and machinery, including shredders, granulators, pyrolysis machines, etc. are vast amounts of capital needed for a recycling facility. Plus, with energy bills, wages, and upkeep, operating costs also compound financial pressure. These costs often hamper entry into the market, particularly for small and medium-sized enterprises (SMEs). Furthermore, adhering to environmental regulations and waste management standards increases the cost as companies need to implement emission control systems and sustainable disposal practices. Such financial barriers may delay new entrants in the market and consequently slow down the tire recycling market growth.
Opportunity
-
Growing adoption of recycled carbon black (RCB) in manufacturing creates an opportunity in the market.
The tire recycling market is the increasing use of recycled carbon black (RCB) for manufacturing, which is providing strong opportunities for growth. With the transition of industries to sustainable raw materials, recycled carbon black (RCB) is gaining traction as a lower-cost, environmentally friendly alternative to virgin carbon black, which is also fossil-based. More tire, plastics, coatings, and ink manufacturers are using RCB in their production processes to reduce carbon emissions without compromising end-product competitiveness. Moreover, stringent environmental regulations and increasing prices of crude oils are compelling the companies to replace them with sustainable alternatives, thereby, propelling the RCB demand. As pyrolysis technology continues to evolve and enhances the properties and regularity of RCB, its adoption will widen, opening new profitable opportunities to tire recyclers and producers investing in sustainable practices.
Challenges
-
Lack of efficient collection and sorting systems may challenge the market growth.
This hampers the expansion of the tire recycling market considerably due to the absence of organized collection or segregation systems. In many areas, existing infrastructure is poorly organized, systemic collection, transportation, and sorting of end-of-life tires (ELTs) and should be considered as a hindrance to the recycling process. The inconsistency of supply chains leads to heaps of used tires being stockpiled, illegal throwing, and landfills, which raises additional environmental issues. Sparked by improper sorting, contaminants have compromised the quality of products ranging from crumb rubber to recycled carbon black and tire-derived fuel (TDF). Recyclers struggle to maintain a steady supply of quality raw materials without standardized collection supply chains and government-backed recycling programs. This challenge needs enabling through investments in logistics infrastructure, automated sorting technologies, and waste management policies to make tire recycling more efficient and to expand the market.
Tire Recycling Market Segmentation Analysis
By Product
Rubber held the largest market share around 38% in 2023. It is owing to its widespread use in various sectors such as automotive, building & construction, sports, manufacturing, and tire industries. The most common forms of recycled rubber include crumbs rubber, rubberized asphalt, flooring products, playgrounds, and molded rubber products produced from end-of-life tires (ELTs). Reinforced concrete is a versatile and relatively inexpensive building material with significant resistance to surface damage, making it popular in many infrastructure and industrial applications. Moreover, increasing focus on sustainability and circular economy practices have driven the demand for recycled rubber, which is also seen as a sustainable substitute for rubber. Along with that, government initiatives such as subsidies to promote the recycling of tires coupled with growing demand for sustainable raw materials from the automotive sector, and the construction industry play a key role in rubber's dominance.
By Application
Building & Construction held the largest market share around 42% in 2023. It is reused tire materials are extensively used in infrastructure projects. Rubberized asphalt, roofing materials, insulation, flooring, and soundproofing applications, for example, use recycled rubber due to its durability, flexibility, and low cost. The rising focus on environmental protection is prompting governments across the globe to encourage sustainable construction and developing green infrastructure, which is expected to proliferate pump-up for tire-derived products. Moreover, rubberized asphalt improves road performance, reduces maintenance costs, and pedestrian slip resistance, and is one of the preferred techniques in building roads and pavements. This, together with the increasingly high adoption rate of green building initiatives and robust environmental regulations, is expected to boost the demand for recycled tire products in the construction sector.
Tire Recycling Market Regional Outlook
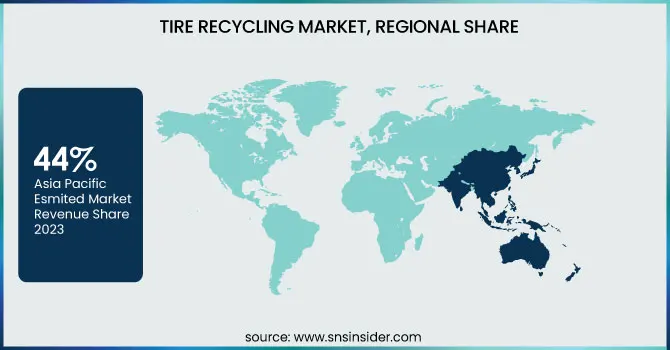
Asia Pacific held the largest market share around 44% in 2023. This is fast-paced industrialization and ambitious government initiatives for sustainable waste management in the region. China, India, Japan, and South Korea are some major ELT-producing countries due to the higher automotive sector and evolving transport networks. Regulation by the government sector on tire recycling and the rise in sustainable infrastructure projects investments by numerous companies, combined with other industries such as automotive and manufacturing are the major drivers for the growth of recycled tire products, making way for their demand. The cost economics of recycling technologies together with the availability of low-cost labor have also promoted the setting-up of large-scale recycling units across the region. Furthermore, the growing trend of referring circular economy practices and environmental sustainability, coupled with rising consumption of rubberized asphalt, recycling carbon black, and tyre-derived fuel (TDF) possess an additional growth attribute to the market growth of the Asia Pacific region.
North America held a significant market share in 2023. In the United States and Canada, mandatory waste management policies (such as Extended Producer Responsibility (EPR) programs and landfill disposal bans) drive the recycling of tires. The presence of extensive ownership of vehicles (which leads to a very large ELT generation volume) and auxiliary industries guarantee recyclers with constant supply of raw materials. Furthermore, the increase in the use of tire-derived fuel (TDF) in cement kilns, rubber-modified asphalt in road construction, and recycled carbon black (rCB) in tire manufacturing have supported the growth of the market. Combined government spending on sustainable infrastructure projects and growth in corporate commitments around the circular economy also set a strong field for North America to remain a clear global leader in tire recycling.
Get Customized Report as per Your Business Requirement - Enquiry Now
Key Players
-
Liberty Tire Recycling (Tire-Derived Fuel, Rubber Mulch)
-
GENAN HOLDING A/S (Recycled Rubber Granulate, Rubber Powder)
-
ResourceCo (Tyre-Derived Fuel, Crumb Rubber)
-
Lehigh Technologies (PolyDyne Micronized Rubber Powder, MicroDyne Micronized Rubber Powder)
-
Balkrishna Industries Limited (BKT) (Off-Highway Tires, Agricultural Tires)
-
Nokian Tyres plc (Hakkapeliitta Winter Tires, Nokian eLine)
-
Lakin Tire (Tire Collection Services, Recycled Tire Products)
-
Eldan Recycling A/S (Tire Shredders, Granulation Plants)
-
RubberMulch (Landscape Mulch, Playground Mulch)
-
Tire Disposal & Recycling, Inc. (Tire-Derived Aggregate, Tire-Derived Fuel)
-
Klean Industries (Recovered Carbon Black, Pyrolysis Oil)
-
Emanuel Tire LLC (Tire-Derived Fuel, Recycled Rubber Products)
-
West Coast Rubber Recycling (Crumb Rubber, Rubber Bark)
-
Renelux Cyprus Ltd (Tire-Derived Fuel, Recycled Rubber Granules)
-
Tire Recycling Atlantic Canada Corporation (TRACC) (Crumb Rubber, Tire-Derived Aggregate)
-
Liberty Tire Recycling Canada Ltd. (Rubber Mulch, Tire-Derived Fuel)
-
Tinna Rubber and Infrastructure Ltd. (Crumb Rubber Modifier, Reclaimed Rubber)
-
Rebound Rubber Recycling (Crumb Rubber, Rubber Mulch)
-
Green Distillation Technologies Corporation (Recovered Carbon, Recovered Oil)
-
Tyrecycle (Crumb Rubber, Tire-Derived Fuel)
Recent Development:
-
In December 2024, SSH Recycling secured approval to build an advanced tire recycling facility near Glasgow, Scotland. The plant will process 100,000 tonnes of waste tires annually while operating on a carbon-negative basis, reducing 2.7 tonnes of CO₂ emissions per tonne.
-
In September 2024, Evonik introduced an innovative tire recycling technology capable of reversing rubber vulcanization. This advancement enables the incorporation of up to four times more recycled rubber in new tires than earlier methods allowed.
| Report Attributes | Details |
| Market Size in 2023 | US$ 6.00 Billion |
| Market Size by 2032 | US$ 8.21 Billion |
| CAGR | CAGR of 3.55 % From 2024 to 2032 |
| Base Year | 2023 |
| Forecast Period | 2024-2032 |
| Historical Data | 2020-2022 |
| Report Scope & Coverage | Market Size, Segments Analysis, Competitive Landscape, Regional Analysis, DROC & SWOT Analysis, Forecast Outlook |
| Key Segments | • By Product (Rubber, Tire-derived Fuel, Tire-derived Aggregate, Carbon Black, Steel Wires, Others) • By Application (Rubber, Tire-derived Fuel, Tire-derived Aggregate, Carbon Black, Steel Wires, Others) |
| Regional Analysis/Coverage | North America (US, Canada, Mexico), Europe (Eastern Europe [Poland, Romania, Hungary, Turkey, Rest of Eastern Europe] Western Europe] Germany, France, UK, Italy, Spain, Netherlands, Switzerland, Austria, Rest of Western Europe]), Asia Pacific (China, India, Japan, South Korea, Vietnam, Singapore, Australia, Rest of Asia Pacific), Middle East & Africa (Middle East [UAE, Egypt, Saudi Arabia, Qatar, Rest of Middle East], Africa [Nigeria, South Africa, Rest of Africa], Latin America (Brazil, Argentina, Colombia, Rest of Latin America) |
| Company Profiles | Liberty Tire Recycling, GENAN HOLDING A/S, ResourceCo, Lehigh Technologies, Balkrishna Industries Limited (BKT), Nokian Tyres plc, Lakin Tire, Eldan Recycling A/S, RubberMulch, Tire Disposal & Recycling, Inc., Klean Industries, Emanuel Tire LLC, West Coast Rubber Recycling, Renelux Cyprus Ltd, Tire Recycling Atlantic Canada Corporation (TRACC), Liberty Tire Recycling Canada Ltd., Tinna Rubber and Infrastructure Ltd., Rebound Rubber Recycling, Green Distillation Technologies Corporation, Tyrecycle |
