image

Thyristor Protectors Market Report & Overview:
Thyristor Protectors Market Revenue Analysis

Get More Information on Thyristor Protectors Market - Request Sample Report

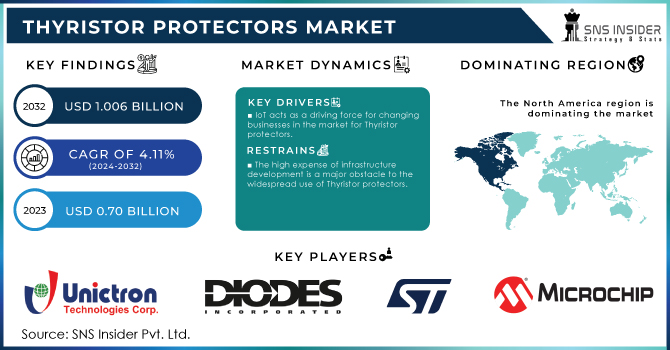
The Thyristor Protectors Market size was Valued at USD 0.70 billion in 2023 and is estimated to Reach USD 1.006 billion by 2032 and grow at a CAGR of 4.11% over the forecast period of 2024-2032.

The increasing need for Thyristor protectors to protect the expanding sensitive electronic equipment network is anticipated to increase simultaneously. Fueled by foreign investment, it creates a substantial chance for the Thyristor protectors industry. The increasing use of electronics in industries such as manufacturing, telecommunications, and smart transportation requires strong protection measures like Thyristor protectors to prevent voltage changes and ensure dependable performance. Vietnam's electronics industry is experiencing significant growth, as shown in the data. The sector saw a massive increase in exports, rising to USD 114.4 billion in 2022 from USD 47.3 billion in 2015, representing 30% of the nation's overall exports. In 2022, mobile phone exports specifically amounted to a total of USD57.9 billion. This growth is driven by things such as trade deals, policy changes, and a youthful labor force with lower minimum salaries than neighboring rivals.

Foreign corporations, especially multinational corporations, control Vietnam's EI sector. Significantly, LG and Apple have moved certain aspects of their manufacturing to Vietnam. This pattern is additionally reinforced by Fox Conn’s 2022 injection of USD 246 million into new Vietnamese facilities, as a crucial provider for Apple. The growing use of electronics and the government's efforts to attract foreign investment in the sector indicate a bright future for the Thyristor protectors market in Vietnam.

Beside the case of Vietnam, various trends across countries are propelling the worldwide Thyristor protectors market. The increase in automated systems, Internet of Things (IoT), and Industry 4.0 results in a higher number of interconnected devices across different industries, making them more vulnerable to electrical disruptions. This increased risk results in a higher need for Thyristor protectors to protect these systems. The increasing use of sustainable energy Types, such as solar and wind power, makes power distribution more challenging by causing voltage fluctuations and lightning-induced surges. Thyristor protectors are essential for safeguarding the delicate electronic parts in renewable energy systems, guaranteeing their steady function.

Data centers, which are also a result of the digital transformation, are a significant factor in the growth of the Thyristor protectors market. Even the slightest power supply interruptions can cause significant harm as numerous electronic devices are housed. Thyristor protectors maintain power stability in data centers, protecting servers and data storage from electrical disturbances. The trend is well exemplified by the US. Projected to increase from USD 12.6 billion to USD 45.3 billion by 2022, the US manufacturing sector, a pioneer in Industry 4.0 adoption, is set to significantly boost its investment in IoT. The growing use of interconnected devices and renewable energy Types requires strong protection measures such as Thyristor protectors, driving market growth.

Thyristor Protectors Market Overview:

Report Attributes Details
Key Segments • By Type (Direction Type, Mounting Type)
• By Applications (Consumer Electronics, Medical Equipment, Telecommunication, Utility And Power Distribution, Others)
Regional Coverage North America (US, Canada, Mexico), Europe (Eastern Europe [Poland, Romania, Hungary, Turkey, Rest of Eastern Europe] Western Europe] Germany, France, UK, Italy, Spain, Netherlands, Switzerland, Austria, Rest of Western Europe]), Asia Pacific (China, India, Japan, South Korea, Vietnam, Singapore, Australia, Rest of Asia Pacific), Middle East & Africa (Middle East [UAE, Egypt, Saudi Arabia, Qatar, Rest of Middle East], Africa [Nigeria, South Africa, Rest of Africa], Latin America (Brazil, Argentina, Colombia, Rest of Latin America)
Company Profiles Unicron Technologies Corporation, Diodes Incorporated, STMicroelectronics, Microchip Technology, ON Semiconductor, ProTek Devices, TE Connectivity, CYG Wayon, Shenzhen Ruilongyuan Electronics Co., Ltd, SSG Semiconductor

Market Dynamics

Drivers

IoT acts as a driving force for changing businesses in the market for Thyristor protectors.

The business IoT sector is going through strong expansion, increasing to USD 269 billion by 2023 and expected to reach USD 301 billion by 2024. Although growth rates have slowed down compared to previous years, a positive recovery is expected starting from 2025. This growth is driven by an increasing awareness of the significant ROI of IoT. Industries such as automotive and process manufacturing are at the forefront, with projected growth rates continuously surpassing the overall market. Significant investments in IoT are being driven by the automotive sector's move towards electric vehicles, autonomous driving, and factory upgrades. In the same way, process manufacturers are using IoT to improve operations, safety, and decision-making. Software, especially IoT platforms, infrastructure, and applications, is a critical sector for growth. The incorporation of AI into IoT solutions is rapidly boosting market growth by providing enhanced analytics and insights. Cases focused on automating processes and improving asset performance lead IoT investment, showing significant return on investment and fueling future expansion. The increase in IoT usage presents chances for related technologies such as Thyristor protectors. With the increasing number of IoT devices, the importance of dependable power protection becomes more crucial. Thyristor protectors shield these devices from voltage fluctuations and surges, guaranteeing continuous operation and avoiding expensive equipment breakdowns. The combination of IoT and power protection offers a hopeful opportunity for expansion and creativity.

The emergence of artificial intelligence in the field of power protection creates a favorable situation for Thyristor protectors.

Despite the attention AI is receiving for its impact on various sectors, the data center market is also seeing rapid growth within the tech industry. Data centers, forecasted to grow at a rate of 10% each year, are expected to hit USD 49 billion in new facility construction spending by 2030, serving as the foundation of the AI surge. The increasing popularity of AI is leading to a higher need for dependable power protection, which is driving the growth of the Thyristor protector market. While traditional Thyristor protectors are effective at shielding electronics from voltage spikes, incorporating AI can improve their performance even more. AI algorithms can use historical voltage fluctuations, device behavior, and environmental data to forecast potential equipment failures in data centers, which is where the synergy becomes thrilling. This results in improved maintenance plans, lower costs due to downtime, and a stronger power protection system. AI-driven Thyristor protectors can adapt protection levels according to voltage and load changes, enhancing surge absorption capabilities. Furthermore, AI can examine power usage trends in data centers to pinpoint chances for saving energy, resulting in enhanced efficiency and decreased operational expenses. The advantages go beyond merely optimizing performance. Artificial intelligence can identify the main reason behind equipment breakdowns, speeding up the troubleshooting and repair procedures. The enhancement of security through the use of AI to detect abnormal voltage patterns that could signal cyber threats provides an extra shield for data centers. This incorporation of AI gives Thyristor protector producers a noteworthy edge in the market. Companies can increase their market share and charge higher prices by providing intelligent, self-optimizing systems with advanced features. This paves the way for expansion into new market sectors like healthcare and industrial automation, where uptime and reliability are crucial. The combination of AI and Thyristor protectors is set to bring about a revolutionary change.   

Restraints

The high expense of infrastructure development is a major obstacle to the widespread use of Thyristor protectors.

Implementing these measures necessitates significant investments in advanced technology, specialized equipment, and skilled personnel. Small and medium-sized enterprises (SMEs) find this financial burden especially overwhelming. Furthermore, continued upkeep and updates contribute to increasing expenses. The economic challenges, along with a general unawareness of the advantages of Thyristor protectors, are hindering the expansion of the market. Data centers, which contain delicate electronic equipment, need strong protection but encounter high expenses for installing and maintaining Thyristor protectors. Together, these factors restrict the growth of the market.

Opportunities

The increasing influence of AI is driving the growth of the Thyristor protector market.

The rapid growth of the AI field is causing an unprecedented increase in the amount of energy used by data centers.

AI models are expected to consume significantly more energy than conventional computing tasks, causing data centers to use 3-4% of worldwide power by 2030, compared to 1-2% currently. This significant surge will require large financial investments in new power generation facilities, with an estimated cost of approximately USD 50 billion just for the United States. As a result, the need for dependable power protection options like Thyristor protectors will greatly increase. The increasing energy consumption in data centers, along with the risks of power fluctuations and surges, underscores the critical importance of implementing strong protective measures. Thyristor protectors are essential components in the changing data center environment as they can protect sensitive equipment from electrical disturbances.

Segment Analysis 

By Type

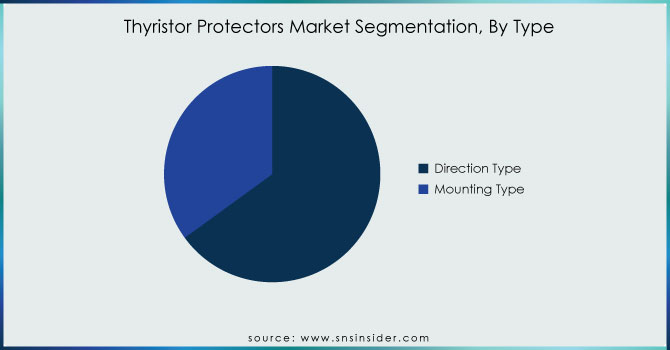
Direct type dominated the Thyristor protector market with 65% of revenue share in 2023. Direct Type Thyristor protectors are commonly chosen because of their effectiveness and dependability in handling and reducing voltage spikes and surges. This category is crucial for safeguarding delicate electronic machinery in different sectors, guaranteeing steady and uninterrupted performance. The prevalence of Direct Type Thyristor protectors is due to their direct linking technique, providing enhanced surge protection through immediate voltage clamping and excess energy dissipation. This technique works best in situations where a quick reaction to voltage changes is crucial, like in data centers, telecommunication networks, and industrial automation setups. Littelfuse and STMicroelectronics have been dedicated to advancing Thyristor protectors for improved performance and reliability. These protectors are created to manage increased surge currents and provide improved thermal stability, making them appropriate for various challenging uses.
Thyristor-Protectors-Market-Segmentation-By-Type

Get Customized Report as per Your Business Requirement - Request For Customized Report

By Application

Utility and power distribution dominated the Thyristor protector market with 42% of revenue share in 2023. The dominance of the utility and power distribution sector in the Thyristor Protectors Market reflects the critical need for reliable protection in electrical networks. These protectors are essential in managing the demands of modern power systems, which experience frequent surges and fluctuations. The growth in this sector is driven by ongoing advancements in power distribution technologies and the increasing complexity of electrical grids. As utilities and power distributors invest in infrastructure upgrades and modernization, the demand for effective protective measures, such as Thyristor protectors, is expected to grow. This segment's substantial market share underscores the importance of protecting power distribution networks to ensure stable and uninterrupted power supply.

Regional Analysis 

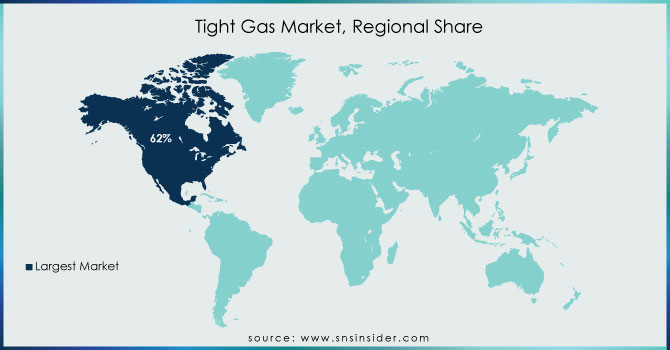
North America Dominated the Thyristor protector market with 30% of revenue share in 2023. This dominance can be attributed to several factors, including advanced infrastructure, high adoption of modern technologies, and a robust industrial base. North America, particularly the United States and Canada, is a significant player in the Thyristor Protectors Market due to its extensive utility and power distribution networks, as well as its emphasis on technological innovation and infrastructure development. The region’s significant market share highlights its reliance on effective protective solutions to manage and safeguard electrical systems from surges and faults. The region's emphasis on enhancing grid reliability, coupled with its strong industrial base, ensures a continued need for high-quality protective devices. This market dominance also signifies North America's role as a key player in shaping the future of electrical protection technologies.

Europe is the fastest in the Thyristor protector market with 25% of revenue share in 2023. This rapid growth can be attributed to several key factors driving the demand for Thyristor protectors across the continent. Europe's strong emphasis on infrastructure modernization, coupled with the expansion of renewable energy Types and advancements in power distribution networks, has significantly fueled the adoption of high-performance protective devices. The region's robust industrial sector, including major players in manufacturing, telecommunications, and utilities, creates a substantial demand for reliable protection solutions to manage electrical surges and ensure system stability. Additionally, stringent regulatory standards and safety requirements in European countries compel the use of advanced Thyristor protectors to comply with high safety and performance benchmarks. European nations are also heavily investing in upgrading their electrical grids and integrating smart grid technologies, which further accelerates the need for effective surge protection. Companies like Siemens AG, Schneider Electric, and ABB Ltd., which have a strong presence in Europe, are pivotal in supplying innovative Thyristor protection solutions that cater to the region's evolving needs. These companies leverage cutting-edge technology to enhance the reliability and efficiency of power distribution systems across Europe.
Tight-Gas-Market-Regional-Share

Key players

Major players in the Thyristor Protectors market are Unicron Technologies Corporation, Diodes Incorporated, STMicroelectronics, Microchip Technology, ON Semiconductor, ProTek Devices, TE Connectivity, CYG Wayon, Shenzhen Ruilongyuan Electronics Co., Ltd, SSG Semiconductor  and others.

RECENT DEVELOPMENT

  • In September 2023, Hitachi, Ltd. completed a USD 7 billion acquisition of ABB Power Grids AB, a prominent provider of electrical protection and power distribution products, including thyristor protectors. This strategic acquisition is aimed at expanding Hitachi's product offerings and market presence.

  • September 2023, Siemens AG announced that it had acquired C&H Technology Inc. for USD 1.7 billion. C&H Technology stands as a premier supplier in the field of electrical safeguarding and power distribution solutions, offering a range of products that encompass thyristor protectors. The acquisition is expected to expand Siemens' product portfolio and geographic reach.

Thyristor Protectors Market Report Scope:

Report Attributes Details
Market Size in 2023 USD 0.70 Billion
Market Size by 2032 USD 1.006 Billion
CAGR CAGR of 4.11 % From 2024 to 2032
Base Year 2023
Forecast Period 2024-2032
Historical Data 2020-2022
Report Scope & Coverage Market Size, Segments Analysis, Competitive  Landscape, Regional Analysis, DROC & SWOT Analysis, Forecast Outlook
Key Drivers
  • IoT acts as a driving force for changing businesses in the market for Thyristor protectors.
  • The emergence of artificial intelligence in the field of power protection creates a favorable situation for Thyristor protectors.
Restraints
  • The high expense of infrastructure development is a major obstacle to the widespread use of Thyristor protectors.

Frequently Asked Questions

Ans: The Thyristor Protectors marketis expected to grow at a CAGR of 4.11%.

Ans: The Thyristor Protectors Market size was Valued at USD 0.70 billion in 2023 and is estimated to Reach USD 1.006 billion by 2032 

Ans: The market is growing because more IoT acts as a driving force for changing businesses in the market for Thyristor protectors. & The emergence of artificial intelligence in the field of power protection creates a favorable situation for Thyristor protectors. 

AnsThe high expense of infrastructure development is a major obstacle to the widespread use of Thyristor protectors.

Ans: The North America region held the largest market share and will continue to dominate the market.

Table of Contents

1. Introduction

1.1 Market Definition

1.2 Scope

1.3 Research Assumptions

2. Industry Flowchart

3. Research Methodology

4. Market Dynamics

4.1 Drivers

4.2 Restraints

4.3 Opportunities

4.4 Challenges

5. Porter’s 5 Forces Model

6.  Pest Analysis

7. Thyristor Protectors Market Segmentation, By Type

7.1 Introduction

7.2 Direction Type

7.3 Mounting Type 

8. Thyristor Protectors Market Segmentation, By Application

8.1 Introduction

8.2 Consumer Electronics

8.3 Medical Equipment

8.4 Telecommunication

8.5 Utility and Power Distribution

 8.6 Others

9. Regional Analysis

9.1 Introduction

9.2 North America

9.2.1 Trend Analysis

9.2.2 North America Thyristor Protectors Market by Country

9.2.3 North America Thyristor Protectors Market By Type

9.2.4 North America Thyristor Protectors Market By Application

9.2.5 USA

9.2.5.1 USA Thyristor Protectors Market By Type

9.2.5.2 USA Thyristor Protectors Market By Application

9.2.6 Canada

9.2.6.1 Canada Thyristor Protectors Market By Type

9.2.6.2 Canada Thyristor Protectors Market By Application

9.2.7 Mexico

9.2.7.1 Mexico Thyristor Protectors Market By Type

9.2.7.2 Mexico Thyristor Protectors Market By Application

9.3 Europe

9.3.1 Trend Analysis

9.3.2 Eastern Europe

9.3.2.1 Eastern Europe Thyristor Protectors Market by Country

9.3.2.2 Eastern Europe Thyristor Protectors Market By Type

9.3.2.3 Eastern Europe Thyristor Protectors Market By Application

9.3.2.4 Poland

9.3.2.4.1 Poland Thyristor Protectors Market By Type

9.3.2.4.2 Poland Thyristor Protectors Market By Application

9.3.2.5 Romania

9.3.2.5.1 Romania Thyristor Protectors Market By Type

9.3.2.5.2 Romania Thyristor Protectors Market By Application

9.3.2.6 Hungary

9.3.2.6.1 Hungary Thyristor Protectors Market By Type

9.3.2.6.2 Hungary Thyristor Protectors Market By Application

9.3.2.7 Turkey

9.3.2.7.1 Turkey Thyristor Protectors Market By Type

9.3.2.7.2 Turkey Thyristor Protectors Market By Application

9.3.2.8 Rest of Eastern Europe

9.3.2.8.1 Rest of Eastern Europe Thyristor Protectors Market By Type

9.3.2.8.2 Rest of Eastern Europe Thyristor Protectors Market By Application

9.3.3 Western Europe

9.3.3.1 Western Europe Thyristor Protectors Market by Country

9.3.3.2 Western Europe Thyristor Protectors Market By Type

9.3.3.3 Western Europe Thyristor Protectors Market By Application

9.3.3.4 Germany

9.3.3.4.1 Germany Thyristor Protectors Market By Type

9.3.3.4.2 Germany Thyristor Protectors Market By Application

9.3.3.5 France

9.3.3.5.1 France Thyristor Protectors Market By Type

9.3.3.5.2 France Thyristor Protectors Market By Application

9.3.3.6 UK

9.3.3.6.1 UK Thyristor Protectors Market By Type

9.3.3.6.2 UK Thyristor Protectors Market By Application

9.3.3.7 Italy

9.3.3.7.1 Italy Thyristor Protectors Market By Type

9.3.3.7.2 Italy Thyristor Protectors Market By Application

9.3.3.8 Spain

9.3.3.8.1 Spain Thyristor Protectors Market By Type

9.3.3.8.2 Spain Thyristor Protectors Market By Application

9.3.3.9 Netherlands

9.3.3.9.1 Netherlands Thyristor Protectors Market By Type

9.3.3.9.2 Netherlands Thyristor Protectors Market By Application

9.3.3.10 Switzerland

9.3.3.10.1 Switzerland Thyristor Protectors Market By Type

9.3.3.10.2 Switzerland Thyristor Protectors Market By Application

9.3.3.11 Austria

9.3.3.11.1 Austria Thyristor Protectors Market By Type

9.3.3.11.2 Austria Thyristor Protectors Market By Application

9.3.3.12 Rest of Western Europe

9.3.3.12.1 Rest of Western Europe Thyristor Protectors Market By Type

9.3.2.12.2 Rest of Western Europe Thyristor Protectors Market By Application

9.4 Asia-Pacific

9.4.1 Trend Analysis

9.4.2 Asia Pacific Thyristor Protectors Market by Country

9.4.3 Asia Pacific Thyristor Protectors Market By Type

9.4.4 Asia Pacific Thyristor Protectors Market By Application

9.4.5 China

9.4.5.1 China Thyristor Protectors Market By Type

9.4.5.2 China Thyristor Protectors Market By Application

9.4.6 India

9.4.6.1 India Thyristor Protectors Market By Type

9.4.6.2 India Thyristor Protectors Market By Application

9.4.7 Japan

9.4.7.1 Japan Thyristor Protectors Market By Type

9.4.7.2 Japan Thyristor Protectors Market By Application

9.4.8 South Korea

9.4.8.1 South Korea Thyristor Protectors Market By Type

9.4.8.2 South Korea Thyristor Protectors Market By Application

9.4.9 Vietnam

9.4.9.1 Vietnam Thyristor Protectors Market By Type

9.4.9.2 Vietnam Thyristor Protectors Market By Application

9.4.10 Singapore

9.4.10.1 Singapore Thyristor Protectors Market By Type

9.4.10.2 Singapore Thyristor Protectors Market By Application

9.4.11 Australia

9.4.11.1 Australia Thyristor Protectors Market By Type

9.4.11.2 Australia Thyristor Protectors Market By Application

9.4.12 Rest of Asia-Pacific

9.4.12.1 Rest of Asia-Pacific Thyristor Protectors Market By Type

9.4.12.2 Rest of Asia-Pacific Thyristor Protectors Market By Application

9.5 Middle East & Africa

9.5.1 Trend Analysis

9.5.2 Middle East

9.5.2.1 Middle East Thyristor Protectors Market by Country

9.5.2.2 Middle East Thyristor Protectors Market By Type

9.5.2.3 Middle East Thyristor Protectors Market By Application

9.5.2.4 UAE

9.5.2.4.1 UAE Thyristor Protectors Market By Type

9.5.2.4.2 UAE Thyristor Protectors Market By Application

9.5.2.5 Egypt

9.5.2.5.1 Egypt Thyristor Protectors Market By Type

9.5.2.5.2 Egypt Thyristor Protectors Market By Application

9.5.2.6 Saudi Arabia

9.5.2.6.1 Saudi Arabia Thyristor Protectors Market By Type

9.5.2.6.2 Saudi Arabia Thyristor Protectors Market By Application

9.5.2.7 Qatar

9.5.2.7.1 Qatar Thyristor Protectors Market By Type

9.5.2.7.2 Qatar Thyristor Protectors Market By Application

9.5.2.8 Rest of Middle East

9.5.2.8.1 Rest of Middle East Thyristor Protectors Market By Type

9.5.2.8.2 Rest of Middle East Thyristor Protectors Market By Application

9.5.3 Africa

9.5.3.1 Africa Thyristor Protectors Market by Country

9.5.3.2 Africa Thyristor Protectors Market By Type

9.5.3.3 Africa Thyristor Protectors Market By Application

9.5.2.4 Nigeria

9.5.2.4.1 Nigeria Thyristor Protectors Market By Type

9.5.2.4.2 Nigeria Thyristor Protectors Market By Application

9.5.2.5 South Africa

9.5.2.5.1 South Africa Thyristor Protectors Market By Type

9.5.2.5.2 South Africa Thyristor Protectors Market By Application

9.5.2.6 Rest of Africa

9.5.2.6.1 Rest of Africa Thyristor Protectors Market By Type

9.5.2.6.2 Rest of Africa Thyristor Protectors Market By Application

9.6 Latin America

9.6.1 Trend Analysis

9.6.2 Latin America Thyristor Protectors Market by Country

9.6.3 Latin America Thyristor Protectors Market By Type

9.6.4 Latin America Thyristor Protectors Market By Application

9.6.5 Brazil

9.6.5.1 Brazil Thyristor Protectors Market By Type

9.6.5.2 Brazil Thyristor Protectors Market By Application

9.6.6 Argentina

9.6.6.1 Argentina Thyristor Protectors Market By Type

9.6.6.2 Argentina Thyristor Protectors Market By Application

9.6.7 Colombia

9.6.7.1 Colombia Thyristor Protectors Market By Type

9.6.7.2 Colombia Thyristor Protectors Market By Application

9.6.8 Rest of Latin America

9.6.8.1 Rest of Latin America Thyristor Protectors Market By Type

9.6.8.2 Rest of Latin America Thyristor Protectors Market By Application

10. Company Profiles

10.1 Unicron Technologies Corporation

10.1.1 Company Overview

10.1.2 Financial

10.1.3 Products/ Services Offered

10.1.4 The SNS View

10.2 Diodes Incorporated

10.2.1 Company Overview

10.2.2 Financial

10.2.3 Products/ Services Offered

10.2.4 The SNS View

10.3 STMicroelectronics

10.3.1 Company Overview

10.3.2 Financial

10.3.3 Products/ Services Offered

10.3.4 The SNS View

10.4 Microchip Technology

10.4.1 Company Overview

10.4.2 Financial

10.4.3 Products/ Services Offered

10.4.4 The SNS View

10.5 ON Semiconductor

10.5.1 Company Overview

10.5.2 Financial

10.5.3 Products/ Services Offered

10.5.4 The SNS View

10.6 ProTek Devices

10.6.1 Company Overview

10.6.2 Financial

10.6.3 Products/ Services Offered

10.6.4 The SNS View

10.7 TE Connectivity

10.7.1 Company Overview

10.7.2 Financial

10.7.3 Products/ Services Offered

10.7.4 The SNS View

10.8 CYG Wayon

10.8.1 Company Overview

10.8.2 Financial

10.8.3 Products/ Services Offered

10.8.4 The SNS View

10.9 Shenzhen Ruilongyuan Electronics Co., Ltd

10.9.1 Company Overview

10.9.2 Financial

10.9.3 Products/ Services Offered

10.9.4 The SNS View

10.10 SSG Semiconductor 

10.10.1 Company Overview

10.10.2 Financial

10.10.3 Products/ Services Offered

10.10.4 The SNS View

11. Competitive Landscape

11.1 Competitive Benchmarking

11.2 Market Share Analysis

11.3 Recent Developments

11.3.1 Industry News

11.3.2 Company News

11.3.3 Mergers & Acquisitions

12. USE Cases and Best Practices

13. Conclusion

An accurate research report requires proper strategizing as well as implementation. There are multiple factors involved in the completion of good and accurate research report and selecting the best methodology to compete the research is the toughest part. Since the research reports we provide play a crucial role in any company’s decision-making process, therefore we at SNS Insider always believe that we should choose the best method which gives us results closer to reality. This allows us to reach at a stage wherein we can provide our clients best and accurate investment to output ratio.

Each report that we prepare takes a timeframe of 350-400 business hours for production. Starting from the selection of titles through a couple of in-depth brain storming session to the final QC process before uploading our titles on our website we dedicate around 350 working hours. The titles are selected based on their current market cap and the foreseen CAGR and growth.


The 5 steps process:

Step 1: Secondary Research:

Secondary Research or Desk Research is as the name suggests is a research process wherein, we collect data through the readily available information. In this process we use various paid and unpaid databases which our team has access to and gather data through the same. This includes examining of listed companies’ annual reports, Journals, SEC filling etc. Apart from this our team has access to various associations across the globe across different industries. Lastly, we have exchange relationships with various university as well as individual libraries.

Secondary Research

Step 2: Primary Research

When we talk about primary research, it is a type of study in which the researchers collect relevant data samples directly, rather than relying on previously collected data.  This type of research is focused on gaining content specific facts that can be sued to solve specific problems. Since the collected data is fresh and first hand therefore it makes the study more accurate and genuine.

We at SNS Insider have divided Primary Research into 2 parts.

Part 1 wherein we interview the KOLs of major players as well as the upcoming ones across various geographic regions. This allows us to have their view over the market scenario and acts as an important tool to come closer to the accurate market numbers. As many as 45 paid and unpaid primary interviews are taken from both the demand and supply side of the industry to make sure we land at an accurate judgement and analysis of the market.

This step involves the triangulation of data wherein our team analyses the interview transcripts, online survey responses and observation of on filed participants. The below mentioned chart should give a better understanding of the part 1 of the primary interview.

Primary Research

Part 2: In this part of primary research the data collected via secondary research and the part 1 of the primary research is validated with the interviews from individual consultants and subject matter experts.

Consultants are those set of people who have at least 12 years of experience and expertise within the industry whereas Subject Matter Experts are those with at least 15 years of experience behind their back within the same space. The data with the help of two main processes i.e., FGDs (Focused Group Discussions) and IDs (Individual Discussions). This gives us a 3rd party nonbiased primary view of the market scenario making it a more dependable one while collation of the data pointers.

Step 3: Data Bank Validation

Once all the information is collected via primary and secondary sources, we run that information for data validation. At our intelligence centre our research heads track a lot of information related to the market which includes the quarterly reports, the daily stock prices, and other relevant information. Our data bank server gets updated every fortnight and that is how the information which we collected using our primary and secondary information is revalidated in real time.

Data Bank Validation

Step 4: QA/QC Process

After all the data collection and validation our team does a final level of quality check and quality assurance to get rid of any unwanted or undesired mistakes. This might include but not limited to getting rid of the any typos, duplication of numbers or missing of any important information. The people involved in this process include technical content writers, research heads and graphics people. Once this process is completed the title gets uploader on our platform for our clients to read it.

Step 5: Final QC/QA Process:

This is the last process and comes when the client has ordered the study. In this process a final QA/QC is done before the study is emailed to the client. Since we believe in giving our clients a good experience of our research studies, therefore, to make sure that we do not lack at our end in any way humanly possible we do a final round of quality check and then dispatch the study to the client.

Key Segments:

By Type

  • Direction Type

  • Mounting Type 

By Application

  • Consumer Electronics

  •  Medical Equipment

  • Telecommunication

  •  Utility and Power Distribution

  •  Others


Request for Segment Customization as per your Business Requirement: Segment Customization Request

REGIONAL COVERAGE:

North America

  • US

  • Canada

  • Mexico

Europe

  • Eastern Europe

    • Poland

    • Romania

    • Hungary

    • Turkey

    • Rest of Eastern Europe

  • Western Europe

    • Germany

    • France

    • UK

    • Italy

    • Spain

    • Netherlands

    • Switzerland

    • Austria

    • Rest of Western Europe

Asia Pacific

  • China

  • India

  • Japan

  • South Korea

  • Vietnam

  • Singapore

  • Australia

  • Rest of Asia Pacific

Middle East & Africa

  • Middle East

    • UAE

    • Egypt

    • Saudi Arabia

    • Qatar

    • Rest of the Middle East

  • Africa

    • Nigeria

    • South Africa

    • Rest of Africa

Latin America

  • Brazil

  • Argentina

  • Colombia

Request for Country Level Research Report: Country Level Customization Request

Available Customization

With the given market data, SNS Insider offers customization as per the company’s specific needs. The following customization options are available for the report:

  • Product Analysis

  • Criss-Cross segment analysis (e.g. Product X Application)

  • Product Matrix which gives a detailed comparison of product portfolio of each company

  • Geographic Analysis

  • Additional countries in any of the regions

  • Company Information

  • Detailed analysis and profiling of additional market players (Up to five)


  •            5000 (33% Discount)


  •            8950 (40% Discount)


  •            3050 (23% Discount)

Start a Conversation

Hi! Click one of our member below to chat on Phone