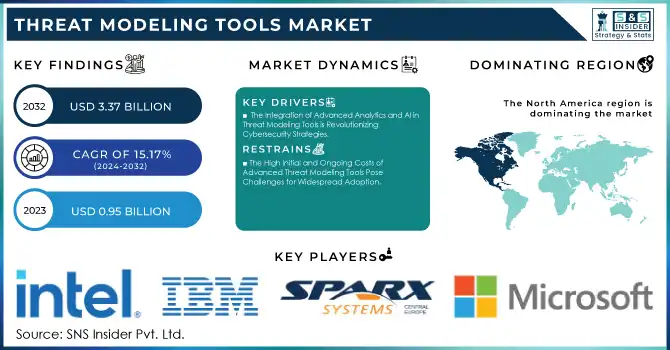
The Threat Modeling Tools Market was valued at USD 0.95 billion in 2023 and is expected to reach USD 3.37 billion by 2032, growing at a CAGR of 15.17% from 2024-2032.
To Get More Information on Threat Modeling Tools Market - Request Sample Report
The Threat Modeling Tools market is witnessing notable expansion as the increasing prevalence and complexity of cyberattacks drive organizations to implement proactive cybersecurity strategies. In 2024, the average cost of a data breach is USD 4.88 million, prompting businesses to focus on security measures to prevent these expensive incidents. As companies adopt digital technologies and expand their online visibility, the demand for tools to recognize, evaluate, and alleviate potential risks grows increasingly vital. 48% of small and medium enterprises have faced a cyberattack, and 67% of successful breaches are attributed to human mistakes. The 72% rise in security breaches between 2021 and 2023 highlights the urgency even more. The increasing understanding, particularly in areas such as finance, healthcare, and government, fuels the use of threat modeling tools as an essential component of holistic cybersecurity approaches.
This increased demand is further enhanced by the rising intricacy of IT systems and the swift advancement of technologies like IoT, cloud computing, and AI. With cyberattacks becoming increasingly advanced, conventional security measures are inadequate, leading to a heightened demand for expert threat modeling tools. To address these challenges, IBM launched a new generative AI-driven cybersecurity assistant in August 2024 to improve its Threat Detection and Response services. These tools are crucial for detecting weaknesses in dynamic, tech-oriented settings and are increasingly needed to blend effortlessly into development workflows. This transition to ongoing and instant threat evaluations creates new growth possibilities, making threat modeling tools essential resources for contemporary organizations.
Looking toward the future, the demand for threat modeling tools is poised for ongoing expansion, driven by the integration of AI and machine learning to improve predictive abilities and provide more precise risk evaluations. In May 2024, Palo Alto Networks launched AI-driven security solutions, such as AI Access Security, AI-SPM, and AI Runtime Security, to assist businesses in tackling advanced threats and ensuring secure AI integration. As cybersecurity regulations become stricter, organizations will rely more on these tools to maintain compliance and safeguard their digital assets. Moreover, the extensive implementation of DevSecOps methods, highlighting security across the development lifecycle, will additionally boost the need for threat modeling solutions. In this regard, threat modeling tools will be essential for safeguarding digital ecosystems and tackling the changing nature of cyber threats.
Market Dynamics
Drivers
The Integration of Advanced Analytics and AI in Threat Modeling Tools is Revolutionizing Cybersecurity Strategies
The incorporation of advanced analytics, artificial intelligence (AI), and machine learning into threat modeling tools is significantly enhancing their capabilities in detecting vulnerabilities and automating the prediction of potential security threats. These technologies enable threat modeling tools to analyze vast amounts of data quickly, identifying patterns and anomalies that might otherwise go unnoticed by human analysts. With AI-driven algorithms, organizations can predict possible attack vectors more accurately and assess security risks in real time, improving response times and mitigating potential damage. Moreover, AI can continually learn from evolving attack tactics, making the tools more adaptive and efficient in recognizing new vulnerabilities. This integration not only strengthens security measures but also reduces manual intervention, driving the adoption of these sophisticated tools across various industries in the wake of increasing cybersecurity threats.
The Escalating Sophistication of Cybersecurity Threats and Increasing Data Breaches are Urging the Adoption of Advanced Threat Modeling Tools
As cyberattacks grow more sophisticated, organizations are increasingly turning to advanced threat modeling tools to predict, prevent, and mitigate potential security risks. The complexity of modern attacks requires proactive and innovative security measures, driving the demand for tools that can simulate and analyze vulnerabilities before they are exploited. Additionally, the rise in high-profile data breaches underscores the critical need for early identification and resolution of security weaknesses. These incidents highlight the importance of addressing vulnerabilities early in the development cycle, making threat modeling an essential part of a company’s cybersecurity strategy. By integrating these tools into their security framework, businesses can more effectively safeguard against evolving threats and reduce the likelihood of data breaches, making them indispensable in today’s rapidly changing digital landscape.
Restraints
The High Initial and Ongoing Costs of Advanced Threat Modeling Tools Pose Challenges for Widespread Adoption
The high initial investment and ongoing maintenance costs of advanced threat modeling tools present significant challenges, particularly for small to mid-sized organizations. These businesses often struggle to allocate the necessary budget for sophisticated cybersecurity solutions, which can be prohibitively expensive when factoring in both the upfront purchase and the ongoing costs associated with updates, support, and training. Additionally, implementing these tools requires skilled professionals, which further increases the overall cost. For smaller organizations with limited resources, the financial burden of adopting these tools can outweigh the perceived benefits, limiting their ability to secure their systems effectively. As a result, many companies may either delay adoption or opt for less comprehensive, lower-cost alternatives, hindering the overall market growth and limiting the reach of threat modeling solutions across different business segments.
Organizational Resistance to Adopting New Threat Modeling Tools and Changing Established Security Processes
Many organizations face challenges in transitioning to new threat modeling tools due to resistance to change, especially if they are accustomed to traditional methods of threat detection and mitigation. Established security processes, even if less advanced, are often deeply ingrained in the company’s culture and operations. The perceived disruption that comes with integrating new tools, combined with a lack of immediate clarity on their benefits, makes some organizations hesitant to adopt them. Additionally, the learning curve associated with new technologies can be daunting, particularly for teams with limited experience or training in cutting-edge cybersecurity practices. As a result, companies may continue relying on older, more familiar security methods, delaying or avoiding the adoption of more effective, modern threat modeling tools, thereby hindering the market’s potential for growth.
Segment Analysis
By Component
In 2023, the Solution segment dominated the Threat Modeling Tools Market with a substantial revenue share of approximately 73%. This dominance is largely attributed to the growing demand for comprehensive, automated threat modeling solutions that provide businesses with scalable and effective protection against evolving cyber threats. As organizations increasingly rely on advanced technologies for risk assessment, these solutions offer enhanced security measures that address vulnerabilities early in the development cycle, making them integral to modern cybersecurity strategies.
The Services segment is expected to grow at the fastest CAGR of 17.24% from 2024 to 2032. This rapid expansion is driven by the increasing demand for expert consultation, implementation support, and ongoing maintenance of threat modeling tools. As businesses continue to adopt these tools, the need for specialized services to optimize their integration and ensure effective utilization becomes paramount, propelling the growth of the services sector within the market.
By Platform
In 2023, the Web-Based segment led the Threat Modeling Tools Market with a dominant revenue share of approximately 54%. This dominance is primarily driven by the increasing adoption of web-based platforms, which offer easy accessibility, scalability, and flexibility for businesses. These solutions allow organizations to seamlessly integrate threat modeling into their existing security infrastructures, providing real-time vulnerability detection without the need for significant hardware investments or complex installations, making them an attractive choice for businesses of all sizes.
The Cloud-Based segment is expected to grow at the fastest CAGR of 16.76% from 2024 to 2032. This rapid expansion is fueled by the growing preference for cloud solutions, which offer cost-efficiency, remote accessibility, and enhanced collaboration across geographically dispersed teams. As organizations increasingly move their operations to the cloud, the demand for cloud-based threat modeling tools that ensure secure, scalable, and flexible cybersecurity solutions is expected to rise, further accelerating market growth in this segment.
By Type
In 2023, the Static Analysis Tools segment dominated the Threat Modeling Tools Market, capturing a significant revenue share of approximately 48%. This leadership can be attributed to the effectiveness of static analysis in detecting vulnerabilities early in the development process, before the software is even run. Static analysis tools allow businesses to identify issues in the code structure and logic, making them a crucial part of the software development lifecycle and a preferred choice for organizations aiming to reduce risks before deployment.
The Hybrid Analysis Tools segment is expected grow at the fastest CAGR of 17.58% from 2024 to 2032. This growth is driven by the increasing need for more comprehensive threat detection solutions that combine both static and dynamic analysis techniques. Hybrid tools offer the advantages of analyzing both the code and its behavior during runtime, providing a more thorough understanding of potential threats. As cybersecurity needs evolve, businesses are seeking these versatile tools to ensure a robust defense across multiple attack vectors, propelling the market’s rapid expansion.
Regional Analysis
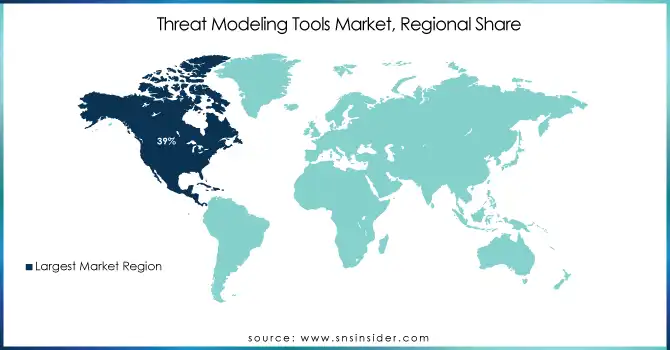
In 2023, North America dominated the Threat Modeling Tools Market, securing the largest revenue share of approximately 39%. This market leadership is driven by the region's strong emphasis on cybersecurity across both public and private sectors, particularly in the United States and Canada. The increasing frequency of cyberattacks and stringent regulatory requirements for data protection have prompted businesses to invest heavily in advanced threat modeling tools, ensuring comprehensive risk management and compliance with evolving security standards.
The Asia Pacific region is expected to grow at the fastest CAGR of 17.34% from 2024 to 2032. This rapid expansion is fueled by the region's increasing digital transformation and heightened awareness of cybersecurity risks. As businesses across industries such as finance, healthcare, and manufacturing embrace advanced security solutions, the demand for threat modeling tools is surging. Additionally, favorable government initiatives and investments in technology infrastructure are driving the growth of the cybersecurity market in this rapidly developing region.
Do You Need any Customization Research on Threat Modeling Tools Market - Enquire Now
Cisco Systems, Inc. (Cisco Threat Response, Cisco SecureX)
Sparx Systems Pty Ltd. (Enterprise Architect, Pro Cloud Server)
Varonis Systems Inc. (DatAdvantage, Data Classification Engine)
Mandiant (Mandiant Advantage, Mandiant Threat Intelligence)
Intel Corporation (Intel Security Innovation Platform, Intel Threat Detection Technology)
Kroll, LLC. (Kroll Responder, Kroll Cyber Risk Management)
Synopsys (Black Duck, Coverity)
IBM Corporation (IBM Security QRadar, IBM Guardium)
Microsoft Corporation (Microsoft Sentinel, Microsoft Defender)
Coalfire Systems, Inc. (CoalfireOne, Coalfire GRC)
Avocado Systems (Avocado Security, Avocado Enterprise Security)
ThreatModeler (ThreatModeler, ThreatModeler Cloud)
Secure Engineering (Secure Design Studio, Secure Risk)
Rogue Wave Software (Klocwork, Protect)
Aquila (Aquila Threat Modeling, Aquila Risk Manager)
RiskSense (RiskSense Platform, RiskSense Threat Intelligence)
Immersive Labs (Immersive Labs Cyber Range, Immersive Labs Threat Intelligence)
Nozomi Networks (Nozomi Networks Guardian, Nozomi Networks SCADAguardian)
ThreatQuotient (ThreatQ, ThreatQ Threat Intelligence Platform)
Zylo (Zylo Threat Modeling, Zylo Risk Analysis)
Palo Alto Networks (Cortex XSOAR, Cortex XDR)
Recent Developments:
In January 2025, Cisco unveiled its AI Defense solution to secure the AI transformation of enterprises, safeguarding AI applications from evolving threats such as data leakage and model misuse. The solution integrates advanced security features to help enterprises develop, deploy, and manage AI applications securely, addressing new risks beyond the capabilities of traditional security solutions.
Varonis introduced new data security tools at Dreamforce 2024 to enhance the protection of sensitive data across organizations, focusing on advanced detection and response capabilities to mitigate risks associated with data breaches and insider threats.
| Report Attributes | Details |
| Market Size in 2023 | USD 0.95 Billion |
| Market Size by 2032 | USD 3.37 Billion |
| CAGR | CAGR of 15.17% From 2024 to 2032 |
| Base Year | 2023 |
| Forecast Period | 2024-2032 |
| Historical Data | 2020-2022 |
| Report Scope & Coverage | Market Size, Segments Analysis, Competitive Landscape, Regional Analysis, DROC & SWOT Analysis, Forecast Outlook |
| Key Segments | • By Component (Solution, Services) • By Platform (Web-Based, Cloud-Based, Desktop-Based) • By Enterprise Size (Large Enterprise, Small and Medium Size Enterprise) • By Type (Static Analysis Tools, Dynamic Analysis Tools, Hybrid Analysis Tools) • By Application (IT & Telecom, BFSI, Healthcare, Manufacturing, Utilities) |
| Regional Analysis/Coverage | North America (US, Canada, Mexico), Europe (Eastern Europe [Poland, Romania, Hungary, Turkey, Rest of Eastern Europe] Western Europe] Germany, France, UK, Italy, Spain, Netherlands, Switzerland, Austria, Rest of Western Europe]), Asia Pacific (China, India, Japan, South Korea, Vietnam, Singapore, Australia, Rest of Asia Pacific), Middle East & Africa (Middle East [UAE, Egypt, Saudi Arabia, Qatar, Rest of Middle East], Africa [Nigeria, South Africa, Rest of Africa], Latin America (Brazil, Argentina, Colombia, Rest of Latin America) |
| Company Profiles | Cisco Systems, Inc., Sparx Systems Pty Ltd., Varonis Systems Inc., Mandiant, Intel Corporation, Kroll, LLC., Synopsys, IBM Corporation, Microsoft Corporation, Coalfire Systems, Inc., Avocado Systems, ThreatModeler, Secure Engineering, Rogue Wave Software, Aquila, RiskSense, Immersive Labs, Nozomi Networks, ThreatQuotient, Zylo, Palo Alto Networks. |
| Key Drivers | • The Integration of Advanced Analytics and AI in Threat Modeling Tools is Revolutionizing Cybersecurity Strategies • The Escalating Sophistication of Cybersecurity Threats and Increasing Data Breaches are Urging the Adoption of Advanced Threat Modeling Tools |
| RESTRAINTS | • The High Initial and Ongoing Costs of Advanced Threat Modeling Tools Pose Challenges for Widespread Adoption • Organizational Resistance to Adopting New Threat Modeling Tools and Changing Established Security Processes |
Ans. Threat Modeling Tools Market was valued at USD 0.95 billion in 2023 and is expected to reach USD 3.37 billion by 2032, growing at a CAGR of 15.17% from 2024-2032.
Ans. North America dominated the market with a 39% revenue share in 2023.
Ans. The Asia Pacific region is expected to grow at the fastest CAGR of 17.34% from 2024 to 2032.
Ans. The Static Analysis Tools segment dominated the market with a 48% revenue share in 2023.
Ans. The Solution segment dominated the market with approximately 73% revenue share in 2023.
Table of Contents:
1. Introduction
1.1 Market Definition
1.2 Scope (Inclusion and Exclusions)
1.3 Research Assumptions
2. Executive Summary
2.1 Market Overview
2.2 Regional Synopsis
2.3 Competitive Summary
3. Research Methodology
3.1 Top-Down Approach
3.2 Bottom-up Approach
3.3. Data Validation
3.4 Primary Interviews
4. Market Dynamics Impact Analysis
4.1 Market Driving Factors Analysis
4.1.1 Drivers
4.1.2 Restraints
4.2 PESTLE Analysis
4.3 Porter’s Five Forces Model
5. Statistical Insights and Trends Reporting
5.1 Feature Analysis, 2023
5.2 User Demographics, 2023
5.3 Cybersecurity Incidents, by Region (2020-2023)
5.4 Cloud Services Usage, by Region
6. Competitive Landscape
6.1 List of Major Companies, By Region
6.2 Market Share Analysis, By Region
6.3 Product Benchmarking
6.3.1 Product specifications and features
6.3.2 Pricing
6.4 Strategic Initiatives
6.4.1 Marketing and promotional activities
6.4.2 Distribution and supply chain strategies
6.4.3 Expansion plans and new product launches
6.4.4 Strategic partnerships and collaborations
6.5 Technological Advancements
6.6 Market Positioning and Branding
7. Threat Modeling Tools Market Segmentation, By Component
7.1 Chapter Overview
7.2 Solution
7.2.1 Solution Market Trends Analysis (2020-2032)
7.2.2 Solution Market Size Estimates and Forecasts to 2032 (USD Billion)
7.3 Services
7.3.1 Services Market Trends Analysis (2020-2032)
7.3.2 Services Market Size Estimates and Forecasts to 2032 (USD Billion)
8. Threat Modeling Tools Market Segmentation, By Application
8.1 Chapter Overview
8.2 IT & Telecom
8.2.1 IT & Telecom Market Trends Analysis (2020-2032)
8.2.2 IT & Telecom Market Size Estimates And Forecasts To 2032 (USD Billion)
8.3 BFSI
8.3.1 BFSI Market Trends Analysis (2020-2032)
8.3.2 BFSI Market Size Estimates And Forecasts To 2032 (USD Billion)
8.4 Healthcare
8.4.1 Healthcare Market Trends Analysis (2020-2032)
8.4.2 Healthcare Market Size Estimates And Forecasts To 2032 (USD Billion)
8.5 Manufacturing
8.5.1 Manufacturing Market Trends Analysis (2020-2032)
8.5.2 Manufacturing Market Size Estimates And Forecasts To 2032 (USD Billion)
8.6 Utilities
8.6.1 Utilities Market Trends Analysis (2020-2032)
8.6.2 Utilities Market Size Estimates And Forecasts To 2032 (USD Billion)
9. Threat Modeling Tools Market Segmentation, By Type
9.1 Chapter Overview
9.2 Static Analysis Tools
9.2.1 Static Analysis Tools Market Trends Analysis (2020-2032)
9.2.2 Static Analysis Tools Market Size Estimates And Forecasts To 2032 (USD Billion)
9.3 Dynamic Analysis Tools
9.3.1 Dynamic Analysis Tools Market Trends Analysis (2020-2032)
9.3.2 Dynamic Analysis Tools Market Size Estimates And Forecasts To 2032 (USD Billion)
9.4 Hybrid Analysis Tools
9.4.1 Hybrid Analysis Tools Market Trends Analysis (2020-2032)
9.4.2 Hybrid Analysis Tools Market Size Estimates And Forecasts To 2032 (USD Billion)
10. Threat Modeling Tools Market Segmentation, By Enterprise Size
10.1 Chapter Overview
10.2 Large Enterprise
10.2.1 Large Enterprise Market Trends Analysis (2020-2032)
10.2.2 Large Enterprise Market Size Estimates And Forecasts To 2032 (USD Billion)
10.3 Small and Medium Size Enterprise
10.3.1 Small and Medium Size Enterprise Market Trends Analysis (2020-2032)
10.3.2 Small and Medium Size Enterprise Market Size Estimates And Forecasts To 2032 (USD Billion)
11. Threat Modeling Tools Market Segmentation, By Platform
11.1 Chapter Overview
11.2 Web-Based
11.2.1 Web-Based Market Trends Analysis (2020-2032)
11.2.2 Web-Based Market Size Estimates And Forecasts To 2032 (USD Billion)
11.3 Cloud-Based
11.3.1 Cloud-Based Market Trends Analysis (2020-2032)
11.3.2 Cloud-Based Market Size Estimates And Forecasts To 2032 (USD Billion)
11.4 Desktop-Based
11.4.1 Desktop-Based Market Trends Analysis (2020-2032)
11.4.2 Desktop-Based Market Size Estimates And Forecasts To 2032 (USD Billion)
12. Regional Analysis
12.1 Chapter Overview
12.2 North America
12.2.1 Trends Analysis
12.2.2 North America Threat Modeling Tools Market Estimates And Forecasts, By Country (2020-2032) (USD Billion)
12.2.3 North America Threat Modeling Tools Market Estimates And Forecasts, By Component (2020-2032) (USD Billion)
12.2.4 North America Threat Modeling Tools Market Estimates And Forecasts, By Application (2020-2032) (USD Billion)
12.2.5 North America Threat Modeling Tools Market Estimates And Forecasts, By Type (2020-2032) (USD Billion)
12.2.6 North America Threat Modeling Tools Market Estimates And Forecasts, By Enterprise Size (2020-2032) (USD Billion)
12.2.7 North America Threat Modeling Tools Market Estimates And Forecasts, By Platform (2020-2032) (USD Billion)
12.2.8 USA
12.2.8.1 USA Threat Modeling Tools Market Estimates And Forecasts, By Component (2020-2032) (USD Billion)
12.2.8.2 USA Threat Modeling Tools Market Estimates And Forecasts, By Application (2020-2032) (USD Billion)
12.2.8.3 USA Threat Modeling Tools Market Estimates And Forecasts, By Type (2020-2032) (USD Billion)
12.2.8.4 USA Threat Modeling Tools Market Estimates And Forecasts, By Enterprise Size (2020-2032) (USD Billion)
12.2.8.5 USA Threat Modeling Tools Market Estimates And Forecasts, By Platform (2020-2032) (USD Billion)
12.2.9 Canada
12.2.9.1 Canada Threat Modeling Tools Market Estimates And Forecasts, By Component (2020-2032) (USD Billion)
12.2.9.2 Canada Threat Modeling Tools Market Estimates And Forecasts, By Application (2020-2032) (USD Billion)
12.2.9.3 Canada Threat Modeling Tools Market Estimates And Forecasts, By Type (2020-2032) (USD Billion)
12.2.9.4 Canada Threat Modeling Tools Market Estimates And Forecasts, By Enterprise Size (2020-2032) (USD Billion)
12.2.9.5 Canada Threat Modeling Tools Market Estimates And Forecasts, By Platform (2020-2032) (USD Billion)
12.2.10 Mexico
12.2.10.1 Mexico Threat Modeling Tools Market Estimates And Forecasts, By Component (2020-2032) (USD Billion)
12.2.10.2 Mexico Threat Modeling Tools Market Estimates And Forecasts, By Application (2020-2032) (USD Billion)
12.2.10.3 Mexico Threat Modeling Tools Market Estimates And Forecasts, By Type (2020-2032) (USD Billion)
12.2.10.4 Mexico Threat Modeling Tools Market Estimates And Forecasts, By Enterprise Size (2020-2032) (USD Billion)
12.2.10.5 Mexico Threat Modeling Tools Market Estimates And Forecasts, By Platform (2020-2032) (USD Billion)
12.3 Europe
12.3.1 Eastern Europe
12.3.1.1 Trends Analysis
12.3.1.2 Eastern Europe Threat Modeling Tools Market Estimates And Forecasts, By Country (2020-2032) (USD Billion)
12.3.1.3 Eastern Europe Threat Modeling Tools Market Estimates And Forecasts, By Component (2020-2032) (USD Billion)
12.3.1.4 Eastern Europe Threat Modeling Tools Market Estimates And Forecasts, By Application (2020-2032) (USD Billion)
12.3.1.5 Eastern Europe Threat Modeling Tools Market Estimates And Forecasts, By Type (2020-2032) (USD Billion)
12.3.1.6 Eastern Europe Threat Modeling Tools Market Estimates And Forecasts, By Enterprise Size (2020-2032) (USD Billion)
12.3.1.7 Eastern Europe Threat Modeling Tools Market Estimates And Forecasts, By Platform (2020-2032) (USD Billion)
12.3.1.8 Poland
12.3.1.8.1 Poland Threat Modeling Tools Market Estimates And Forecasts, By Component (2020-2032) (USD Billion)
12.3.1.8.2 Poland Threat Modeling Tools Market Estimates And Forecasts, By Application (2020-2032) (USD Billion)
12.3.1.8.3 Poland Threat Modeling Tools Market Estimates And Forecasts, By Type (2020-2032) (USD Billion)
12.3.1.8.4 Poland Threat Modeling Tools Market Estimates And Forecasts, By Enterprise Size (2020-2032) (USD Billion)
12.3.1.8.5 Poland Threat Modeling Tools Market Estimates And Forecasts, By Platform (2020-2032) (USD Billion)
12.3.1.9 Romania
12.3.1.9.1 Romania Threat Modeling Tools Market Estimates And Forecasts, By Component (2020-2032) (USD Billion)
12.3.1.9.2 Romania Threat Modeling Tools Market Estimates And Forecasts, By Application (2020-2032) (USD Billion)
12.3.1.9.3 Romania Threat Modeling Tools Market Estimates And Forecasts, By Type (2020-2032) (USD Billion)
12.3.1.9.4 Romania Threat Modeling Tools Market Estimates And Forecasts, By Enterprise Size (2020-2032) (USD Billion)
12.3.1.9.5 Romania Threat Modeling Tools Market Estimates And Forecasts, By Platform (2020-2032) (USD Billion)
12.3.1.10 Hungary
12.3.1.10.1 Hungary Threat Modeling Tools Market Estimates And Forecasts, By Component (2020-2032) (USD Billion)
12.3.1.10.2 Hungary Threat Modeling Tools Market Estimates And Forecasts, By Application (2020-2032) (USD Billion)
12.3.1.10.3 Hungary Threat Modeling Tools Market Estimates And Forecasts, By Type (2020-2032) (USD Billion)
12.3.1.10.4 Hungary Threat Modeling Tools Market Estimates And Forecasts, By Enterprise Size (2020-2032) (USD Billion)
12.3.1.10.5 Hungary Threat Modeling Tools Market Estimates And Forecasts, By Platform (2020-2032) (USD Billion)
12.3.1.11 Turkey
12.3.1.11.1 Turkey Threat Modeling Tools Market Estimates And Forecasts, By Component (2020-2032) (USD Billion)
12.3.1.11.2 Turkey Threat Modeling Tools Market Estimates And Forecasts, By Application (2020-2032) (USD Billion)
12.3.1.11.3 Turkey Threat Modeling Tools Market Estimates And Forecasts, By Type (2020-2032) (USD Billion)
12.3.1.11.4 Turkey Threat Modeling Tools Market Estimates And Forecasts, By Enterprise Size (2020-2032) (USD Billion)
12.3.1.11.5 Turkey Threat Modeling Tools Market Estimates And Forecasts, By Platform (2020-2032) (USD Billion)
12.3.1.12 Rest Of Eastern Europe
12.3.1.12.1 Rest Of Eastern Europe Threat Modeling Tools Market Estimates And Forecasts, By Component (2020-2032) (USD Billion)
12.3.1.12.2 Rest Of Eastern Europe Threat Modeling Tools Market Estimates And Forecasts, By Application (2020-2032) (USD Billion)
12.3.1.12.3 Rest Of Eastern Europe Threat Modeling Tools Market Estimates And Forecasts, By Type (2020-2032) (USD Billion)
12.3.1.12.4 Rest Of Eastern Europe Threat Modeling Tools Market Estimates And Forecasts, By Enterprise Size (2020-2032) (USD Billion)
12.3.1.12.5 Rest Of Eastern Europe Threat Modeling Tools Market Estimates And Forecasts, By Platform (2020-2032) (USD Billion)
12.3.2 Western Europe
12.3.2.1 Trends Analysis
12.3.2.2 Western Europe Threat Modeling Tools Market Estimates And Forecasts, By Country (2020-2032) (USD Billion)
12.3.2.3 Western Europe Threat Modeling Tools Market Estimates And Forecasts, By Component (2020-2032) (USD Billion)
12.3.2.4 Western Europe Threat Modeling Tools Market Estimates And Forecasts, By Application (2020-2032) (USD Billion)
12.3.2.5 Western Europe Threat Modeling Tools Market Estimates And Forecasts, By Type (2020-2032) (USD Billion)
12.3.2.6 Western Europe Threat Modeling Tools Market Estimates And Forecasts, By Enterprise Size (2020-2032) (USD Billion)
12.3.2.7 Western Europe Threat Modeling Tools Market Estimates And Forecasts, By Platform (2020-2032) (USD Billion)
12.3.2.8 Germany
12.3.2.8.1 Germany Threat Modeling Tools Market Estimates And Forecasts, By Component (2020-2032) (USD Billion)
12.3.2.8.2 Germany Threat Modeling Tools Market Estimates And Forecasts, By Application (2020-2032) (USD Billion)
12.3.2.8.3 Germany Threat Modeling Tools Market Estimates And Forecasts, By Type (2020-2032) (USD Billion)
12.3.2.8.4 Germany Threat Modeling Tools Market Estimates And Forecasts, By Enterprise Size (2020-2032) (USD Billion)
12.3.2.8.5 Germany Threat Modeling Tools Market Estimates And Forecasts, By Platform (2020-2032) (USD Billion)
12.3.2.9 France
12.3.2.9.1 France Threat Modeling Tools Market Estimates And Forecasts, By Component (2020-2032) (USD Billion)
12.3.2.9.2 France Threat Modeling Tools Market Estimates And Forecasts, By Application (2020-2032) (USD Billion)
12.3.2.9.3 France Threat Modeling Tools Market Estimates And Forecasts, By Type (2020-2032) (USD Billion)
12.3.2.9.4 France Threat Modeling Tools Market Estimates And Forecasts, By Enterprise Size (2020-2032) (USD Billion)
12.3.2.9.5 France Threat Modeling Tools Market Estimates And Forecasts, By Platform (2020-2032) (USD Billion)
12.3.2.10 UK
12.3.2.10.1 UK Threat Modeling Tools Market Estimates And Forecasts, By Component (2020-2032) (USD Billion)
12.3.2.10.2 UK Threat Modeling Tools Market Estimates And Forecasts, By Application (2020-2032) (USD Billion)
12.3.2.10.3 UK Threat Modeling Tools Market Estimates And Forecasts, By Type (2020-2032) (USD Billion)
12.3.2.10.4 UK Threat Modeling Tools Market Estimates And Forecasts, By Enterprise Size (2020-2032) (USD Billion)
12.3.2.10.5 UK Threat Modeling Tools Market Estimates And Forecasts, By Platform (2020-2032) (USD Billion)
12.3.2.11 Italy
12.3.2.11.1 Italy Threat Modeling Tools Market Estimates And Forecasts, By Component (2020-2032) (USD Billion)
12.3.2.11.2 Italy Threat Modeling Tools Market Estimates And Forecasts, By Application (2020-2032) (USD Billion)
12.3.2.11.3 Italy Threat Modeling Tools Market Estimates And Forecasts, By Type (2020-2032) (USD Billion)
12.3.2.11.4 Italy Threat Modeling Tools Market Estimates And Forecasts, By Enterprise Size (2020-2032) (USD Billion)
12.3.2.11.5 Italy Threat Modeling Tools Market Estimates And Forecasts, By Platform (2020-2032) (USD Billion)
12.3.2.12 Spain
12.3.2.12.1 Spain Threat Modeling Tools Market Estimates And Forecasts, By Component (2020-2032) (USD Billion)
12.3.2.12.2 Spain Threat Modeling Tools Market Estimates And Forecasts, By Application (2020-2032) (USD Billion)
12.3.2.12.3 Spain Threat Modeling Tools Market Estimates And Forecasts, By Type (2020-2032) (USD Billion)
12.3.2.12.4 Spain Threat Modeling Tools Market Estimates And Forecasts, By Enterprise Size (2020-2032) (USD Billion)
12.3.2.12.5 Spain Threat Modeling Tools Market Estimates And Forecasts, By Platform (2020-2032) (USD Billion)
12.3.2.13 Netherlands
12.3.2.13.1 Netherlands Threat Modeling Tools Market Estimates And Forecasts, By Component (2020-2032) (USD Billion)
12.3.2.13.2 Netherlands Threat Modeling Tools Market Estimates And Forecasts, By Application (2020-2032) (USD Billion)
12.3.2.13.3 Netherlands Threat Modeling Tools Market Estimates And Forecasts, By Type (2020-2032) (USD Billion)
12.3.2.13.4 Netherlands Threat Modeling Tools Market Estimates And Forecasts, By Enterprise Size (2020-2032) (USD Billion)
12.3.2.13.5 Netherlands Threat Modeling Tools Market Estimates And Forecasts, By Platform (2020-2032) (USD Billion)
12.3.2.14 Switzerland
12.3.2.14.1 Switzerland Threat Modeling Tools Market Estimates And Forecasts, By Component (2020-2032) (USD Billion)
12.3.2.14.2 Switzerland Threat Modeling Tools Market Estimates And Forecasts, By Application (2020-2032) (USD Billion)
12.3.2.14.3 Switzerland Threat Modeling Tools Market Estimates And Forecasts, By Type (2020-2032) (USD Billion)
12.3.2.14.4 Switzerland Threat Modeling Tools Market Estimates And Forecasts, By Enterprise Size (2020-2032) (USD Billion)
12.3.2.12.5 Switzerland Threat Modeling Tools Market Estimates And Forecasts, By Platform (2020-2032) (USD Billion)
12.3.2.15 Austria
12.3.2.15.1 Austria Threat Modeling Tools Market Estimates And Forecasts, By Component (2020-2032) (USD Billion)
12.3.2.15.2 Austria Threat Modeling Tools Market Estimates And Forecasts, By Application (2020-2032) (USD Billion)
12.3.2.15.3 Austria Threat Modeling Tools Market Estimates And Forecasts, By Type (2020-2032) (USD Billion)
12.3.2.15.4 Austria Threat Modeling Tools Market Estimates And Forecasts, By Enterprise Size (2020-2032) (USD Billion)
12.3.2.15.5 Austria Threat Modeling Tools Market Estimates And Forecasts, By Platform (2020-2032) (USD Billion)
12.3.2.16 Rest Of Western Europe
12.3.2.16.1 Rest Of Western Europe Threat Modeling Tools Market Estimates And Forecasts, By Component (2020-2032) (USD Billion)
12.3.2.16.2 Rest Of Western Europe Threat Modeling Tools Market Estimates And Forecasts, By Application (2020-2032) (USD Billion)
12.3.2.16.3 Rest Of Western Europe Threat Modeling Tools Market Estimates And Forecasts, By Type (2020-2032) (USD Billion)
12.3.2.16.4 Rest Of Western Europe Threat Modeling Tools Market Estimates And Forecasts, By Enterprise Size (2020-2032) (USD Billion)
12.3.2.16.5 Rest Of Western Europe Threat Modeling Tools Market Estimates And Forecasts, By Platform (2020-2032) (USD Billion)
12.4 Asia Pacific
12.4.1 Trends Analysis
12.4.2 Asia Pacific Threat Modeling Tools Market Estimates And Forecasts, By Country (2020-2032) (USD Billion)
12.4.3 Asia Pacific Threat Modeling Tools Market Estimates And Forecasts, By Component (2020-2032) (USD Billion)
12.4.4 Asia Pacific Threat Modeling Tools Market Estimates And Forecasts, By Application (2020-2032) (USD Billion)
12.4.5 Asia Pacific Threat Modeling Tools Market Estimates And Forecasts, By Type (2020-2032) (USD Billion)
12.4.6 Asia Pacific Threat Modeling Tools Market Estimates And Forecasts, By Enterprise Size (2020-2032) (USD Billion)
12.4.7 Asia Pacific Threat Modeling Tools Market Estimates And Forecasts, By Platform (2020-2032) (USD Billion)
12.4.8 China
12.4.8.1 China Threat Modeling Tools Market Estimates And Forecasts, By Component (2020-2032) (USD Billion)
12.4.8.2 China Threat Modeling Tools Market Estimates And Forecasts, By Application (2020-2032) (USD Billion)
12.4.8.3 China Threat Modeling Tools Market Estimates And Forecasts, By Type (2020-2032) (USD Billion)
12.4.8.4 China Threat Modeling Tools Market Estimates And Forecasts, By Enterprise Size (2020-2032) (USD Billion)
12.4.8.5 China Threat Modeling Tools Market Estimates And Forecasts, By Platform (2020-2032) (USD Billion)
12.4.9 India
12.4.9.1 India Threat Modeling Tools Market Estimates And Forecasts, By Component (2020-2032) (USD Billion)
12.4.9.2 India Threat Modeling Tools Market Estimates And Forecasts, By Application (2020-2032) (USD Billion)
12.4.9.3 India Threat Modeling Tools Market Estimates And Forecasts, By Type (2020-2032) (USD Billion)
12.4.9.4 India Threat Modeling Tools Market Estimates And Forecasts, By Enterprise Size (2020-2032) (USD Billion)
12.4.9.5 India Threat Modeling Tools Market Estimates And Forecasts, By Platform (2020-2032) (USD Billion)
12.4.10 Japan
12.4.10.1 Japan Threat Modeling Tools Market Estimates And Forecasts, By Component (2020-2032) (USD Billion)
12.4.10.2 Japan Threat Modeling Tools Market Estimates And Forecasts, By Application (2020-2032) (USD Billion)
12.4.10.3 Japan Threat Modeling Tools Market Estimates And Forecasts, By Type (2020-2032) (USD Billion)
12.4.10.4 Japan Threat Modeling Tools Market Estimates And Forecasts, By Enterprise Size (2020-2032) (USD Billion)
12.4.10.5 Japan Threat Modeling Tools Market Estimates And Forecasts, By Platform (2020-2032) (USD Billion)
12.4.11 South Korea
12.4.11.1 South Korea Threat Modeling Tools Market Estimates And Forecasts, By Component (2020-2032) (USD Billion)
12.4.11.2 South Korea Threat Modeling Tools Market Estimates And Forecasts, By Application (2020-2032) (USD Billion)
12.4.11.3 South Korea Threat Modeling Tools Market Estimates And Forecasts, By Type (2020-2032) (USD Billion)
12.4.11.4 South Korea Threat Modeling Tools Market Estimates And Forecasts, By Enterprise Size (2020-2032) (USD Billion)
12.4.11.5 South Korea Threat Modeling Tools Market Estimates And Forecasts, By Platform (2020-2032) (USD Billion)
12.4.12 Vietnam
12.4.12.1 Vietnam Threat Modeling Tools Market Estimates And Forecasts, By Component (2020-2032) (USD Billion)
12.4.12.2 Vietnam Threat Modeling Tools Market Estimates And Forecasts, By Application (2020-2032) (USD Billion)
12.4.12.3 Vietnam Threat Modeling Tools Market Estimates And Forecasts, By Type (2020-2032) (USD Billion)
12.4.12.4 Vietnam Threat Modeling Tools Market Estimates And Forecasts, By Enterprise Size (2020-2032) (USD Billion)
12.4.12.5 Vietnam Threat Modeling Tools Market Estimates And Forecasts, By Platform (2020-2032) (USD Billion)
12.4.13 Singapore
12.4.13.1 Singapore Threat Modeling Tools Market Estimates And Forecasts, By Component (2020-2032) (USD Billion)
12.4.13.2 Singapore Threat Modeling Tools Market Estimates And Forecasts, By Application (2020-2032) (USD Billion)
12.4.13.3 Singapore Threat Modeling Tools Market Estimates And Forecasts, By Type (2020-2032) (USD Billion)
12.4.13.4 Singapore Threat Modeling Tools Market Estimates And Forecasts, By Enterprise Size (2020-2032) (USD Billion)
12.4.13.5 Singapore Threat Modeling Tools Market Estimates And Forecasts, By Platform (2020-2032) (USD Billion)
12.4.14 Australia
12.4.14.1 Australia Threat Modeling Tools Market Estimates And Forecasts, By Component (2020-2032) (USD Billion)
12.4.14.2 Australia Threat Modeling Tools Market Estimates And Forecasts, By Application (2020-2032) (USD Billion)
12.4.14.3 Australia Threat Modeling Tools Market Estimates And Forecasts, By Type (2020-2032) (USD Billion)
12.4.14.4 Australia Threat Modeling Tools Market Estimates And Forecasts, By Enterprise Size (2020-2032) (USD Billion)
12.4.14.5 Australia Threat Modeling Tools Market Estimates And Forecasts, By Platform (2020-2032) (USD Billion)
12.4.15 Rest Of Asia Pacific
12.4.15.1 Rest Of Asia Pacific Threat Modeling Tools Market Estimates And Forecasts, By Component (2020-2032) (USD Billion)
12.4.15.2 Rest Of Asia Pacific Threat Modeling Tools Market Estimates And Forecasts, By Application (2020-2032) (USD Billion)
12.4.15.3 Rest Of Asia Pacific Threat Modeling Tools Market Estimates And Forecasts, By Type (2020-2032) (USD Billion)
12.4.15.4 Rest Of Asia Pacific Threat Modeling Tools Market Estimates And Forecasts, By Enterprise Size (2020-2032) (USD Billion)
12.4.15.5 Rest Of Asia Pacific Threat Modeling Tools Market Estimates And Forecasts, By Platform (2020-2032) (USD Billion)
12.5 Middle East And Africa
12.5.1 Middle East
12.5.1.1 Trends Analysis
12.5.1.2 Middle East Threat Modeling Tools Market Estimates And Forecasts, By Country (2020-2032) (USD Billion)
12.5.1.3 Middle East Threat Modeling Tools Market Estimates And Forecasts, By Component (2020-2032) (USD Billion)
12.5.1.4 Middle East Threat Modeling Tools Market Estimates And Forecasts, By Application (2020-2032) (USD Billion)
12.5.1.5 Middle East Threat Modeling Tools Market Estimates And Forecasts, By Type (2020-2032) (USD Billion)
12.5.1.6 Middle East Threat Modeling Tools Market Estimates And Forecasts, By Enterprise Size (2020-2032) (USD Billion)
12.5.1.7 Middle East Threat Modeling Tools Market Estimates And Forecasts, By Platform (2020-2032) (USD Billion)
12.5.1.8 UAE
12.5.1.8.1 UAE Threat Modeling Tools Market Estimates And Forecasts, By Component (2020-2032) (USD Billion)
12.5.1.8.2 UAE Threat Modeling Tools Market Estimates And Forecasts, By Application (2020-2032) (USD Billion)
12.5.1.8.3 UAE Threat Modeling Tools Market Estimates And Forecasts, By Type (2020-2032) (USD Billion)
12.5.1.8.4 UAE Threat Modeling Tools Market Estimates And Forecasts, By Enterprise Size (2020-2032) (USD Billion)
12.5.1.8.5 UAE Threat Modeling Tools Market Estimates And Forecasts, By Platform (2020-2032) (USD Billion)
12.5.1.9 Egypt
12.5.1.9.1 Egypt Threat Modeling Tools Market Estimates And Forecasts, By Component (2020-2032) (USD Billion)
12.5.1.9.2 Egypt Threat Modeling Tools Market Estimates And Forecasts, By Application (2020-2032) (USD Billion)
12.5.1.9.3 Egypt Threat Modeling Tools Market Estimates And Forecasts, By Type (2020-2032) (USD Billion)
12.5.1.9.4 Egypt Threat Modeling Tools Market Estimates And Forecasts, By Enterprise Size (2020-2032) (USD Billion)
12.5.1.9.5 Egypt Threat Modeling Tools Market Estimates And Forecasts, By Platform (2020-2032) (USD Billion)
12.5.1.10 Saudi Arabia
12.5.1.10.1 Saudi Arabia Threat Modeling Tools Market Estimates And Forecasts, By Component (2020-2032) (USD Billion)
12.5.1.10.2 Saudi Arabia Threat Modeling Tools Market Estimates And Forecasts, By Application (2020-2032) (USD Billion)
12.5.1.10.3 Saudi Arabia Threat Modeling Tools Market Estimates And Forecasts, By Type (2020-2032) (USD Billion)
12.5.1.10.4 Saudi Arabia Threat Modeling Tools Market Estimates And Forecasts, By Enterprise Size (2020-2032) (USD Billion)
12.5.1.10.5 Saudi Arabia Threat Modeling Tools Market Estimates And Forecasts, By Platform (2020-2032) (USD Billion)
12.5.1.11 Qatar
12.5.1.11.1 Qatar Threat Modeling Tools Market Estimates And Forecasts, By Component (2020-2032) (USD Billion)
12.5.1.11.2 Qatar Threat Modeling Tools Market Estimates And Forecasts, By Application (2020-2032) (USD Billion)
12.5.1.11.3 Qatar Threat Modeling Tools Market Estimates And Forecasts, By Type (2020-2032) (USD Billion)
12.5.1.11.4 Qatar Threat Modeling Tools Market Estimates And Forecasts, By Enterprise Size (2020-2032) (USD Billion)
12.5.1.11.5 Qatar Threat Modeling Tools Market Estimates And Forecasts, By Platform (2020-2032) (USD Billion)
12.5.1.12 Rest Of Middle East
12.5.1.12.1 Rest Of Middle East Threat Modeling Tools Market Estimates And Forecasts, By Component (2020-2032) (USD Billion)
12.5.1.12.2 Rest Of Middle East Threat Modeling Tools Market Estimates And Forecasts, By Application (2020-2032) (USD Billion)
12.5.1.12.3 Rest Of Middle East Threat Modeling Tools Market Estimates And Forecasts, By Type (2020-2032) (USD Billion)
12.5.1.12.4 Rest Of Middle East Threat Modeling Tools Market Estimates And Forecasts, By Enterprise Size (2020-2032) (USD Billion)
12.5.1.12.5 Rest Of Middle East Threat Modeling Tools Market Estimates And Forecasts, By Platform (2020-2032) (USD Billion)
12.5.2 Africa
12.5.2.1 Trends Analysis
12.5.2.2 Africa Threat Modeling Tools Market Estimates And Forecasts, By Country (2020-2032) (USD Billion)
12.5.2.3 Africa Threat Modeling Tools Market Estimates And Forecasts, By Component (2020-2032) (USD Billion)
12.5.2.4 Africa Threat Modeling Tools Market Estimates And Forecasts, By Application (2020-2032) (USD Billion)
12.5.2.5 Africa Threat Modeling Tools Market Estimates And Forecasts, By Type (2020-2032) (USD Billion)
12.5.2.6 Africa Threat Modeling Tools Market Estimates And Forecasts, By Enterprise Size (2020-2032) (USD Billion)
12.5.2.7 Africa Threat Modeling Tools Market Estimates And Forecasts, By Platform (2020-2032) (USD Billion)
12.5.2.8 South Africa
12.5.2.8.1 South Africa Threat Modeling Tools Market Estimates And Forecasts, By Component (2020-2032) (USD Billion)
12.5.2.8.2 South Africa Threat Modeling Tools Market Estimates And Forecasts, By Application (2020-2032) (USD Billion)
12.5.2.8.3 South Africa Threat Modeling Tools Market Estimates And Forecasts, By Type (2020-2032) (USD Billion)
12.5.2.8.4 South Africa Threat Modeling Tools Market Estimates And Forecasts, By Enterprise Size (2020-2032) (USD Billion)
12.5.2.8.5 South Africa Threat Modeling Tools Market Estimates And Forecasts, By Platform (2020-2032) (USD Billion)
12.5.2.9 Nigeria
12.5.2.9.1 Nigeria Threat Modeling Tools Market Estimates And Forecasts, By Component (2020-2032) (USD Billion)
12.5.2.9.2 Nigeria Threat Modeling Tools Market Estimates And Forecasts, By Application (2020-2032) (USD Billion)
12.5.2.9.3 Nigeria Threat Modeling Tools Market Estimates And Forecasts, By Type (2020-2032) (USD Billion)
12.5.2.9.4 Nigeria Threat Modeling Tools Market Estimates And Forecasts, By Enterprise Size (2020-2032) (USD Billion)
12.5.2.9.5 Nigeria Threat Modeling Tools Market Estimates And Forecasts, By Platform (2020-2032) (USD Billion)
12.5.2.10 Rest Of Africa
12.5.2.10.1 Rest Of Africa Threat Modeling Tools Market Estimates And Forecasts, By Component (2020-2032) (USD Billion)
12.5.2.10.2 Rest Of Africa Threat Modeling Tools Market Estimates And Forecasts, By Application (2020-2032) (USD Billion)
12.5.2.10.3 Rest Of Africa Threat Modeling Tools Market Estimates And Forecasts, By Type (2020-2032) (USD Billion)
12.5.2.10.4 Rest Of Africa Threat Modeling Tools Market Estimates And Forecasts, By Enterprise Size (2020-2032) (USD Billion)
12.5.2.10.5 Rest Of Africa Threat Modeling Tools Market Estimates And Forecasts, By Platform (2020-2032) (USD Billion)
12.6 Latin America
12.6.1 Trends Analysis
12.6.2 Latin America Threat Modeling Tools Market Estimates And Forecasts, By Country (2020-2032) (USD Billion)
12.6.3 Latin America Threat Modeling Tools Market Estimates And Forecasts, By Component (2020-2032) (USD Billion)
12.6.4 Latin America Threat Modeling Tools Market Estimates And Forecasts, By Application (2020-2032) (USD Billion)
12.6.5 Latin America Threat Modeling Tools Market Estimates And Forecasts, By Type (2020-2032) (USD Billion)
12.6.6 Latin America Threat Modeling Tools Market Estimates And Forecasts, By Enterprise Size (2020-2032) (USD Billion)
12.6.7 Latin America Threat Modeling Tools Market Estimates And Forecasts, By Platform (2020-2032) (USD Billion)
12.6.8 Brazil
12.6.8.1 Brazil Threat Modeling Tools Market Estimates And Forecasts, By Component (2020-2032) (USD Billion)
12.6.8.2 Brazil Threat Modeling Tools Market Estimates And Forecasts, By Application (2020-2032) (USD Billion)
12.6.8.3 Brazil Threat Modeling Tools Market Estimates And Forecasts, By Type (2020-2032) (USD Billion)
12.6.8.4 Brazil Threat Modeling Tools Market Estimates And Forecasts, By Enterprise Size (2020-2032) (USD Billion)
12.6.8.5 Brazil Threat Modeling Tools Market Estimates And Forecasts, By Platform (2020-2032) (USD Billion)
12.6.9 Argentina
12.6.9.1 Argentina Threat Modeling Tools Market Estimates And Forecasts, By Component (2020-2032) (USD Billion)
12.6.9.2 Argentina Threat Modeling Tools Market Estimates And Forecasts, By Application (2020-2032) (USD Billion)
12.6.9.3 Argentina Threat Modeling Tools Market Estimates And Forecasts, By Type (2020-2032) (USD Billion)
12.6.9.4 Argentina Threat Modeling Tools Market Estimates And Forecasts, By Enterprise Size (2020-2032) (USD Billion)
12.6.9.5 Argentina Threat Modeling Tools Market Estimates And Forecasts, By Platform (2020-2032) (USD Billion)
12.6.10 Colombia
12.6.10.1 Colombia Threat Modeling Tools Market Estimates And Forecasts, By Component (2020-2032) (USD Billion)
12.6.10.2 Colombia Threat Modeling Tools Market Estimates And Forecasts, By Application (2020-2032) (USD Billion)
12.6.10.3 Colombia Threat Modeling Tools Market Estimates And Forecasts, By Type (2020-2032) (USD Billion)
12.6.10.4 Colombia Threat Modeling Tools Market Estimates And Forecasts, By Enterprise Size (2020-2032) (USD Billion)
12.6.10.5 Colombia Threat Modeling Tools Market Estimates And Forecasts, By Platform (2020-2032) (USD Billion)
12.6.11 Rest Of Latin America
12.6.11.1 Rest Of Latin America Threat Modeling Tools Market Estimates And Forecasts, By Component (2020-2032) (USD Billion)
12.6.11.2 Rest Of Latin America Threat Modeling Tools Market Estimates And Forecasts, By Application (2020-2032) (USD Billion)
12.6.11.3 Rest Of Latin America Threat Modeling Tools Market Estimates And Forecasts, By Type (2020-2032) (USD Billion)
12.6.11.4 Rest Of Latin America Threat Modeling Tools Market Estimates And Forecasts, By Enterprise Size (2020-2032) (USD Billion)
12.6.11.5 Rest Of Latin America Threat Modeling Tools Market Estimates And Forecasts, By Platform (2020-2032) (USD Billion)
13. Company Profiles
13.1 Cisco Systems, Inc.
13.1.1 Company Overview
13.1.2 Financial
13.1.3 Products/ Services Offered
13.1.4 SWOT Analysis
13.2 Sparx Systems Pty Ltd.
13.2.1 Company Overview
13.2.2 Financial
13.2.3 Products/ Services Offered
13.2.4 SWOT Analysis
13.3 Varonis Systems Inc.
13.3.1 Company Overview
13.3.2 Financial
13.3.3 Products/ Services Offered
13.3.4 SWOT Analysis
13.4 Mandiant
13.4.1 Company Overview
13.4.2 Financial
13.4.3 Products/ Services Offered
13.4.4 SWOT Analysis
13.5 Intel Corporation
13.5.1 Company Overview
13.5.2 Financial
13.5.3 Products/ Services Offered
13.5.4 SWOT Analysis
13.6 Kroll, LLC.
13.6.1 Company Overview
13.6.2 Financial
13.6.3 Products/ Services Offered
13.6.4 SWOT Analysis
13.7 Synopsys
13.7.1 Company Overview
13.7.2 Financial
13.7.3 Products/ Services Offered
13.7.4 SWOT Analysis
13.8 IBM Corporation
13.8.1 Company Overview
13.8.2 Financial
13.8.3 Products/ Services Offered
13.8.4 SWOT Analysis
13.9 Microsoft Corporation
13.9.1 Company Overview
13.9.2 Financial
13.9.3 Products/ Services Offered
13.9.4 SWOT Analysis
13.10 Coalfire Systems, Inc.
13.10.1 Company Overview
13.10.2 Financial
13.10.3 Products/ Services Offered
13.10.4 SWOT Analysis
14. Use Cases and Best Practices
15. Conclusion
An accurate research report requires proper strategizing as well as implementation. There are multiple factors involved in the completion of good and accurate research report and selecting the best methodology to compete the research is the toughest part. Since the research reports we provide play a crucial role in any company’s decision-making process, therefore we at SNS Insider always believe that we should choose the best method which gives us results closer to reality. This allows us to reach at a stage wherein we can provide our clients best and accurate investment to output ratio.
Each report that we prepare takes a timeframe of 350-400 business hours for production. Starting from the selection of titles through a couple of in-depth brain storming session to the final QC process before uploading our titles on our website we dedicate around 350 working hours. The titles are selected based on their current market cap and the foreseen CAGR and growth.
The 5 steps process:
Step 1: Secondary Research:
Secondary Research or Desk Research is as the name suggests is a research process wherein, we collect data through the readily available information. In this process we use various paid and unpaid databases which our team has access to and gather data through the same. This includes examining of listed companies’ annual reports, Journals, SEC filling etc. Apart from this our team has access to various associations across the globe across different industries. Lastly, we have exchange relationships with various university as well as individual libraries.

Step 2: Primary Research
When we talk about primary research, it is a type of study in which the researchers collect relevant data samples directly, rather than relying on previously collected data. This type of research is focused on gaining content specific facts that can be sued to solve specific problems. Since the collected data is fresh and first hand therefore it makes the study more accurate and genuine.
We at SNS Insider have divided Primary Research into 2 parts.
Part 1 wherein we interview the KOLs of major players as well as the upcoming ones across various geographic regions. This allows us to have their view over the market scenario and acts as an important tool to come closer to the accurate market numbers. As many as 45 paid and unpaid primary interviews are taken from both the demand and supply side of the industry to make sure we land at an accurate judgement and analysis of the market.
This step involves the triangulation of data wherein our team analyses the interview transcripts, online survey responses and observation of on filed participants. The below mentioned chart should give a better understanding of the part 1 of the primary interview.

Part 2: In this part of primary research the data collected via secondary research and the part 1 of the primary research is validated with the interviews from individual consultants and subject matter experts.
Consultants are those set of people who have at least 12 years of experience and expertise within the industry whereas Subject Matter Experts are those with at least 15 years of experience behind their back within the same space. The data with the help of two main processes i.e., FGDs (Focused Group Discussions) and IDs (Individual Discussions). This gives us a 3rd party nonbiased primary view of the market scenario making it a more dependable one while collation of the data pointers.
Step 3: Data Bank Validation
Once all the information is collected via primary and secondary sources, we run that information for data validation. At our intelligence centre our research heads track a lot of information related to the market which includes the quarterly reports, the daily stock prices, and other relevant information. Our data bank server gets updated every fortnight and that is how the information which we collected using our primary and secondary information is revalidated in real time.

Step 4: QA/QC Process
After all the data collection and validation our team does a final level of quality check and quality assurance to get rid of any unwanted or undesired mistakes. This might include but not limited to getting rid of the any typos, duplication of numbers or missing of any important information. The people involved in this process include technical content writers, research heads and graphics people. Once this process is completed the title gets uploader on our platform for our clients to read it.
Step 5: Final QC/QA Process:
This is the last process and comes when the client has ordered the study. In this process a final QA/QC is done before the study is emailed to the client. Since we believe in giving our clients a good experience of our research studies, therefore, to make sure that we do not lack at our end in any way humanly possible we do a final round of quality check and then dispatch the study to the client.
Key Segments:
By Component
Solution
Services
By Platform
Web-Based
Cloud-Based
Desktop-Based
By Enterprise Size
Large Enterprise
Small and Medium Size Enterprise
By Type
Static Analysis Tools
Dynamic Analysis Tools
Hybrid Analysis Tools
By Application
IT & Telecom
BFSI
Healthcare
Manufacturing
Utilities
Request for Segment Customization as per your Business Requirement: Segment Customization Request
Regional Coverage:
North America
US
Canada
Mexico
Europe
Eastern Europe
Poland
Romania
Hungary
Turkey
Rest of Eastern Europe
Western Europe
Germany
France
UK
Italy
Spain
Netherlands
Switzerland
Austria
Rest of Western Europe
Asia Pacific
China
India
Japan
South Korea
Vietnam
Singapore
Australia
Rest of Asia Pacific
Middle East & Africa
Middle East
UAE
Egypt
Saudi Arabia
Qatar
Rest of the Middle East
Africa
Nigeria
South Africa
Rest of Africa
Latin America
Brazil
Argentina
Colombia
Rest of Latin America
Request for Country Level Research Report: Country Level Customization Request
Available Customization
With the given market data, SNS Insider offers customization as per the company’s specific needs. The following customization options are available for the report:
Product Analysis
Criss-Cross segment analysis (e.g. Product X Application)
Product Matrix which gives a detailed comparison of the product portfolio of each company
Geographic Analysis
Additional countries in any of the regions
Company Information
Detailed analysis and profiling of additional market players (Up to five)
The Neobanking Market size was valued at USD 101.0 billion in 2023 and is expected to reach USD 4104.3 billion by 2032, at a CAGR of 50.94% over 2024-2032.
Cloud Database And DBaaS Market was valued at USD 17.51 billion in 2023 and is expected to reach USD 77.65 billion by 2032, growing at a CAGR of 18.07% from 2024-2032.
The Fleet Management Software Market Size was valued at USD 28.80 billion in 2023 and is expected to reach USD 93.17 Billion by 2032 and grow at a CAGR of 14.70% over the forecast period 2024-2032.
AI Trust, Risk, and Security Management Market was valued at USD 1.98 Bn in 2023 and will to reach USD 8.7 Bn by 2032, growing at a CAGR of 17.9% by 2032.
The Artificial Intelligence Market was valued at USD 178.6 Billion in 2023 and will reach USD 2465.8 Billion by 2032, growing at a CAGR of 33.89% by 2032.
Online Language Learning Market Size was valued at USD 15.1 Billion in 2023 and is expected to reach USD 46.5 Billion by 2032, growing at a CAGR of 13.34 % over the forecast period 2024-2032.

Hi! Click one of our member below to chat on Phone
© 2025 All Rights Reserved by SNS Insider Pvt Ltd


