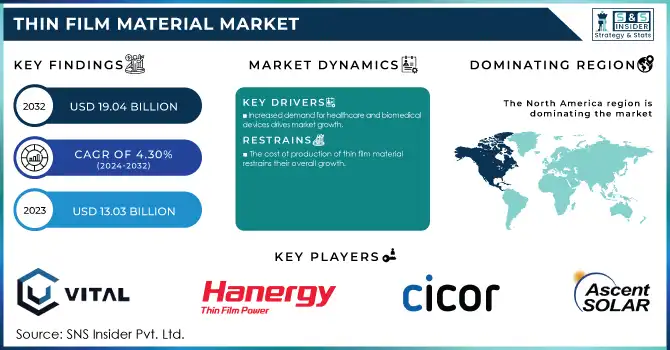
The Thin Film Material Market was USD 13.03 billion in 2023 and is expected to reach USD 19.04 billion by 2032, growing at a CAGR of 4.30% over the forecast period of 2024-2032.
Get E-PDF Sample Report on Thin Film Material Market - Request Sample Report
The thin film material market growth is increasing due to rising demand for electronics and semiconductors. The demand for electronic devices with smaller sizes, higher efficiency, and lower power dissipation is increasing, and so also is the demand for advanced materials that can facilitate these innovations. Such thin films are key to miniaturization and even identify the path toward miniaturized but higher-performing semiconductors, sensors, and displays. As an example, integrated circuits that drive modern electronic devices from smartphones, and computers to wearables, are manufactured based on thin film materials. Moreover, TFTs are also used in the creation of flat-panel displays and touchscreens. Additionally, in semiconductor fabrication, thin films are utilized in multiple deposition processes to form the precise and complex layers essential for contemporary microchips. In addition, as consumer need continues to grow for smaller, faster, and more energy-efficient electronic devices, thin films will become increasingly adopted, hence they will be an integral content for further technological development in the electronics and semiconductor industry.
India's display panel market is estimated to reach USD 19 billion by 2025, reflecting the government's commitment to enhancing domestic manufacturing capabilities.
Growing demand for renewable energy markets, which is the foremost driver for the development of the thin film material market, primarily in solar energy. With the world heading towards the transition of energy, the known source of energy is increasing in demand with renewable energy technologies, specifically solar energy. These thin film materials are essential in the research of thin film solar cells, which are increasingly preferred due to their lightweight, flexible, and less expensive nature than silicon-based solar panels. Because thin film solar panels can be embedded into various surfaces, they offer high versatility as they can be integrated into buildings, vehicles, and even wearables. The international movement towards lower carbon emissions and improved energy efficiency is providing thin film solar technology with large-scale investments due to its relatively low cost per watt and easier installation.
The government has set an ambitious target to achieve 500 GW of non-fossil fuel-based electricity generation capacity by 2030, underscoring the nation's dedication to sustainable energy.
Drivers
Increased demand for healthcare and biomedical devices drives market growth.
Rising requirements for healthcare and biomedical devices such as diagnostic equipment, implants, and medical sensors are one of the major factors driving the growth of the global thin film material market. As worldwide healthcare demands increase, particularly with aging societies and burgeoning chronic illness, advanced medical technologies are increasingly needed. Functional layers formed by thin films are among the most important features of a broad range of biomedical devices. Healthcare devices use thin films to manufacture flexible, lightweight, and compact sensors used to detect health conditions in real-time. As an example, there are many applications of thin film materials in biosensor-based glucose monitoring, wearable medical devices, and diagnostic imaging tools that incorporate them to improve their performance, reduce size, or improve durability. Furthermore, in the case of implants what is needed is a coating which helps for the biocompatibility and enhances the life of the devices such as pacemakers and prosthetics, where the thin films are helped as a coating.
Restraint
The cost of production of thin film material restrains their overall growth.
The high cost of production of thin film materials presents a major hindrance to their growth. However, the production process of thin films can be complicated and costly, but they do provide flexibility, lightweight properties, and high-performance capabilities. Thin film materials are typically fabricated using advanced deposition techniques like chemical vapor deposition (CVD), sputtering, or atomic layer deposition (ALD), which rely on specialized equipment, energy-intensive processes, and expensive raw materials. On top of this, the specificity demanded by thin films will increase the challenge, resulting in the need for tight control of temperature, pressure, and material composition. The above reasons lead to increased capital and operational expenditure that makes the thin film technologies higher in cost as compared to associated conventional materials.
By Type
a-Si held the largest revenue share 42% in 2023. This is due to its high production-output costs, ease of fabrication, and backed with strong efficiency in some applications. Being the most commercial thin film solar cell, a-Si provides several advantages from manufacturing to the consumer level. The advantage of a-Si essentially lies in the fact that it is a cheaper thin-film material to produce, compared to say, cadmium telluride (CdTe) or copper indium gallium selenide (CIGS), making it an economically suitable choice for large-scale production, especially in the solar field. A-Si absorbs sunlight efficiently, even at low-light conditions, and can be fabricated on a flexible substrate and therefore maintains market domination. As an additional consideration, a-Si technology is developed and most manufacturers already have an efficient process for a-Si-based products, thus limiting entry barriers for new players.
By Application
Photovoltaic (PV) solar cells held the largest market share around 32% in 2023. they are widely used in renewable energy applications and the growing global emphasis on green energy production. With countries and industries working towards climate goals and reducing carbon footprints, a wide range of clean, renewable energy sources including, in particular, solar power have become more in demand. Thin film materials a technology associated with PV solar cells have many advantages over silicon-based panels, including reduced manufacturing cost, flexibility, and the ability to be integrated into a variety of surfaces for example, buildings, vehicles, and portable devices. Improvements in cost-efficient materials, including amorphous silicon (a-Si), cadmium telluride (CdTe), and copper indium gallium selenide (CIGS) have accelerated the establishment of thin-film photovoltaic (TFPV) technology, which rivals or even exceeds the performance of traditional crystalline silicon cells under some conditions.
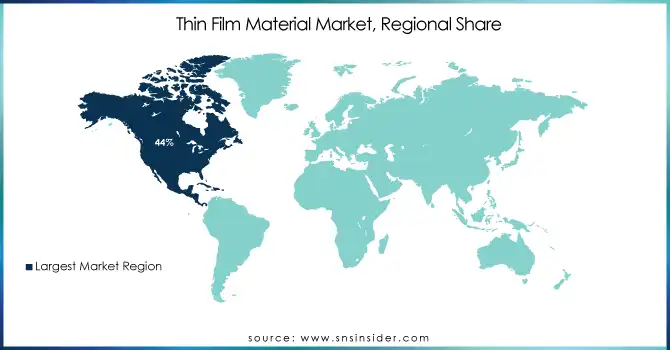
North America held the highest share of thin film material market of around 44% in 2023. It is owing to various reasons such as government stability towards renewable energy, advancement in technologies, and industrial infrastructure. For more than a decade, the U.S. and Canada have led in renewable energy adoption and in solar PV in particular, where thin film materials have a significant role. The increasing demand for thin film solar cells is also backed by government initiatives, such as tax incentives, subsidies, and renewable energy mandates, which promote rapid growth of solar energy installations. As a result of significant investments in the research and development of novel materials for solar technologies, the U.S. especially has been able to commercialize high-efficiency thin film materials such as a-Si, CdTe, and CIGS. North America is also supported by a strong manufacturing base and a high level of technological know-how, which enables the companies to manufacture thin-film materials on a large scale with premium quality and performance.
Get Customized Report as per Your Business Requirement - Request For Customized Report
Key Players
Ascent Solar Technologies, Inc. (USA)
Cicor Management AG (Switzerland)
Hanergy Thin Film Power Group (China)
Vital Materials Co. Ltd (China)
Indium Corporation (USA)
Umicore (Belgium)
Kyoto Thin Film Materials Institute (Japan)
Geomatec Co. Ltd (Japan)
Ferroperm Optics (Denmark)
JX Nippon Mining & Metals (Japan)
First Solar, Inc. (USA)
Solar Frontier K.K. (Japan)
SunPower Corporation (USA)
Sharp Corporation (Japan)
Canadian Solar Inc. (Canada)
REC Group (Norway)
Trina Solar Limited (China)
LONGi Green Energy Technology Co., Ltd. (China)
Q CELLS (South Korea)
Taiyo Yuden Co., Ltd. (Japan)
Recent Development:
June 2024, Geomatec Co. Ltd. (Japan) introduced an innovative thin film deposition technique that significantly reduces production costs while enhancing the overall performance of thin film materials.
March 2024, Indium Corporation (USA) Introduced a new line of indium-based solder materials optimized for thin film applications in the electronics industry.
May 2024, Umicore Expanded its research and development center to focus on sustainable materials for thin-film technologies.
| Report Attributes | Details |
|---|---|
| Market Size in 2023 | USD 13.03 Billion |
| Market Size by 2032 | USD19.04 Billion |
| CAGR | CAGR of 4.30% From 2024 to 2032 |
| Base Year | 2023 |
| Forecast Period | 2024-2032 |
| Historical Data | 2020-2022 |
| Report Scope & Coverage | Market Size, Segments Analysis, Competitive Landscape, Regional Analysis, DROC & SWOT Analysis, Forecast Outlook |
| Key Segments | • By Type (a-Si, CdTe, and CIGS) • By End User (Electrical, MEMS, Photovoltaic Solar cells, Semiconductors, Optical coating, Other), |
| Regional Analysis/Coverage | North America (US, Canada, Mexico), Europe (Eastern Europe [Poland, Romania, Hungary, Turkey, Rest of Eastern Europe] Western Europe] Germany, France, UK, Italy, Spain, Netherlands, Switzerland, Austria, Rest of Western Europe]), Asia Pacific (China, India, Japan, South Korea, Vietnam, Singapore, Australia, Rest of Asia Pacific), Middle East & Africa (Middle East [UAE, Egypt, Saudi Arabia, Qatar, Rest of Middle East], Africa [Nigeria, South Africa, Rest of Africa], Latin America (Brazil, Argentina, Colombia, Rest of Latin America) |
| Company Profiles | Ascent Solar Technologies, Inc., Cicor Management AG, Hanergy Thin Film Power Group, Vital Materials Co. Ltd, Indium Corporation, Umicore, Kyoto Thin Film Materials Institute, Geomatec Co. Ltd, Ferroperm Optics, JX Nippon Mining & Metals, First Solar, Inc., Solar Frontier K.K., SunPower Corporation, Sharp Corporation, Canadian Solar Inc., REC Group, Trina Solar Limited, LONGi Green Energy Technology Co., Ltd., Q CELLS, Taiyo Yuden Co., Ltd. |
| Key Drivers | • Increased demand for healthcare and biomedical devices drives market growth. |
| Restraints | • The cost of production of thin film material restrains their overall growth. |
Ans: The Thin Film Material Market was valued at USD 4.9 Billion in 2023.
Ans: The expected CAGR of the global Thin Film Material Market during the forecast period is 4.30%.
Ans: The automotive & transportation application will grow rapidly in the Thin Film Material Market from 2024-2032.
Ans: Increased demand for healthcare and biomedical devices drives market growth.
Ans: The North America led the Thin Film Material Market in the region with the highest revenue share in 2023.
Table of Contents:
1. Introduction
1.1 Market Definition
1.2 Scope (Inclusion and Exclusions)
1.3 Research Assumptions
2. Executive Summary
2.1 Market Overview
2.2 Regional Synopsis
2.3 Competitive Summary
3. Research Methodology
3.1 Top-Down Approach
3.2 Bottom-up Approach
3.3. Data Validation
3.4 Primary Interviews
4. Market Dynamics Impact Analysis
3.1 Market Driving Factors Analysis
3.1.2 Drivers
3.1.2 Restraints
3.1.3 Opportunities
3.1.4 Challenges
3.2 PESTLE Analysis
3.3 Porter’s Five Forces Model
5. Statistical Insights and Trends Reporting
5.1 Production Capacity and Utilization, by Country, By Type, 2023
5.2 Feedstock Prices, by Country, By Type, 2023
5.3 Regulatory Impact, by Country, By Type, 2023.
5.4 Environmental Metrics: Emissions Data, Waste Management Practices, and Sustainability Initiatives, by Region
5.5 Innovation and R&D, Type, 2023
6. Competitive Landscape
6.1 List of Major Companies, By Region
6.2 Market Share Analysis, By Region
6.3 Product Benchmarking
6.3.1 Product specifications and features
6.3.2 Pricing
6.4 Strategic Initiatives
6.4.1 Marketing and promotional activities
6.4.2 Distribution and Supply Chain Strategies
6.4.3 Expansion Plans and New Product Launches
6.4.4 Strategic partnerships and collaborations
6.5 Technological Advancements
6.6 Market Positioning and Branding
7. Thin Film Material Market Segmentation, By Type
7.1 Chapter Overview
7.2 a-Si
7.2.1 a-Si Trends Analysis (2020-2032)
7.2.2 a-Si Market Size Estimates and Forecasts to 2032 (USD Billion)
7.3 CdTe
7.3.1 CdTe Market Trends Analysis (2020-2032)
7.3.2 CdTe Market Size Estimates and Forecasts to 2032 (USD Billion)
7.4 CIGS
7.4.1 CIGS Trends Analysis (2020-2032)
7.4.2 CIGS Market Size Estimates and Forecasts to 2032 (USD Billion)
8. Thin Film Material Market Segmentation, by Application
8.1 Chapter Overview
8.2 Electrical and Electronic
8.2.1 Electrical and Electronic Market Trends Analysis (2020-2032)
8.2.2 Electrical and Electronic Market Size Estimates and Forecasts to 2032 (USD Billion)
8.3 MEMS
8.3.1 MEMS Market Trends Analysis (2020-2032)
8.3.2 MEMS Market Size Estimates and Forecasts to 2032 (USD Billion)
8.4 Photovoltaic Solar cells
8.4.1 Photovoltaic Solar Cells Market Trends Analysis (2020-2032)
8.4.2 Photovoltaic Solar Cells Market Size Estimates and Forecasts to 2032 (USD Billion)
8.5 Semiconductors
8.5.1 Semiconductors Market Trends Analysis (2020-2032)
8.5.2 Semiconductors Market Size Estimates and Forecasts to 2032 (USD Billion)
8.6 Optical coating
8.6.1 Optical Coating Market Trends Analysis (2020-2032)
8.6.2 Optical Coating Market Size Estimates and Forecasts to 2032 (USD Billion)
8.7 Other
8.7.1 Other Market Trends Analysis (2020-2032)
8.7.2 Other Market Size Estimates and Forecasts to 2032 (USD Billion)
9. Regional Analysis
9.1 Chapter Overview
9.2 North America
9.2.1 Trends Analysis
9.2.2 North America Thin Film Material Market Estimates and Forecasts, by Country (2020-2032) (USD Billion)
9.2.3 North America Thin Film Material Market Estimates and Forecasts, By Type (2020-2032) (USD Billion)
9.2.4 North America Thin Film Material Market Estimates and Forecasts, by Application (2020-2032) (USD Billion)
9.2.5 USA
9.2.5.1 USA Thin Film Material Market Estimates and Forecasts, By Type (2020-2032) (USD Billion)
9.2.5.2 USA Thin Film Material Market Estimates and Forecasts, by Application (2020-2032) (USD Billion)
9.2.6 Canada
9.2.6.1 Canada Thin Film Material Market Estimates and Forecasts, By Type (2020-2032) (USD Billion)
9.2.6.2 Canada Thin Film Material Market Estimates and Forecasts, by Application (2020-2032) (USD Billion)
9.2.7 Mexico
9.2.7.1 Mexico Thin Film Material Market Estimates and Forecasts, By Type (2020-2032) (USD Billion)
9.2.7.2 Mexico Thin Film Material Market Estimates and Forecasts, by Application (2020-2032) (USD Billion)
9.3 Europe
9.3.1 Eastern Europe
9.3.1.1 Trends Analysis
9.3.1.2 Eastern Europe Thin Film Material Market Estimates and Forecasts, by Country (2020-2032) (USD Billion)
9.3.1.3 Eastern Europe Thin Film Material Market Estimates and Forecasts, By Type (2020-2032) (USD Billion)
9.3.1.4 Eastern Europe Thin Film Material Market Estimates and Forecasts, by Application (2020-2032) (USD Billion)
9.3.1.5 Poland
9.3.1.5.1 Poland Thin Film Material Market Estimates and Forecasts, By Type (2020-2032) (USD Billion)
9.3.1.5.2 Poland Thin Film Material Market Estimates and Forecasts, by Application (2020-2032) (USD Billion)
9.3.1.6 Romania
9.3.1.6.1 Romania Thin Film Material Market Estimates and Forecasts, By Type (2020-2032) (USD Billion)
9.3.1.6.2 Romania Thin Film Material Market Estimates and Forecasts, by Application (2020-2032) (USD Billion)
9.3.1.7 Hungary
9.3.1.7.1 Hungary Thin Film Material Market Estimates and Forecasts, By Type (2020-2032) (USD Billion)
9.3.1.7.2 Hungary Thin Film Material Market Estimates and Forecasts, by Application (2020-2032) (USD Billion)
9.3.1.8 Turkey
9.3.1.8.1 Turkey Thin Film Material Market Estimates and Forecasts, By Type (2020-2032) (USD Billion)
9.3.1.8.2 Turkey Thin Film Material Market Estimates and Forecasts, by Application (2020-2032) (USD Billion)
9.3.1.9 Rest of Eastern Europe
9.3.1.9.1 Rest of Eastern Europe Thin Film Material Market Estimates and Forecasts, By Type (2020-2032) (USD Billion)
9.3.1.9.2 Rest of Eastern Europe Thin Film Material Market Estimates and Forecasts, by Application (2020-2032) (USD Billion)
9.3.2 Western Europe
9.3.2.1 Trends Analysis
9.3.2.2 Western Europe Thin Film Material Market Estimates and Forecasts, by Country (2020-2032) (USD Billion)
9.3.2.3 Western Europe Thin Film Material Market Estimates and Forecasts, By Type (2020-2032) (USD Billion)
9.3.2.4 Western Europe Thin Film Material Market Estimates and Forecasts, by Application (2020-2032) (USD Billion)
9.3.2.5 Germany
9.3.2.5.1 Germany Thin Film Material Market Estimates and Forecasts, By Type (2020-2032) (USD Billion)
9.3.2.5.2 Germany Thin Film Material Market Estimates and Forecasts, by Application (2020-2032) (USD Billion)
9.3.2.6 France
9.3.2.6.1 France Thin Film Material Market Estimates and Forecasts, By Type (2020-2032) (USD Billion)
9.3.2.6.2 France Thin Film Material Market Estimates and Forecasts, by Application (2020-2032) (USD Billion)
9.3.2.7 UK
9.3.2.7.1 UK Thin Film Material Market Estimates and Forecasts, By Type (2020-2032) (USD Billion)
9.3.2.7.2 UK Thin Film Material Market Estimates and Forecasts, by Application (2020-2032) (USD Billion)
9.3.2.8 Italy
9.3.2.8.1 Italy Thin Film Material Market Estimates and Forecasts, By Type (2020-2032) (USD Billion)
9.3.2.8.2 Italy Thin Film Material Market Estimates and Forecasts, by Application (2020-2032) (USD Billion)
9.3.2.9 Spain
9.3.2.9.1 Spain Thin Film Material Market Estimates and Forecasts, By Type (2020-2032) (USD Billion)
9.3.2.9.2 Spain Thin Film Material Market Estimates and Forecasts, by Application (2020-2032) (USD Billion)
9.3.2.10 Netherlands
9.3.2.10.1 Netherlands Thin Film Material Market Estimates and Forecasts, By Type (2020-2032) (USD Billion)
9.3.2.10.2 Netherlands Thin Film Material Market Estimates and Forecasts, by Application (2020-2032) (USD Billion)
9.3.2.11 Switzerland
9.3.2.11.1 Switzerland Thin Film Material Market Estimates and Forecasts, By Type (2020-2032) (USD Billion)
9.3.2.11.2 Switzerland Thin Film Material Market Estimates and Forecasts, by Application (2020-2032) (USD Billion)
9.3.2.12 Austria
9.3.2.12.1 Austria Thin Film Material Market Estimates and Forecasts, By Type (2020-2032) (USD Billion)
9.3.2.12.2 Austria Thin Film Material Market Estimates and Forecasts, by Application (2020-2032) (USD Billion)
9.3.2.13 Rest of Western Europe
9.3.2.13.1 Rest of Western Europe Thin Film Material Market Estimates and Forecasts, By Type (2020-2032) (USD Billion)
9.3.2.13.2 Rest of Western Europe Thin Film Material Market Estimates and Forecasts, by Application (2020-2032) (USD Billion)
9.4 Asia Pacific
9.4.1 Trends Analysis
9.4.2 Asia Pacific Thin Film Material Market Estimates and Forecasts, by Country (2020-2032) (USD Billion)
9.4.3 Asia Pacific Thin Film Material Market Estimates and Forecasts, By Type (2020-2032) (USD Billion)
9.4.4 Asia Pacific Thin Film Material Market Estimates and Forecasts, by Application (2020-2032) (USD Billion)
9.4.5 China
9.4.5.1 China Thin Film Material Market Estimates and Forecasts, By Type (2020-2032) (USD Billion)
9.4.5.2 China Thin Film Material Market Estimates and Forecasts, by Application (2020-2032) (USD Billion)
9.4.6 India
9.4.5.1 India Thin Film Material Market Estimates and Forecasts, By Type (2020-2032) (USD Billion)
9.4.5.2 India Thin Film Material Market Estimates and Forecasts, by Application (2020-2032) (USD Billion)
9.4.5 Japan
9.4.5.1 Japan Thin Film Material Market Estimates and Forecasts, By Type (2020-2032) (USD Billion)
9.4.5.2 Japan Thin Film Material Market Estimates and Forecasts, by Application (2020-2032) (USD Billion)
9.4.6 South Korea
9.4.6.1 South Korea Thin Film Material Market Estimates and Forecasts, By Type (2020-2032) (USD Billion)
9.4.6.2 South Korea Thin Film Material Market Estimates and Forecasts, by Application (2020-2032) (USD Billion)
9.4.7 Vietnam
9.4.7.1 Vietnam Thin Film Material Market Estimates and Forecasts, By Type (2020-2032) (USD Billion)
9.2.7.2 Vietnam Thin Film Material Market Estimates and Forecasts, by Application (2020-2032) (USD Billion)
9.4.8 Singapore
9.4.8.1 Singapore Thin Film Material Market Estimates and Forecasts, By Type (2020-2032) (USD Billion)
9.4.8.2 Singapore Thin Film Material Market Estimates and Forecasts, by Application (2020-2032) (USD Billion)
9.4.9 Australia
9.4.9.1 Australia Thin Film Material Market Estimates and Forecasts, By Type (2020-2032) (USD Billion)
9.4.9.2 Australia Thin Film Material Market Estimates and Forecasts, by Application (2020-2032) (USD Billion)
9.4.10 Rest of Asia Pacific
9.4.10.1 Rest of Asia Pacific Thin Film Material Market Estimates and Forecasts, By Type (2020-2032) (USD Billion)
9.4.10.2 Rest of Asia Pacific Thin Film Material Market Estimates and Forecasts, by Application (2020-2032) (USD Billion)
9.5 Middle East and Africa
9.5.1 Middle East
9.5.1.1 Trends Analysis
9.5.1.2 Middle East Thin Film Material Market Estimates and Forecasts, by Country (2020-2032) (USD Billion)
9.5.1.3 Middle East Thin Film Material Market Estimates and Forecasts, By Type (2020-2032) (USD Billion)
9.5.1.4 Middle East Thin Film Material Market Estimates and Forecasts, by Application (2020-2032) (USD Billion)
9.5.1.5 UAE
9.5.1.5.1 UAE Thin Film Material Market Estimates and Forecasts, By Type (2020-2032) (USD Billion)
9.5.1.5.2 UAE Thin Film Material Market Estimates and Forecasts, by Application (2020-2032) (USD Billion)
9.5.1.6 Egypt
9.5.1.6.1 Egypt Thin Film Material Market Estimates and Forecasts, By Type (2020-2032) (USD Billion)
9.5.1.6.2 Egypt Thin Film Material Market Estimates and Forecasts, by Application (2020-2032) (USD Billion)
9.5.1.7 Saudi Arabia
9.5.1.7.1 Saudi Arabia Thin Film Material Market Estimates and Forecasts, By Type (2020-2032) (USD Billion)
9.5.1.7.2 Saudi Arabia Thin Film Material Market Estimates and Forecasts, by Application (2020-2032) (USD Billion)
9.5.1.8 Qatar
9.5.1.8.1 Qatar Thin Film Material Market Estimates and Forecasts, By Type (2020-2032) (USD Billion)
9.5.1.8.2 Qatar Thin Film Material Market Estimates and Forecasts, by Application (2020-2032) (USD Billion)
9.5.1.9 Rest of Middle East
9.5.1.9.1 Rest of Middle East Thin Film Material Market Estimates and Forecasts, By Type (2020-2032) (USD Billion)
9.5.1.9.2 Rest of Middle East Thin Film Material Market Estimates and Forecasts, by Application (2020-2032) (USD Billion)
9.5.2 Africa
9.5.2.1 Trends Analysis
9.5.2.2 Africa Thin Film Material Market Estimates and Forecasts, by Country (2020-2032) (USD Billion)
9.5.2.3 Africa Thin Film Material Market Estimates and Forecasts, By Type (2020-2032) (USD Billion)
9.5.2.4 Africa Thin Film Material Market Estimates and Forecasts, by Application (2020-2032) (USD Billion)
9.5.2.5 South Africa
9.5.2.5.1 South Africa Thin Film Material Market Estimates and Forecasts, By Type (2020-2032) (USD Billion)
9.5.2.5.2 South Africa Thin Film Material Market Estimates and Forecasts, by Application (2020-2032) (USD Billion)
9.5.2.6 Nigeria
9.5.2.6.1 Nigeria Thin Film Material Market Estimates and Forecasts, By Type (2020-2032) (USD Billion)
9.5.2.6.2 Nigeria Thin Film Material Market Estimates and Forecasts, by Application (2020-2032) (USD Billion)
9.6 Latin America
9.6.1 Trends Analysis
9.6.2 Latin America Thin Film Material Market Estimates and Forecasts, by Country (2020-2032) (USD Billion)
9.6.3 Latin America Thin Film Material Market Estimates and Forecasts, By Type (2020-2032) (USD Billion)
9.6.4 Latin America Thin Film Material Market Estimates and Forecasts, by Application (2020-2032) (USD Billion)
9.6.5 Brazil
9.6.5.1 Brazil Thin Film Material Market Estimates and Forecasts, By Type (2020-2032) (USD Billion)
9.6.5.2 Brazil Thin Film Material Market Estimates and Forecasts, by Application (2020-2032) (USD Billion)
9.6.6 Argentina
9.6.6.1 Argentina Thin Film Material Market Estimates and Forecasts, By Type (2020-2032) (USD Billion)
9.6.6.2 Argentina Thin Film Material Market Estimates and Forecasts, by Application (2020-2032) (USD Billion)
9.6.7 Colombia
9.6.7.1 Colombia Thin Film Material Market Estimates and Forecasts, By Type (2020-2032) (USD Billion)
9.6.7.2 Colombia Thin Film Material Market Estimates and Forecasts, by Application (2020-2032) (USD Billion)
9.6.8 Rest of Latin America
9.6.8.1 Rest of Latin America Thin Film Material Market Estimates and Forecasts, By Type (2020-2032) (USD Billion)
9.6.8.2 Rest of Latin America Thin Film Material Market Estimates and Forecasts, by Application (2020-2032) (USD Billion)
10. Company Profiles
10.1 Ascent Solar Technologies Inc.
10.1.1 Company Overview
10.1.2 Financial
10.1.3 Product / Services Offered
10.1.4 SWOT Analysis
10.2 Cicor Management AG
10.2.1 Company Overview
10.2.2 Financial
10.2.3 Product/ Services Offered
10.2.4 SWOT Analysis
10.3 Hanergy Thin Film Power Group
10.3.1 Company Overview
10.3.2 Financial
10.3.3 Product/ Services Offered
10.3.4 SWOT Analysis
10.4 Vital Materials Co. ltd
10.4.1 Company Overview
10.4.2 Financial
10.4.3 Product/ Services Offered
10.4.4 SWOT Analysis
10.5 Indium Corporation
10.5.1 Company Overview
10.5.2 Financial
10.5.3 Product/ Services Offered
10.5.4 SWOT Analysis
10.6 Umicore
10.6.1 Company Overview
10.6.2 Financial
10.6.3 Product/ Services Offered
10.6.4 SWOT Analysis
10.7 Geomatec Co ltd,
10.7.1 Company Overview
10.7.2 Financial
10.7.3 Product/ Services Offered
10.7.4 SWOT Analysis
10.8 Ferroperm Optics
10.8.1 Company Overview
10.8.2 Financial
10.8.3 Product/ Services Offered
10.8.4 SWOT Analysis
10.9 JX Nippon Mining & Metals
10.9.1 Company Overview
10.9.2 Financial
10.9.3 Product/ Services Offered
10.9.4 SWOT Analysis
10.10 Kyoto Thin film materials institute
10.10.1 Company Overview
10.10.2 Financial
10.10.3 Product/ Services Offered
10.10.4 SWOT Analysis
11. Use Cases and Best Practices
12. Conclusion
An accurate research report requires proper strategizing as well as implementation. There are multiple factors involved in the completion of good and accurate research report and selecting the best methodology to compete the research is the toughest part. Since the research reports we provide play a crucial role in any company’s decision-making process, therefore we at SNS Insider always believe that we should choose the best method which gives us results closer to reality. This allows us to reach at a stage wherein we can provide our clients best and accurate investment to output ratio.
Each report that we prepare takes a timeframe of 350-400 business hours for production. Starting from the selection of titles through a couple of in-depth brain storming session to the final QC process before uploading our titles on our website we dedicate around 350 working hours. The titles are selected based on their current market cap and the foreseen CAGR and growth.
The 5 steps process:
Step 1: Secondary Research:
Secondary Research or Desk Research is as the name suggests is a research process wherein, we collect data through the readily available information. In this process we use various paid and unpaid databases which our team has access to and gather data through the same. This includes examining of listed companies’ annual reports, Journals, SEC filling etc. Apart from this our team has access to various associations across the globe across different industries. Lastly, we have exchange relationships with various university as well as individual libraries.

Step 2: Primary Research
When we talk about primary research, it is a type of study in which the researchers collect relevant data samples directly, rather than relying on previously collected data. This type of research is focused on gaining content specific facts that can be sued to solve specific problems. Since the collected data is fresh and first hand therefore it makes the study more accurate and genuine.
We at SNS Insider have divided Primary Research into 2 parts.
Part 1 wherein we interview the KOLs of major players as well as the upcoming ones across various geographic regions. This allows us to have their view over the market scenario and acts as an important tool to come closer to the accurate market numbers. As many as 45 paid and unpaid primary interviews are taken from both the demand and supply side of the industry to make sure we land at an accurate judgement and analysis of the market.
This step involves the triangulation of data wherein our team analyses the interview transcripts, online survey responses and observation of on filed participants. The below mentioned chart should give a better understanding of the part 1 of the primary interview.

Part 2: In this part of primary research the data collected via secondary research and the part 1 of the primary research is validated with the interviews from individual consultants and subject matter experts.
Consultants are those set of people who have at least 12 years of experience and expertise within the industry whereas Subject Matter Experts are those with at least 15 years of experience behind their back within the same space. The data with the help of two main processes i.e., FGDs (Focused Group Discussions) and IDs (Individual Discussions). This gives us a 3rd party nonbiased primary view of the market scenario making it a more dependable one while collation of the data pointers.
Step 3: Data Bank Validation
Once all the information is collected via primary and secondary sources, we run that information for data validation. At our intelligence centre our research heads track a lot of information related to the market which includes the quarterly reports, the daily stock prices, and other relevant information. Our data bank server gets updated every fortnight and that is how the information which we collected using our primary and secondary information is revalidated in real time.

Step 4: QA/QC Process
After all the data collection and validation our team does a final level of quality check and quality assurance to get rid of any unwanted or undesired mistakes. This might include but not limited to getting rid of the any typos, duplication of numbers or missing of any important information. The people involved in this process include technical content writers, research heads and graphics people. Once this process is completed the title gets uploader on our platform for our clients to read it.
Step 5: Final QC/QA Process:
This is the last process and comes when the client has ordered the study. In this process a final QA/QC is done before the study is emailed to the client. Since we believe in giving our clients a good experience of our research studies, therefore, to make sure that we do not lack at our end in any way humanly possible we do a final round of quality check and then dispatch the study to the client.
Key Segments:
By Type
a-Si
CdTe
CIGS
By Application
Electrical and Electronic
MEMS
Photovoltaic Solar cells
Semiconductors
Optical coating
Other
Request for Segment Customization as per your Business Requirement: Segment Customization Request
Regional Coverage:
North America
US
Canada
Mexico
Europe
Eastern Europe
Poland
Romania
Hungary
Turkey
Rest of Eastern Europe
Western Europe
Germany
France
UK
Italy
Spain
Netherlands
Switzerland
Austria
Rest of Western Europe
Asia Pacific
China
India
Japan
South Korea
Vietnam
Singapore
Australia
Rest of Asia Pacific
Middle East & Africa
Middle East
UAE
Egypt
Saudi Arabia
Qatar
Rest of Middle East
Africa
Nigeria
South Africa
Rest of Africa
Latin America
Brazil
Argentina
Colombia
Rest of Latin America
Request for Country Level Research Report: Country Level Customization Request
Available Customization
With the given market data, SNS Insider offers customization as per the company’s specific needs. The following customization options are available for the report:
Product Analysis
Criss-Cross segment analysis (e.g. Product X Application)
Product Matrix which gives a detailed comparison of product portfolio of each company
Geographic Analysis
Additional countries in any of the regions
Company Information
Detailed analysis and profiling of additional market players (Up to five)
The Sustainable Apparel Market Size was valued at USD 11.20 billion in 2023 and will reach USD 24.53 billion by 2032, & grow at a CAGR of 9.1% by 2024-2032.
The Silane and Silicone Market size was USD 19.9 billion in 2023 and is expected to reach USD 32.4 billion by 2032 and grow at a CAGR of 5.5% over the forecast period of 2024-2032.
The Industrial Batteries Market was valued at USD 20.12 billion in 2023 and is expected to reach USD 46.15 Billion by 2032, growing at a CAGR of 9.69 % over the forecast period 2024-2032.
The Thermoplastic Polyurethane (TPU) Market was valued at USD 2.91 billion in 2023 and is expected to reach USD 5.74 Billion by 2032, growing at a CAGR of 7.87% from 2024-2032.
Succinic Acid Market was valued at USD 216.3 Million in 2023 and is expected to grow to USD 466.7 Million by 2032, growing at a CAGR of 5.4% from 2024-2032.
Battery Metals Market size was USD 10.6 Billion in 2023 and is expected to reach USD 21.3 Billion by 2032 and grow at a CAGR of 8.1% from 2024-2032.

Hi! Click one of our member below to chat on Phone
© 2025 All Rights Reserved by SNS Insider Pvt Ltd


