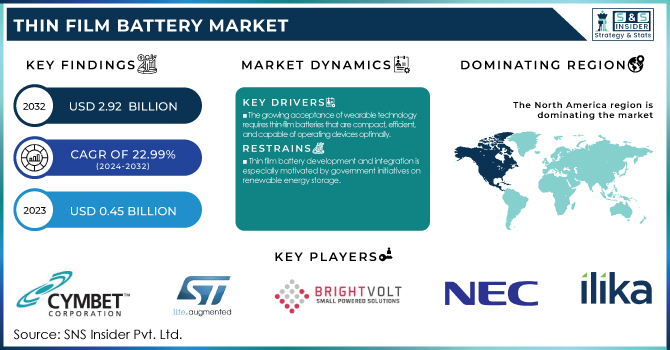
The Thin Film Battery Market Size was valued at USD 0.45 Billion in 2023 and is expected to reach USD 2.92 Billion by 2032 and grow at a CAGR of 22.99% over the forecast period 2024-2032.
The Thin Film Battery Market is witnessing enormous growth in 2023 and 2024, most of this growth is seen in the United States. Since the start of September 2024, the United States Department of Energy has allocated more than USD 3 billion to more than 25 battery manufacturing projects across 14 states. This effort is supported under the Bipartisan Infrastructure Law to accelerate domestic production of batteries, including critical mineral processing, battery manufacturing, and recycling endeavours. The selected projects are expected to create jobs primarily in construction, while also enhancing the nation’s ability to manufacturer EV battery and renewable energy storage. This market scenario is majorly determined by government policies.
To get more information on Thin Film Battery Market - Request Free Sample Report
The US administration is looking forward to establishing federal support to balance the prices of U.S. critical minerals by tackling the issue of cheap Chinese materials flooding the market. The Energy Department will set a price floor for several key minerals, and if the market price falls below this threshold, it will be covering that gap. In response to China’s dominance in the market, this plan would subsidize the domestic mineral production necessary to run clean energy technologies, including electric vehicles.
Innovations in thin film battery production, recovery of critical minerals, battery production and recycling have been at the forefront of the growth of the Thin Film Battery Market. The projects include are therefore anticipated to create 12,000 jobs, primarily focused on construction. Some of the key projects that would receive assistance include standards lithium production for electric automotive use under a joint venture standard lithium and Equinor in Lewisville, Arkansas, to which USD 225 million in financing will be provided, and TerraVolta Resources' plans in Texarkana.
Growing applications for portable electronics, wearables, and IoT devices are leading to the growing requirement for power systems to be smaller and more efficient. Furthermore, market opportunities are supported through regulatory for sustainable energy technologies. In North America, the thin-film battery market accounts for the largest revenue share of the global market, and this is prompting companies to develop enough batteries in compliance with rigid environment and safety standards.
Key Drivers:
The growing acceptance of wearable technology requires thin-film batteries that are compact, efficient, and capable of operating devices optimally.
The high demand for power sources for wearables such as smartwatches, fitness monitors, and health monitoring devices can be attributed to the proliferation of wearable technology. Thin-film batteries are most suitable for this application because of their lightness, flexibility, and compact size, which facilitates easy integration with small devices without adding bulk to them.
The high energy density makes it possible for wearables to work over an extended time, with low rates of frequent recharging to facilitate convenience among the users. Besides, flexible thin film batteries support novel geometries of innovative device designs. Consequently, increased interest in wearables from the consumer market propels the growing dependency on thin film batteries while, in return, pushing up battery technology as demand increases over device evolution.
Thin film battery development and integration is especially motivated by government initiatives on renewable energy storage.
Given the normalized, and more actively implemented, policies of central governments across the world focused on support of renewable energy storage, suppliers and efforts to move towards net neutral carbon emissions, thin film batteries are particularly critical due to anticipated utilizations in energy storage systems. For instance, in 2024, the US Department of Energy have budgeted over USD 25 billion into 11 battery projects, underscoring the focus on advancing multiple battery technologies, with thin films among them, to ensure the development and current operation of renewable energy infrastructures. Government programs and project funding are not only important methods of actual financial backing but also create a positive environment for thin film battery technology research and development. The installation of the battery in renewable energy systems further fuel the growth and innovation of the automation in the thin film battery market.
Restrain:
The production process of thin-film batteries is highly technical and requires special materials, making it more expensive than traditional batteries.
This difference in cost can be a limiting factor for the widespread adoption of thin-film batteries, particularly in price-sensitive markets. Besides that, scalability of production is a challenge so far, as economies of scale are hard to obtain because of the highly complicated processes of manufacturing involved. These factors give rise to a more substantial cost structure for thin-film batteries, making them less competitive in the wider market of batteries. Such factors require a solution if the affordability and accessibility of thin-film batteries are to be improved across different applications.
By Battery Type
The Thin Film Battery Market was dominated, in 2023, by the rechargeable segment, with a share of 65%. The reason behind this predominant position is the heavy adoption of rechargeable thin-film batteries in consumer electronics, medical devices, and wearable technologies, where compactness, low weight, and prolonged energy access are major concerns. These batteries can be recharged to meet the increasing consumer needs for an energy source that is both environmentally friendly and economical. In addition to this, improvements in battery technology have also resulted in higher energy densities and longer lifecycles, making the rechargeable thin film battery even more attractive.
On the other hand, the disposable segment, though smaller in terms of market share at present, is expected to grow the fastest during the forecast period from 2024 to 2032, with a CAGR of 23.61%. This is due to the increasing use of disposable thin film batteries in single-use medical devices, smart packaging, and environmental sensors.
Disposable batteries are most suited for applications where battery replacement is difficult or the devices are designed to be operated with limited service life. As thin film batteries continue gaining in scale and new applications have just begun to emerge across various industries, the scope of growth for both the rechargeable and disposable segments is most likely going to come into play.
By Battery Voltage
In 2023, the below 1.5 V segment accounted for 45% of the total market share. This is because the segment has wide applications in low-power devices such as medical implants, RFID tags, and some wearable technologies where minimum voltage is adequate for proper functionality. Below 1.5 V thin film batteries are best suited for such applications due to their compact size and flexibility.
Moving forward the above 3 V segment will be expected to grow with a fastest CAGR of 23.54% during the fore-term period from 2024 to 2032. This is because there is an increasing number of high voltage battery applications that have these high voltage output powers. Such cases include energy harvesting devices, wireless sensors, and advanced medical equipment.
The development of high-voltage thin film batteries enables the expansion of their use into more energy-intensive applications, broadening the scope of the market. As technologies continue to evolve, the growth of voltage-specific applications is anticipated to drive growth across all the voltage segments of the Thin Film Battery Market.
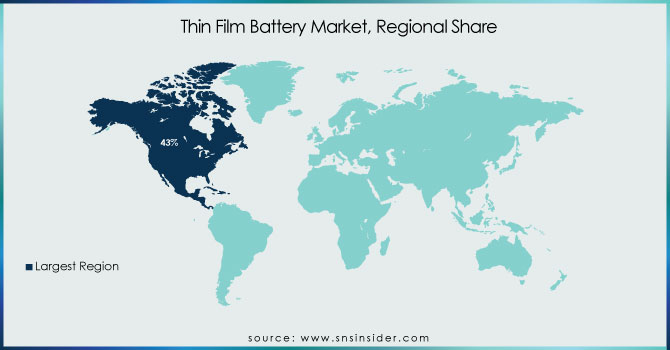
North America held the majority of the market share in 2023 at 43%. The region is supported by its advanced technological infrastructure, substantial investment in research and development, and an early adaptation of advanced technologies across industries like healthcare, consumer electronics, and renewable energy. Major market players along with the high emphasis on innovation support the position of North America in the market.
On the other hand, the Asia Pacific region is expected to grow at the fastest rate, with a CAGR of 23.75% during the forecast period from 2024 to 2032. This rapid growth is attributed to the rapidly growing electronics manufacturing sector, increasing adoption of electric vehicles, and supportive government initiatives promoting renewable energy solutions in countries like China, Japan, and India.
The Production Linked Incentive (PLI) Scheme for Advanced Chemistry Cells (ACC) was unveiled by the government of India in 2023, with ₹18,100 crore allocated to the scheme for five years with an aim of increasing domestic manufacturing, reducing reliance on imports, and supporting advancement in battery technology. Along with this, the Viability Gap Funding under the Union Budget 2023-24 has provided ₹3,760 crore for setting up 4,000 MWh of battery energy storage systems. It has prompted the manufacturers to undertake large-scale projects.
Get Customized Report as per Your Business Requirement - Enquiry Now
Some of the Major Players in the Thin Film Battery Market Are
Cymbet Corporation (EnerChip rechargeable batteries, EnerChip RTC)
STMicroelectronics (Thin-Film Battery Solutions, Energy Harvesting Modules)
Excellatron Solid State, LLC (Thin Film Rechargeable Batteries, Solid State Battery Technology)
Blue Spark Technologies (Thin Film Batteries, Printed Electronics)
BrightVolt (Flexion Flexible Batteries, Custom Battery Solutions)
Enfucell Oy (SoftBattery, Printed Power Solutions)
Imprint Energy (ZincPoly Batteries, Flexible Printed Batteries)
Ilika plc (Stereax Solid State Batteries, Battery Technology Licensing)
ProLogium Technology Co., Ltd. (Solid-State Lithium Ceramic Batteries, Automotive Battery Solutions)
Front Edge Technology, Inc. (NanoEnergy Thin Film Batteries, Custom Energy Storage Solutions)
Jenax Inc. (J.Flex Flexible Batteries, Wearable Power Solutions)
NEC Corporation (Organic Radical Battery, Energy Storage Systems)
Panasonic Corporation (Rechargeable Batteries, Energy Storage Solutions)
Samsung SDI Co., Ltd. (Thin-Film Battery Modules, Energy Storage Products)
LG Energy Solution (Battery Solutions for IoT, Thin Film Flexible Batteries)
Solid Power, Inc. (Solid-State Batteries, Energy-Dense Storage Solutions)
QuantumScape Corporation (Next-Gen Thin Film Batteries, Solid-State Battery Systems)
Murata Manufacturing Co., Ltd. (Micro Batteries, Flexible Power Solutions)
Seiko Instruments Inc. (Thin Film Rechargeable Batteries, Energy Solutions)
Toshiba Corporation (Energy Storage Systems, Compact Battery Modules)
Major Suppliers (Components, Technologies)
BASF (Battery Electrolytes, Specialty Chemicals)
Asahi Kasei Corporation (Separator Materials, Battery Components)
Umicore (Active Cathode Materials, Battery Raw Materials)
Toray Industries (Battery Separator Films, Composite Materials)
3M (Conductive Tapes, Bonding Solutions)
Hitachi Chemicals (Electrolytes, Battery Solutions)
DuPont (Protective Films, Battery-Grade Polymers)
Sumitomo Chemical (High-Performance Battery Chemicals)
Mitsubishi Chemical (Battery Binders, Conductive Additives)
SK Innovation (High-Performance Electrolytes, Battery Materials)
Major Clients
Apple Inc.
Samsung Electronics
Tesla, Inc.
Medtronic
Fitbit (Google)
Sony Corporation
Hewlett-Packard (HP)
Intel Corporation
Garmin Ltd.
Siemens AG
July 2024: UK-based solid-state battery developer Ilika has already shipped its initial batch of Goliath battery prototypes to Tier 1 automobile company customers, which will take the prototype battery for testing at their facilities. The company test the P1 Goliath prototype batteries here in-house in a customer sponsored program since last May. Unlike liquid electrolytes, Goliath batteries utilise a ceramic type and are backed by a silicon anode combined with an oxide solid electrolyte. This, according to Ilika, could mean lighter vehicles, faster charging, and longer range, going along with the batteries' higher cell-to-pack ratio.
May 2024: Arkema has been chosen by ProLogium, a Taiwanese technology leader in advanced batteries, as a key development and supply partner ahead of the launch of its gigafactory in France. The collaboration begun in 2010, by Arkema and ProLogium, reached its new peak at an LOI (letter of intent) exchange ceremony held in Paris, marking the intent by ProLogium to build a state-of-the-art R&D laboratory in France, host of Arkema's flagship Battery Center of Excellence. This one further demonstrates one time again how capable Arkema is of working with the leaders of the batteries of tomorrow to develop more efficient, safer, and more sustainable ones, utilizing their large suite of technologies.
| Report Attributes | Details |
|---|---|
| Market Size in 2023 | USD 0.45 Billion |
| Market Size by 2032 | USD 2.92 Billion |
| CAGR | CAGR of 22.99% From 2024 to 2032 |
| Base Year | 2023 |
| Forecast Period | 2024-2032 |
| Historical Data | 2020-2022 |
| Report Scope & Coverage | Market Size, Segments Analysis, Competitive Landscape, Regional Analysis, DROC & SWOT Analysis, Forecast Outlook |
| Key Segments | • By Voltage (Below 1.5V, 1.5 V to 3V, Above 3V), • By Battery Type (Disposable, Rechargeable), • By Application (Consumer Electronics, Medical Devices, Wearable Technology, Smart Cards, RFID, and Others) |
| Regional Analysis/Coverage | North America (US, Canada, Mexico), Europe (Eastern Europe [Poland, Romania, Hungary, Turkey, Rest of Eastern Europe] Western Europe] Germany, France, UK, Italy, Spain, Netherlands, Switzerland, Austria, Rest of Western Europe]), Asia Pacific (China, India, Japan, South Korea, Vietnam, Singapore, Australia, Rest of Asia Pacific), Middle East & Africa (Middle East [UAE, Egypt, Saudi Arabia, Qatar, Rest of Middle East], Africa [Nigeria, South Africa, Rest of Africa], Latin America (Brazil, Argentina, Colombia, Rest of Latin America) |
| Company Profiles | Cymbet Corporation, STMicroelectronics, Excellatron Solid State LLC, Blue Spark Technologies, BrightVolt, Enfucell Oy, Imprint Energy, Ilika plc, ProLogium Technology Co., Ltd., Front Edge Technology Inc., Jenax Inc., NEC Corporation, Panasonic Corporation, Samsung SDI Co., Ltd., LG Energy Solution, Solid Power Inc., QuantumScape Corporation, Murata Manufacturing Co., Ltd., Seiko Instruments Inc., Toshiba Corporation. |
| Key Drivers | • The growing acceptance of wearable technology requires thin-film batteries that are compact, efficient, and capable of operating devices optimally. • Thin film battery development and integration is especially motivated by government initiatives on renewable energy storage. |
| Restraints | • The production process of thin-film batteries is highly technical and requires special materials, making it more expensive than traditional batteries. |
Ans: The Thin Film Battery Market is expected to grow at a CAGR of 22.99% during 2024-2032.
Ans: Thin Film Battery Market size was USD 0.45 Billion in 2023 and is expected to Reach USD 2.92 Billion by 2032.
Ans: The major growth factors of the Thin Film Battery Market is growing acceptance of wearable technology.
Ans: The rechargeable segment dominated the Thin Film Battery Market.
Ans: North America dominated the Thin Film Battery Market in 2023.
1. Introduction
1.1 Market Definition
1.2 Scope (Inclusion and Exclusions)
1.3 Research Assumptions
2. Executive Summary
2.1 Market Overview
2.2 Regional Synopsis
2.3 Competitive Summary
3. Research Methodology
3.1 Top-Down Approach
3.2 Bottom-up Approach
3.3. Data Validation
3.4 Primary Interviews
4. Market Dynamics Impact Analysis
4.1 Market Driving Factors Analysis
4.1.1 Drivers
4.1.2 Restraints
4.2 PESTLE Analysis
4.3 Porter’s Five Forces Model
5. Statistical Insights and Trends Reporting
5.1 Key Vendors and Feature Analysis, 2023
5.2 Performance Benchmarks, 2023
5.3 Integration Capabilities
5.4 Usage Statistics, 2023
6. Competitive Landscape
6.1 List of Major Companies, By Region
6.2 Market Share Analysis, By Region
6.3 Product Benchmarking
6.3.1 Product specifications and features
6.3.2 Pricing
6.4 Strategic Initiatives
6.4.1 Marketing and promotional activities
6.4.2 Distribution and Supply Chain Strategies
6.4.3 Expansion plans and new product launches
6.4.4 Strategic partnerships and collaborations
6.5 Technological Advancements
6.6 Market Positioning and Branding
7. Thin Film Battery Market Segmentation, By Voltage
7.1 Chapter Overview
7.2 Below 1.5V
7.2.1 Below 1.5V Market Trends Analysis (2020-2032)
7.2.2 Below 1.5V Market Size Estimates and Forecasts to 2032 (USD Billion)
7.3 1.5 V to 3V
7.3.1 1.5 V to 3V Market Trends Analysis (2020-2032)
7.3.2 1.5 V to 3V Market Size Estimates and Forecasts to 2032 (USD Billion)
7.4 Above 3V
7.4.1 Above 3V Market Trends Analysis (2020-2032)
7.4.2 Above 3V Market Size Estimates and Forecasts to 2032 (USD Billion)
8. Thin Film Battery Market Segmentation, By Battery Type
8.1 Chapter Overview
8.2 Disposable
8.2.1 Disposable Market Trends Analysis (2020-2032)
8.2.2 Disposable Market Size Estimates and Forecasts to 2032 (USD Billion)
8.3 Rechargeable
8.3.1 Rechargeable Market Trends Analysis (2020-2032)
8.3.2 Rechargeable Market Size Estimates and Forecasts to 2032 (USD Billion)
9. Thin Film Battery Market Segmentation, By Application
9.1 Chapter Overview
9.2 Consumer Electronics
9.2.1 Consumer Electronics Market Trends Analysis (2020-2032)
9.2.2 Consumer Electronics Market Size Estimates and Forecasts to 2032 (USD Billion)
9.3 Medical Devices
9.3.1 Medical Devices Market Trends Analysis (2020-2032)
9.3.2 Medical Devices Market Size Estimates and Forecasts to 2032 (USD Billion)
9.4 Wearable Technology
9.4.1 Wearable Technology Market Trends Analysis (2020-2032)
9.4.2 Wearable Technology Market Size Estimates and Forecasts to 2032 (USD Billion)
9.5 Smart Cards
9.5.1 Smart Cards Market Trends Analysis (2020-2032)
9.5.2 Smart Cards Market Size Estimates and Forecasts to 2032 (USD Billion)
9.6 RFID
9.6.1 RFID Market Trends Analysis (2020-2032)
9.6.2 RFID Market Size Estimates and Forecasts to 2032 (USD Billion)
9.7 Others
9.7.1 Others Market Trends Analysis (2020-2032)
9.7.2 Others Market Size Estimates And Forecasts To 2032 (USD Billion)
10. Regional Analysis
10.1 Chapter Overview
10.2 North America
10.2.1 Trends Analysis
10.2.2 North America Thin Film Battery Market Estimates and Forecasts, by Country (2020-2032) (USD Billion)
10.2.3 North America Thin Film Battery Market Estimates and Forecasts, By Application (2020-2032) (USD Billion)
10.2.4 North America Thin Film Battery Market Estimates and Forecasts, By Voltage (2020-2032) (USD Billion)
10.2.5 North America Thin Film Battery Market Estimates and Forecasts, By Battery Type (2020-2032) (USD Billion)
10.2.6 USA
10.2.6.1 USA Thin Film Battery Market Estimates and Forecasts, By Application (2020-2032) (USD Billion)
10.2.6.2 USA Thin Film Battery Market Estimates and Forecasts, By Voltage (2020-2032) (USD Billion)
10.2.6.3 USA Thin Film Battery Market Estimates and Forecasts, By Battery Type (2020-2032) (USD Billion)
10.2.7 Canada
10.2.7.1 Canada Thin Film Battery Market Estimates and Forecasts, By Application (2020-2032) (USD Billion)
10.2.7.2 Canada Thin Film Battery Market Estimates and Forecasts, By Voltage (2020-2032) (USD Billion)
10.2.7.3 Canada Thin Film Battery Market Estimates and Forecasts, By Battery Type (2020-2032) (USD Billion)
10.2.8 Mexico
10.2.8.1 Mexico Thin Film Battery Market Estimates and Forecasts, By Application (2020-2032) (USD Billion)
10.2.8.2 Mexico Thin Film Battery Market Estimates and Forecasts, By Voltage (2020-2032) (USD Billion)
10.2.8.3 Mexico Thin Film Battery Market Estimates and Forecasts, By Battery Type (2020-2032) (USD Billion)
10.3 Europe
10.3.1 Eastern Europe
10.3.1.1 Trends Analysis
10.3.1.2 Eastern Europe Thin Film Battery Market Estimates and Forecasts, by Country (2020-2032) (USD Billion)
10.3.1.3 Eastern Europe Thin Film Battery Market Estimates and Forecasts, By Application (2020-2032) (USD Billion)
10.3.1.4 Eastern Europe Thin Film Battery Market Estimates and Forecasts, By Voltage (2020-2032) (USD Billion)
10.3.1.5 Eastern Europe Thin Film Battery Market Estimates and Forecasts, By Battery Type (2020-2032) (USD Billion)
10.3.1.6 Poland
10.3.1.6.1 Poland Thin Film Battery Market Estimates and Forecasts, By Application (2020-2032) (USD Billion)
10.3.1.6.2 Poland Thin Film Battery Market Estimates and Forecasts, By Voltage (2020-2032) (USD Billion)
10.3.1.6.3 Poland Thin Film Battery Market Estimates and Forecasts, By Battery Type (2020-2032) (USD Billion)
10.3.1.7 Romania
10.3.1.7.1 Romania Thin Film Battery Market Estimates and Forecasts, By Application (2020-2032) (USD Billion)
10.3.1.7.2 Romania Thin Film Battery Market Estimates and Forecasts, By Voltage (2020-2032) (USD Billion)
10.3.1.7.3 Romania Thin Film Battery Market Estimates and Forecasts, By Battery Type (2020-2032) (USD Billion)
10.3.1.8 Hungary
10.3.1.8.1 Hungary Thin Film Battery Market Estimates and Forecasts, By Application (2020-2032) (USD Billion)
10.3.1.8.2 Hungary Thin Film Battery Market Estimates and Forecasts, By Voltage (2020-2032) (USD Billion)
10.3.1.8.3 Hungary Thin Film Battery Market Estimates and Forecasts, By Battery Type (2020-2032) (USD Billion)
10.3.1.9 Turkey
10.3.1.9.1 Turkey Thin Film Battery Market Estimates and Forecasts, By Application (2020-2032) (USD Billion)
10.3.1.9.2 Turkey Thin Film Battery Market Estimates and Forecasts, By Voltage (2020-2032) (USD Billion)
10.3.1.9.3 Turkey Thin Film Battery Market Estimates and Forecasts, By Battery Type (2020-2032) (USD Billion)
10.3.1.10 Rest of Eastern Europe
10.3.1.10.1 Rest of Eastern Europe Thin Film Battery Market Estimates and Forecasts, By Application (2020-2032) (USD Billion)
10.3.1.10.2 Rest of Eastern Europe Thin Film Battery Market Estimates and Forecasts, By Voltage (2020-2032) (USD Billion)
10.3.1.10.3 Rest of Eastern Europe Thin Film Battery Market Estimates and Forecasts, By Battery Type (2020-2032) (USD Billion)
10.3.2 Western Europe
10.3.2.1 Trends Analysis
10.3.2.2 Western Europe Thin Film Battery Market Estimates and Forecasts, by Country (2020-2032) (USD Billion)
10.3.2.3 Western Europe Thin Film Battery Market Estimates and Forecasts, By Application (2020-2032) (USD Billion)
10.3.2.4 Western Europe Thin Film Battery Market Estimates and Forecasts, By Voltage (2020-2032) (USD Billion)
10.3.2.5 Western Europe Thin Film Battery Market Estimates and Forecasts, By Battery Type (2020-2032) (USD Billion)
10.3.2.6 Germany
10.3.2.6.1 Germany Thin Film Battery Market Estimates and Forecasts, By Application (2020-2032) (USD Billion)
10.3.2.6.2 Germany Thin Film Battery Market Estimates and Forecasts, By Voltage (2020-2032) (USD Billion)
10.3.2.6.3 Germany Thin Film Battery Market Estimates and Forecasts, By Battery Type (2020-2032) (USD Billion)
10.3.2.7 France
10.3.2.7.1 France Thin Film Battery Market Estimates and Forecasts, By Application (2020-2032) (USD Billion)
10.3.2.7.2 France Thin Film Battery Market Estimates and Forecasts, By Voltage (2020-2032) (USD Billion)
10.3.2.7.3 France Thin Film Battery Market Estimates and Forecasts, By Battery Type (2020-2032) (USD Billion)
10.3.2.8 UK
10.3.2.8.1 UK Thin Film Battery Market Estimates and Forecasts, By Application (2020-2032) (USD Billion)
10.3.2.8.2 UK Thin Film Battery Market Estimates and Forecasts, By Voltage (2020-2032) (USD Billion)
10.3.2.8.3 UK Thin Film Battery Market Estimates and Forecasts, By Battery Type (2020-2032) (USD Billion)
10.3.2.9 Italy
10.3.2.9.1 Italy Thin Film Battery Market Estimates and Forecasts, By Application (2020-2032) (USD Billion)
10.3.2.9.2 Italy Thin Film Battery Market Estimates and Forecasts, By Voltage (2020-2032) (USD Billion)
10.3.2.9.3 Italy Thin Film Battery Market Estimates and Forecasts, By Battery Type (2020-2032) (USD Billion)
10.3.2.10 Spain
10.3.2.10.1 Spain Thin Film Battery Market Estimates and Forecasts, By Application (2020-2032) (USD Billion)
10.3.2.10.2 Spain Thin Film Battery Market Estimates and Forecasts, By Voltage (2020-2032) (USD Billion)
10.3.2.10.3 Spain Thin Film Battery Market Estimates and Forecasts, By Battery Type (2020-2032) (USD Billion)
10.3.2.11 Netherlands
10.3.2.11.1 Netherlands Thin Film Battery Market Estimates and Forecasts, By Application (2020-2032) (USD Billion)
10.3.2.11.2 Netherlands Thin Film Battery Market Estimates and Forecasts, By Voltage (2020-2032) (USD Billion)
10.3.2.11.3 Netherlands Thin Film Battery Market Estimates and Forecasts, By Battery Type (2020-2032) (USD Billion)
10.3.2.12 Switzerland
10.3.2.12.1 Switzerland Thin Film Battery Market Estimates and Forecasts, By Application (2020-2032) (USD Billion)
10.3.2.12.2 Switzerland Thin Film Battery Market Estimates and Forecasts, By Voltage (2020-2032) (USD Billion)
10.3.2.12.3 Switzerland Thin Film Battery Market Estimates and Forecasts, By Battery Type (2020-2032) (USD Billion)
10.3.2.13 Austria
10.3.2.13.1 Austria Thin Film Battery Market Estimates and Forecasts, By Application (2020-2032) (USD Billion)
10.3.2.13.2 Austria Thin Film Battery Market Estimates and Forecasts, By Voltage (2020-2032) (USD Billion)
10.3.2.13.3 Austria Thin Film Battery Market Estimates and Forecasts, By Battery Type (2020-2032) (USD Billion)
10.3.2.14 Rest of Western Europe
10.3.2.14.1 Rest of Western Europe Thin Film Battery Market Estimates and Forecasts, By Application (2020-2032) (USD Billion)
10.3.2.14.2 Rest of Western Europe Thin Film Battery Market Estimates and Forecasts, By Voltage (2020-2032) (USD Billion)
10.3.2.14.3 Rest of Western Europe Thin Film Battery Market Estimates and Forecasts, By Battery Type (2020-2032) (USD Billion)
10.4 Asia Pacific
10.4.1 Trends Analysis
10.4.2 Asia Pacific Thin Film Battery Market Estimates and Forecasts, by Country (2020-2032) (USD Billion)
10.4.3 Asia Pacific Thin Film Battery Market Estimates and Forecasts, By Application (2020-2032) (USD Billion)
10.4.4 Asia Pacific Thin Film Battery Market Estimates and Forecasts, By Voltage (2020-2032) (USD Billion)
10.4.5 Asia Pacific Thin Film Battery Market Estimates and Forecasts, By Battery Type (2020-2032) (USD Billion)
10.4.6 China
10.4.6.1 China Thin Film Battery Market Estimates and Forecasts, By Application (2020-2032) (USD Billion)
10.4.6.2 China Thin Film Battery Market Estimates and Forecasts, By Voltage (2020-2032) (USD Billion)
10.4.6.3 China Thin Film Battery Market Estimates and Forecasts, By Battery Type (2020-2032) (USD Billion)
10.4.7 India
10.4.7.1 India Thin Film Battery Market Estimates and Forecasts, By Application (2020-2032) (USD Billion)
10.4.7.2 India Thin Film Battery Market Estimates and Forecasts, By Voltage (2020-2032) (USD Billion)
10.4.7.3 India Thin Film Battery Market Estimates and Forecasts, By Battery Type (2020-2032) (USD Billion)
10.4.8 Japan
10.4.8.1 Japan Thin Film Battery Market Estimates and Forecasts, By Application (2020-2032) (USD Billion)
10.4.8.2 Japan Thin Film Battery Market Estimates and Forecasts, By Voltage (2020-2032) (USD Billion)
10.4.8.3 Japan Thin Film Battery Market Estimates and Forecasts, By Battery Type (2020-2032) (USD Billion)
10.4.9 South Korea
10.4.9.1 South Korea Thin Film Battery Market Estimates and Forecasts, By Application (2020-2032) (USD Billion)
10.4.9.2 South Korea Thin Film Battery Market Estimates and Forecasts, By Voltage (2020-2032) (USD Billion)
10.4.9.3 South Korea Thin Film Battery Market Estimates and Forecasts, By Battery Type (2020-2032) (USD Billion)
10.4.10 Vietnam
10.4.10.1 Vietnam Thin Film Battery Market Estimates and Forecasts, By Application (2020-2032) (USD Billion)
10.4.10.2 Vietnam Thin Film Battery Market Estimates and Forecasts, By Voltage (2020-2032) (USD Billion)
10.4.10.3 Vietnam Thin Film Battery Market Estimates and Forecasts, By Battery Type (2020-2032) (USD Billion)
10.4.11 Singapore
10.4.11.1 Singapore Thin Film Battery Market Estimates and Forecasts, By Application (2020-2032) (USD Billion)
10.4.11.2 Singapore Thin Film Battery Market Estimates and Forecasts, By Voltage (2020-2032) (USD Billion)
10.4.11.3 Singapore Thin Film Battery Market Estimates and Forecasts, By Battery Type (2020-2032) (USD Billion)
10.4.12 Australia
10.4.12.1 Australia Thin Film Battery Market Estimates and Forecasts, By Application (2020-2032) (USD Billion)
10.4.12.2 Australia Thin Film Battery Market Estimates and Forecasts, By Voltage (2020-2032) (USD Billion)
10.4.12.3 Australia Thin Film Battery Market Estimates and Forecasts, By Battery Type (2020-2032) (USD Billion)
10.4.13 Rest of Asia Pacific
10.4.13.1 Rest of Asia Pacific Thin Film Battery Market Estimates and Forecasts, By Application (2020-2032) (USD Billion)
10.4.13.2 Rest of Asia Pacific Thin Film Battery Market Estimates and Forecasts, By Voltage (2020-2032) (USD Billion)
10.4.13.3 Rest of Asia Pacific Thin Film Battery Market Estimates and Forecasts, By Battery Type (2020-2032) (USD Billion)
10.5 Middle East and Africa
10.5.1 Middle East
10.5.1.1 Trends Analysis
10.5.1.2 Middle East Thin Film Battery Market Estimates and Forecasts, by Country (2020-2032) (USD Billion)
10.5.1.3 Middle East Thin Film Battery Market Estimates and Forecasts, By Application (2020-2032) (USD Billion)
10.5.1.4 Middle East Thin Film Battery Market Estimates and Forecasts, By Voltage (2020-2032) (USD Billion)
10.5.1.5 Middle East Thin Film Battery Market Estimates and Forecasts, By Battery Type (2020-2032) (USD Billion)
10.5.1.6 UAE
10.5.1.6.1 UAE Thin Film Battery Market Estimates and Forecasts, By Application (2020-2032) (USD Billion)
10.5.1.6.2 UAE Thin Film Battery Market Estimates and Forecasts, By Voltage (2020-2032) (USD Billion)
10.5.1.6.3 UAE Thin Film Battery Market Estimates and Forecasts, By Battery Type (2020-2032) (USD Billion)
10.5.1.7 Egypt
10.5.1.7.1 Egypt Thin Film Battery Market Estimates and Forecasts, By Application (2020-2032) (USD Billion)
10.5.1.7.2 Egypt Thin Film Battery Market Estimates and Forecasts, By Voltage (2020-2032) (USD Billion)
10.5.1.7.3 Egypt Thin Film Battery Market Estimates and Forecasts, By Battery Type (2020-2032) (USD Billion)
10.5.1.8 Saudi Arabia
10.5.1.8.1 Saudi Arabia Thin Film Battery Market Estimates and Forecasts, By Application (2020-2032) (USD Billion)
10.5.1.8.2 Saudi Arabia Thin Film Battery Market Estimates and Forecasts, By Voltage (2020-2032) (USD Billion)
10.5.1.8.3 Saudi Arabia Thin Film Battery Market Estimates and Forecasts, By Battery Type (2020-2032) (USD Billion)
10.5.1.9 Qatar
10.5.1.9.1 Qatar Thin Film Battery Market Estimates and Forecasts, By Application (2020-2032) (USD Billion)
10.5.1.9.2 Qatar Thin Film Battery Market Estimates and Forecasts, By Voltage (2020-2032) (USD Billion)
10.5.1.9.3 Qatar Thin Film Battery Market Estimates and Forecasts, By Battery Type (2020-2032) (USD Billion)
10.5.1.10 Rest of Middle East
10.5.1.10.1 Rest of Middle East Thin Film Battery Market Estimates and Forecasts, By Application (2020-2032) (USD Billion)
10.5.1.10.2 Rest of Middle East Thin Film Battery Market Estimates and Forecasts, By Voltage (2020-2032) (USD Billion)
10.5.1.10.3 Rest of Middle East Thin Film Battery Market Estimates and Forecasts, By Battery Type (2020-2032) (USD Billion)
10.5.2 Africa
10.5.2.1 Trends Analysis
10.5.2.2 Africa Thin Film Battery Market Estimates and Forecasts, by Country (2020-2032) (USD Billion)
10.5.2.3 Africa Thin Film Battery Market Estimates and Forecasts, By Application (2020-2032) (USD Billion)
10.5.2.4 Africa Thin Film Battery Market Estimates and Forecasts, By Voltage (2020-2032) (USD Billion)
10.5.2.5 Africa Thin Film Battery Market Estimates and Forecasts, By Battery Type (2020-2032) (USD Billion)
10.5.2.6 South Africa
10.5.2.6.1 South Africa Thin Film Battery Market Estimates and Forecasts, By Application (2020-2032) (USD Billion)
10.5.2.6.2 South Africa Thin Film Battery Market Estimates and Forecasts, By Voltage (2020-2032) (USD Billion)
10.5.2.6.3 South Africa Thin Film Battery Market Estimates and Forecasts, By Battery Type (2020-2032) (USD Billion)
10.5.2.7 Nigeria
10.5.2.7.1 Nigeria Thin Film Battery Market Estimates and Forecasts, By Application (2020-2032) (USD Billion)
10.5.2.7.2 Nigeria Thin Film Battery Market Estimates and Forecasts, By Voltage (2020-2032) (USD Billion)
10.5.2.7.3 Nigeria Thin Film Battery Market Estimates and Forecasts, By Battery Type (2020-2032) (USD Billion)
10.5.2.8 Rest of Africa
10.5.2.8.1 Rest of Africa Thin Film Battery Market Estimates and Forecasts, By Application (2020-2032) (USD Billion)
10.5.2.8.2 Rest of Africa Thin Film Battery Market Estimates and Forecasts, By Voltage (2020-2032) (USD Billion)
10.5.2.8.3 Rest of Africa Thin Film Battery Market Estimates and Forecasts, By Battery Type (2020-2032) (USD Billion)
10.6 Latin America
10.6.1 Trends Analysis
10.6.2 Latin America Thin Film Battery Market Estimates and Forecasts, by Country (2020-2032) (USD Billion)
10.6.3 Latin America Thin Film Battery Market Estimates and Forecasts, By Application (2020-2032) (USD Billion)
10.6.4 Latin America Thin Film Battery Market Estimates and Forecasts, By Voltage (2020-2032) (USD Billion)
10.6.5 Latin America Thin Film Battery Market Estimates and Forecasts, By Battery Type (2020-2032) (USD Billion)
10.6.6 Brazil
10.6.6.1 Brazil Thin Film Battery Market Estimates and Forecasts, By Application (2020-2032) (USD Billion)
10.6.6.2 Brazil Thin Film Battery Market Estimates and Forecasts, By Voltage (2020-2032) (USD Billion)
10.6.6.3 Brazil Thin Film Battery Market Estimates and Forecasts, By Battery Type (2020-2032) (USD Billion)
10.6.7 Argentina
10.6.7.1 Argentina Thin Film Battery Market Estimates and Forecasts, By Application (2020-2032) (USD Billion)
10.6.7.2 Argentina Thin Film Battery Market Estimates and Forecasts, By Voltage (2020-2032) (USD Billion)
10.6.7.3 Argentina Thin Film Battery Market Estimates and Forecasts, By Battery Type (2020-2032) (USD Billion)
10.6.8 Colombia
10.6.8.1 Colombia Thin Film Battery Market Estimates and Forecasts, By Application (2020-2032) (USD Billion)
10.6.8.2 Colombia Thin Film Battery Market Estimates and Forecasts, By Voltage (2020-2032) (USD Billion)
10.6.8.3 Colombia Thin Film Battery Market Estimates and Forecasts, By Battery Type (2020-2032) (USD Billion)
10.6.9 Rest of Latin America
10.6.9.1 Rest of Latin America Thin Film Battery Market Estimates and Forecasts, By Application (2020-2032) (USD Billion)
10.6.9.2 Rest of Latin America Thin Film Battery Market Estimates and Forecasts, By Voltage (2020-2032) (USD Billion)
10.6.9.3 Rest of Latin America Thin Film Battery Market Estimates and Forecasts, By Battery Type (2020-2032) (USD Billion)
11. Company Profiles
11.1 Cymbet Corporation
11.1.1 Company Overview
11.1.2 Financial
11.1.3 Products/ Services Offered
11.1.4 SWOT Analysis
11.2 STMicroelectronics
11.2.1 Company Overview
11.2.2 Financial
11.2.3 Products/ Services Offered
11.2.4 SWOT Analysis
11.3 Excellatron Solid State LLC
11.3.1 Company Overview
11.3.2 Financial
11.3.3 Products/ Services Offered
11.3.4 SWOT Analysis
11.4 Blue Spark Technologies
11.4.1 Company Overview
11.4.2 Financial
11.4.3 Products/ Services Offered
11.4.4 SWOT Analysis
11.5 BrightVolt
11.5.1 Company Overview
11.5.2 Financial
11.5.3 Products/ Services Offered
11.5.4 SWOT Analysis
11.6 Enfucell Oy
11.6.1 Company Overview
11.6.2 Financial
11.6.3 Products/ Services Offered
11.6.4 SWOT Analysis
11.7 Imprint Energy
11.7.1 Company Overview
11.7.2 Financial
11.7.3 Products/ Services Offered
11.7.4 SWOT Analysis
11.8 Ilika plc
11.8.1 Company Overview
11.8.2 Financial
11.8.3 Products/ Services Offered
11.8.4 SWOT Analysis
11.9 ProLogium Technology Co., Ltd.
11.9.1 Company Overview
11.9.2 Financial
11.9.3 Products/ Services Offered
11.9.4 SWOT Analysis
11.10 Front Edge Technology Inc.
11.10.1 Company Overview
11.10.2 Financial
11.10.3 Products/ Services Offered
11.10.4 SWOT Analysis
12. Use Cases and Best Practices
13. Conclusion
An accurate research report requires proper strategizing as well as implementation. There are multiple factors involved in the completion of good and accurate research report and selecting the best methodology to compete the research is the toughest part. Since the research reports we provide play a crucial role in any company’s decision-making process, therefore we at SNS Insider always believe that we should choose the best method which gives us results closer to reality. This allows us to reach at a stage wherein we can provide our clients best and accurate investment to output ratio.
Each report that we prepare takes a timeframe of 350-400 business hours for production. Starting from the selection of titles through a couple of in-depth brain storming session to the final QC process before uploading our titles on our website we dedicate around 350 working hours. The titles are selected based on their current market cap and the foreseen CAGR and growth.
The 5 steps process:
Step 1: Secondary Research:
Secondary Research or Desk Research is as the name suggests is a research process wherein, we collect data through the readily available information. In this process we use various paid and unpaid databases which our team has access to and gather data through the same. This includes examining of listed companies’ annual reports, Journals, SEC filling etc. Apart from this our team has access to various associations across the globe across different industries. Lastly, we have exchange relationships with various university as well as individual libraries.

Step 2: Primary Research
When we talk about primary research, it is a type of study in which the researchers collect relevant data samples directly, rather than relying on previously collected data. This type of research is focused on gaining content specific facts that can be sued to solve specific problems. Since the collected data is fresh and first hand therefore it makes the study more accurate and genuine.
We at SNS Insider have divided Primary Research into 2 parts.
Part 1 wherein we interview the KOLs of major players as well as the upcoming ones across various geographic regions. This allows us to have their view over the market scenario and acts as an important tool to come closer to the accurate market numbers. As many as 45 paid and unpaid primary interviews are taken from both the demand and supply side of the industry to make sure we land at an accurate judgement and analysis of the market.
This step involves the triangulation of data wherein our team analyses the interview transcripts, online survey responses and observation of on filed participants. The below mentioned chart should give a better understanding of the part 1 of the primary interview.

Part 2: In this part of primary research the data collected via secondary research and the part 1 of the primary research is validated with the interviews from individual consultants and subject matter experts.
Consultants are those set of people who have at least 12 years of experience and expertise within the industry whereas Subject Matter Experts are those with at least 15 years of experience behind their back within the same space. The data with the help of two main processes i.e., FGDs (Focused Group Discussions) and IDs (Individual Discussions). This gives us a 3rd party nonbiased primary view of the market scenario making it a more dependable one while collation of the data pointers.
Step 3: Data Bank Validation
Once all the information is collected via primary and secondary sources, we run that information for data validation. At our intelligence centre our research heads track a lot of information related to the market which includes the quarterly reports, the daily stock prices, and other relevant information. Our data bank server gets updated every fortnight and that is how the information which we collected using our primary and secondary information is revalidated in real time.

Step 4: QA/QC Process
After all the data collection and validation our team does a final level of quality check and quality assurance to get rid of any unwanted or undesired mistakes. This might include but not limited to getting rid of the any typos, duplication of numbers or missing of any important information. The people involved in this process include technical content writers, research heads and graphics people. Once this process is completed the title gets uploader on our platform for our clients to read it.
Step 5: Final QC/QA Process:
This is the last process and comes when the client has ordered the study. In this process a final QA/QC is done before the study is emailed to the client. Since we believe in giving our clients a good experience of our research studies, therefore, to make sure that we do not lack at our end in any way humanly possible we do a final round of quality check and then dispatch the study to the client.
BY VOLTAGE
Below 1.5V
1.5V to 3V
Above 3V
BY BATTERY TYPE
Disposable
Rechargeable
BY APPLICATION
Consumer Electronics
Medical Devices
Wearable Technology
Smart Cards
RFID
Others
Request for Segment Customization as per your Business Requirement: Segment Customization Request
REGIONAL COVERAGE:
North America
US
Canada
Mexico
Europe
Eastern Europe
Poland
Romania
Hungary
Turkey
Rest of Eastern Europe
Western Europe
Germany
France
UK
Italy
Spain
Netherlands
Switzerland
Austria
Rest of Western Europe
Asia Pacific
China
India
Japan
South Korea
Vietnam
Singapore
Australia
Rest of Asia Pacific
Middle East & Africa
Middle East
UAE
Egypt
Saudi Arabia
Qatar
Rest of the Middle East
Africa
Nigeria
South Africa
Rest of Africa
Latin America
Brazil
Argentina
Colombia
Rest of Latin America
Request for Country Level Research Report: Country Level Customization Request
Available Customization
With the given market data, SNS Insider offers customization as per the company’s specific needs. The following customization options are available for the report:
Product Analysis
Criss-Cross segment analysis (e.g. Product X Application)
Product Matrix which gives a detailed comparison of product portfolio of each company
Geographic Analysis
Additional countries in any of the regions
Company Information
Detailed analysis and profiling of additional market players (Up to five)
The Atomic Force Microscopy Market size is expected to be valued at USD 82.94 Billion in 2023. It is estimated to reach USD 146.18 Billion by 2032 with a growing CAGR of 6.5% over the forecast period 2024-2032.
Proximity Sensor Market Size was valued at USD 4.7 Billion in 2023 and is expected to reach USD 8.21 Billion by 2032 and grow at a CAGR of 6.4% over the forecast period 2024-2032.
The Smart Advertising Market Size was valued at USD 1.64 billion in 2023 and is expected to grow at a CAGR of 11.50% to reach USD 4.36 billion by 2032.
The InGaAs Photodiode Sensors Market Size was valued at USD 225 Million in 2023 and is expected to grow at 8.11% CAGR to reach USD 452.70 Million by 2032.
The Military Communication Market size was valued at USD 28.66 billion in 2023 and is expected to grow to USD 54.04 billion by 2032 and grow at a CAGR of 7.34% over the forecast period of 2024-2032.
The Optical Modulators Market size was valued at USD 5.12 Bn in 2023 and is expected to reach USD 21.13 Bn by 2032 and grow at a CAGR of 17.07% by 2024-2032

Hi! Click one of our member below to chat on Phone
© 2025 All Rights Reserved by SNS Insider Pvt Ltd


