Thin Film and Printed Battery Market Size Analysis:
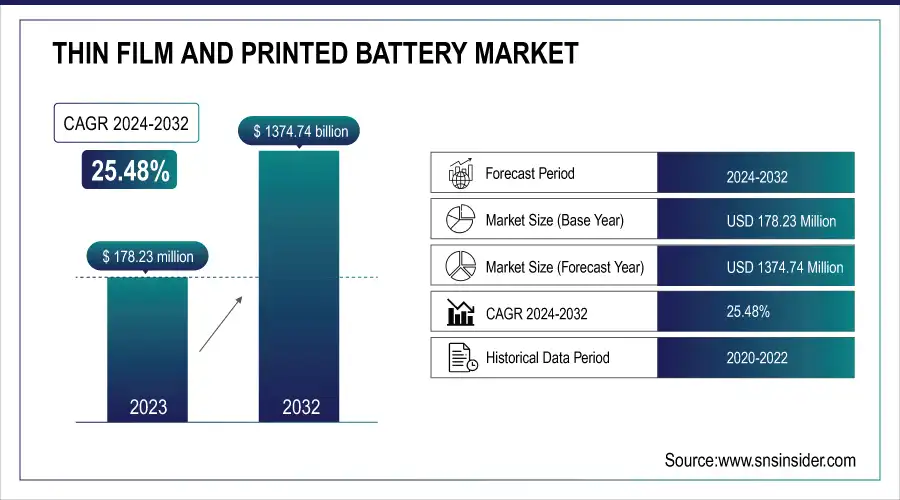
The Thin Film and Printed Battery Market was valued at 178.23 Million in 2023 and is projected to reach USD 1374.74 Million by 2032, growing at a CAGR of 25.48% from 2024 to 2032. Key drivers fueling this growth include the rising demand for ultra-compact, flexible energy storage solutions used in wearable electronics, smart packaging, medical devices, and wireless sensors.
To Get more information on Thin Film and Printed Battery Market - Request Free Sample Report
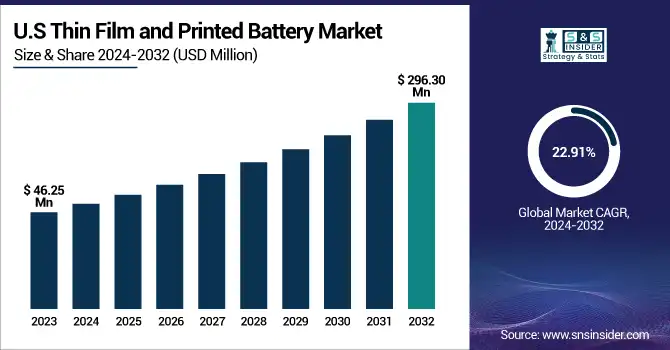
In the United States the market was valued at USD 46.25 million in 2023 and is expected to surge to USD 296.30 million by 2032, growing at a CAGR of 22.91%. The growing need for sustainable and lightweight batteries in IoT ecosystems further amplifies market momentum. Trends such as the increasing adoption rate of printed batteries, improvements in failure and degradation performance, and a higher flexible integration index are shaping the technological evolution of the industry. Additionally, fluctuations in raw material costs like lithium and conductive inks play a crucial role in production scalability and pricing strategies, influencing manufacturer competitiveness across global and regional markets.
Thin Film and Printed Battery Market Dynamics:
Drivers:
-
Revolutionizing Energy Storage Through Printable Battery Manufacturing
The Thin Film and Printed Battery Market is witnessing rapid expansion, driven by breakthroughs in printing technologies that enable faster, cost-effective, and scalable production. Innovations in conductive inks, solid-state electrolytes, and roll-to-roll (R2R) processing have replaced complex vacuum deposition methods, making it easier to produce thin, flexible, and lightweight batteries. These batteries are now easily integrated into compact or curved surfaces, ideal for wearable electronics, smart packaging, and IoT devices. Companies like Blue Spark Technologies and Imprint Energy are leveraging this to deliver bendable power solutions. The seamless integration of printed batteries with sensors and circuits on a single substrate also supports the growth of multifunctional smart devices, transforming the future of portable and flexible electronics.
Restraints:
-
High production costs and specialized equipment requirements limit large-scale commercialization of thin film and printed batteries.
High initial production costs remain a significant restraint for the thin film and printed battery market, despite the ongoing advancements in fabrication technologies. Manufacturing these batteries involves sophisticated processes like vacuum deposition, sputtering, or roll-to-roll printing that require expensive, specialized equipment. Moreover, the raw materials used such as advanced polymers, nano-structured electrodes, and custom electrolytesare often costly and not yet widely available at scale. This creates a financial barrier for many manufacturers looking to move from R&D or pilot phases to full-scale commercial production. As a result, companies face challenges in achieving cost competitiveness with traditional battery technologies, delaying broader market adoption across high-volume applications.
Opportunities:
-
Powering the Future of Wearables with Thin and Flexible Battery Solutions
The growing demand for flexible and wearable electronics is a major opportunity driving the thin film and printed battery market. These batteries are ultra-thin, lightweight and bendable, and can be integrated into modern wearables in the healthcare, consumer electronics, and fitness industries. In health care, they enable continuous glucose monitors, smart patches and other biosensors with little discomfort to patients. In consumer and fitness markets, they enable smart-watches, fitness bands, and wearable health trackers in areas where traditional batteries are not feasible. Thin film and printed batteries are emerging as a preferred energy source across portable and wearable applications as consumers are looking for compact, ergonomic, and multifunctional products. Their usefulness only increases by their ability to mold into different shapes and surfaces.
Challenges:
-
Limited energy density, scalability issues, high production costs, and lack of standards challenge the widespread adoption of thin film and printed batteries.
A major hurdle is the low energy density compared to conventional lithium-ion batteries, making them unsuitable for high-power applications. Manufacturing scalability also remains an issue due to the complexity of maintaining consistent quality in printed layers. Additionally, these batteries often have shorter cycle life and limited power output, reducing their appeal for long-term or intensive use. High initial R&D and production setup costs deter small manufacturers from entering the market. Furthermore, recyclability concerns and lack of established industry standards pose sustainability and compliance challenges. These factors collectively restrain broader commercialization and adoption.
Thin Film and Printed Battery Industry Segmentation Outlook:
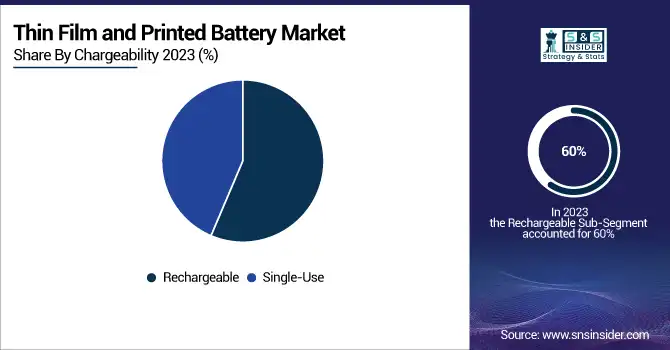
By Chargeability
The rechargeable segment dominated the thin film and printed battery market in 2023, accounting for approximately 60% of the total revenue share. This dominance is attributed to the growing demand for sustainable and reusable energy solutions across consumer electronics, medical devices, and smart wearables. Rechargeable thin film batteries offer longer life cycles, lower environmental impact, and improved cost efficiency over time, making them a preferred choice in various applications. Advancements in battery chemistry and flexible designs have further enhanced their performance, enabling seamless integration into compact and bendable devices. As industries shift toward greener technologies, the focus on rechargeable options continues to rise, positioning this segment as a key contributor to market growth and technological evolution.
The single-use segment is expected to witness steady growth from 2024 to 2032 due to its suitability for low-power, disposable applications such as medical diagnostics, smart packaging, and one-time-use sensors. These batteries are ideal where recharging is not feasible or cost-effective, offering a reliable and compact power source for short-term use. Growing demand in sectors like pharmaceuticals and logistics, where monitoring and traceability are critical, continues to drive adoption. Additionally, the rise in smart label technologies and environmental sensors supports the segment’s relevance. Despite competition from rechargeable alternatives, innovations aimed at improving energy density and reducing production costs are helping sustain the single-use battery segment as a vital niche in the evolving thin film and printed battery market.
By Voltage
In 2023, the Below 1.5 V segment held the largest share of the thin film and printed battery market, capturing around 51% of total revenue. This dominance is driven by the growing demand for compact, energy-efficient batteries used in low-power applications such as RFID tags, smart labels, wearable sensors, and disposable medical devices. These batteries are ideal for devices requiring minimal voltage and are favored for their thin, flexible design and easy integration into compact electronics. The segment benefits from rising adoption in consumer electronics and healthcare, where ultra-lightweight and cost-effective power sources are essential. As flexible electronics continue to expand, the Below 1.5 V category is expected to maintain strong growth due to its adaptability and manufacturing scalability.
The Above 3 V segment is projected to be the fastest-growing category in the thin film and printed battery market during the forecast period from 2024 to 2032. This growth is primarily fueled by the rising demand for high-performance power sources in advanced applications such as medical implants, wireless sensors, military devices, and high-end IoT systems that require greater voltage capacity for extended operation. These batteries offer enhanced energy density and reliability, making them suitable for more demanding environments where power efficiency and long battery life are critical. The ongoing innovations in material science and energy storage technologies are enabling the production of high-voltage thin film batteries with improved safety and flexibility, accelerating adoption across various high-growth industries globally.
By Application
The consumer electronics segment dominated the thin film and printed battery market in 2023, accounting for approximately 34% of the total revenue share. This dominance is primarily driven by the increasing adoption of compact, lightweight, and flexible batteries in devices such as smartwatches, wireless earbuds, fitness trackers, and foldable phones. The trend toward miniaturization in electronics and the growing demand for enhanced user experiences with longer battery life and sleeker designs have significantly boosted the use of thin film and printed batteries. Moreover, advancements in battery efficiency, safety, and integration capabilities are aligning well with the evolving needs of the consumer electronics industry, ensuring sustained demand and maintaining its lead as the top application area within this rapidly growing market.
The medical devices segment is the fastest-growing application area in the thin film and printed battery market for the forecast period 2024 to 2032, driven by rising demand for compact, lightweight, and flexible power sources in wearable and implantable healthcare devices. These batteries are ideal for powering devices like smart patches, biosensors, and drug delivery systems due to their safety, thinness, and adaptability to skin-contact applications. With increasing focus on remote patient monitoring, continuous health tracking, and the expansion of digital healthcare solutions, medical device manufacturers are adopting innovative battery technologies to improve functionality and patient comfort. Technological advancements and regulatory support for medical innovations are further accelerating growth, positioning this segment as a major contributor to market expansion.
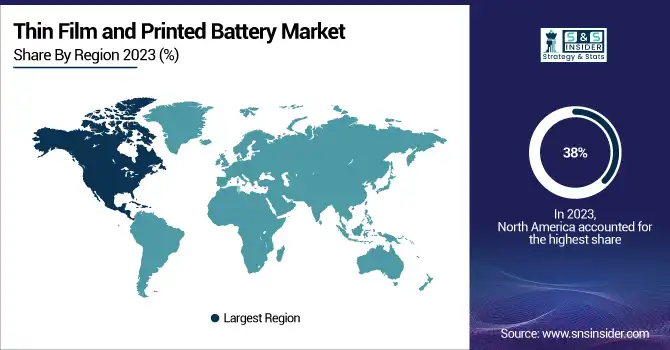
Thin Film and Printed Battery Market Regional Analysis:
North America dominated the thin film and printed battery market with the largest revenue share of approximately 38% in 2023, primarily driven by strong technological infrastructure, significant R&D investments, and early adoption of advanced electronics. The United States, in particular, plays a crucial role due to its leadership in consumer electronics, medical devices, and IoT-based innovations. The presence of major market players, coupled with robust demand for wearable tech, flexible displays, and implantable medical equipment, has further solidified the region’s dominance. Additionally, government support for clean energy storage solutions and the rising need for compact, flexible power sources in defense and aerospace sectors have positioned North America as a key hub in the global thin film battery ecosystem.
Get Customized Report as per Your Business Requirement - Enquiry Now
The Asia Pacific region is projected to be the fastest-growing market for thin film and printed batteries over the forecast period of 2024 to 2032, driven by rapid industrialization, expanding electronics manufacturing, and rising demand for wearable and portable devices. Countries like China, Japan, South Korea, and India are at the forefront due to strong government support for flexible electronics, robust investments in renewable energy storage, and a booming consumer electronics sector. Additionally, the growing focus on electric vehicles, medical wearables, and IoT devices is accelerating adoption across key industries. The presence of leading manufacturers, low production costs, and a thriving export ecosystem position Asia Pacific as a vital hub for innovation and large-scale deployment in this market.
Key Players Listed in Thin Film and Printed Battery Market are:
-
Molex LLC (USA) – Converter and solution provider offering flexible printed circuits and micro-battery connectors for wearables.
-
Varta AG (Germany) – Battery manufacturer producing micro lithium-ion and thin film batteries for hearing aids and consumer devices.
-
RENATA SA (Switzerland) – Coin cell and microbattery maker supplying thin film batteries for medical and precision electronics.
-
Enfucell Flexible Electronics Ltd (Finland) – Printed battery innovator creating SoftBattery® for smart packaging and health sensors.
-
STMicroelectronics NV (Switzerland/France) – Semiconductor converter integrating thin film batteries into IoT and sensor systems.
-
Samsung SDI Co Ltd (South Korea) – Lithium battery manufacturer developing flexible and thin batteries for consumer electronics and healthcare.
-
Ultralife Corporation (USA) – Specialty battery supplier offering thin cell and rechargeable packs for defense, medical, and industrial sectors.
-
Ilika plc (UK) – Solid-state battery developer producing Stereax® thin film batteries for implants and industrial IoT.
-
Imprint Energy (USA) – Flexible battery startup creating printable zinc-based rechargeable batteries for logistics and wearables.
-
Excellatron Solid State LLC (USA) – Advanced battery tech firm providing solid-state thin film batteries for aerospace and high-end electronics.
List of Suppliers Who Provide raw material and component in Thin Film and Printed Battery Market:
-
3M Company
-
DuPont de Nemours, Inc.
-
Henkel AG & Co. KGaA
-
BASF SE
-
Mitsubishi Chemical Corporation
-
Arkema Group
-
Solvay SA
-
Hitachi Chemical Co., Ltd.
-
Dow Inc.
-
Asahi Kasei Corporation
Thin Film and Printed Battery Market Trends:
-
May 13 2024, IDTechEx explores how printed electronics, especially transparent conductive films and flexible sensors, are reshaping autonomous mobility through enhanced sensing, defogging, and heating applications in vehicles – DTechEx Explores Printed Electronics in Electrified and Autonomous Mobility.
| Report Attributes | Details |
|---|---|
| Market Size in 2023 | USD 178.23 Million |
| Market Size by 2032 | USD 1374.74 Million |
| CAGR | CAGR of 25.48% From 2024 to 2032 |
| Base Year | 2023 |
| Forecast Period | 2024-2032 |
| Historical Data | 2020-2022 |
| Report Scope & Coverage | Market Size, Segments Analysis, Competitive Landscape, Regional Analysis, DROC & SWOT Analysis, Forecast Outlook |
| Key Segments | • By Voltage Rating (Below 1.5V, 1.5-3V, Above 3V) • By Chargeability (Rechargeable, Single-Use) • By Application (Consumer Electronics, Medical Devices, Smart Packaging, Smart Cards, Wireless Sensors) |
| Regional Analysis/Coverage | North America (US, Canada, Mexico), Europe (Eastern Europe [Poland, Romania, Hungary, Turkey, Rest of Eastern Europe] Western Europe] Germany, France, UK, Italy, Spain, Netherlands, Switzerland, Austria, Rest of Western Europe]), Asia-Pacific (China, India, Japan, South Korea, Vietnam, Singapore, Australia, Rest of Asia-Pacific), Middle East & Africa (Middle East [UAE, Egypt, Saudi Arabia, Qatar, Rest of Middle East], Africa [Nigeria, South Africa, Rest of Africa], Latin America (Brazil, Argentina, Colombia, Rest of Latin America) |
| Company Profiles | Molex LLC, Varta AG, RENATA SA, Enfucell Flexible Electronics Ltd, STMicroelectronics NV, Samsung SDI Co Ltd, Ultralife Corporation, Ilika plc, Imprint Energy, and Excellatron Solid State LLC are key companies in the thin film and printed battery market. |
